Printable maps of France: regions, relief and population

Flag of France
Flag of France

FRANCE · LABELLED MAPS

Five printable maps of France: regions and cities, location in Europe, two views of the relief and population. PDFs, images and sources are available below.

Our five maps have English labels. Maps from other publishers retain their original language.

Regions, cities and location in Europe

Regions: metropolitan territory and five overseas regions. Relief and population: metropolitan France and Corsica.
Regions of France — map of France

New series · 2026 edition

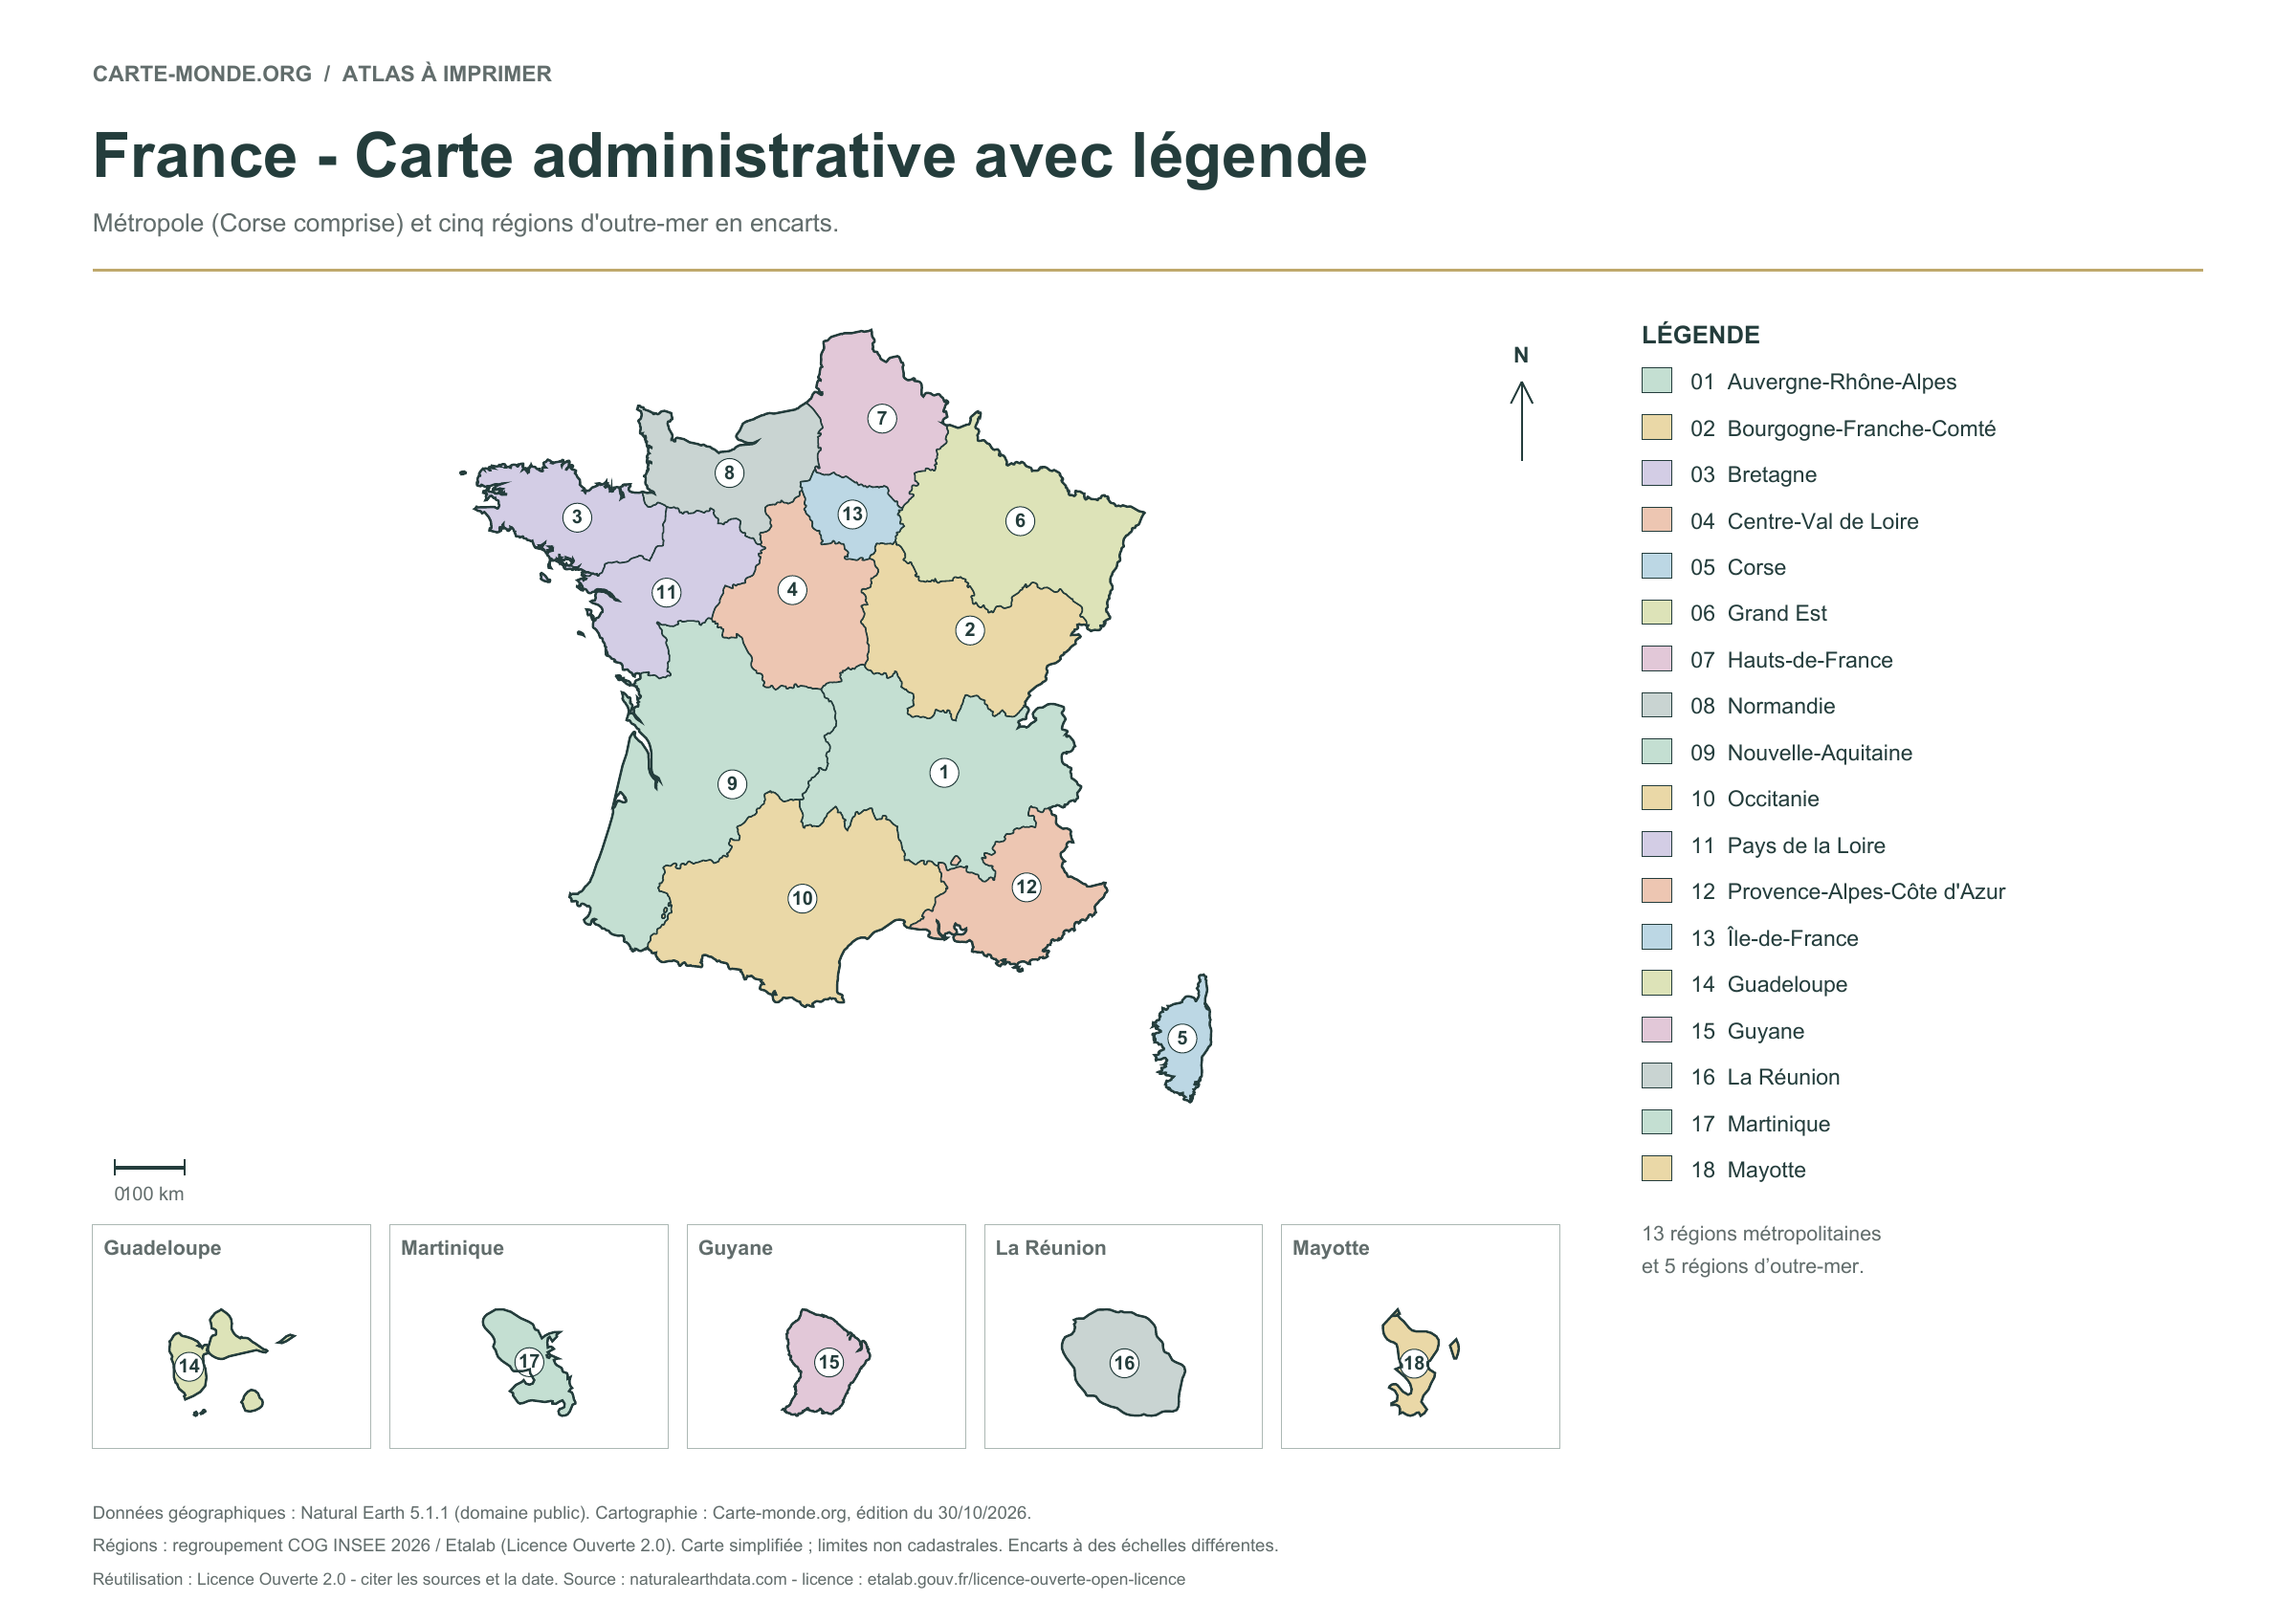
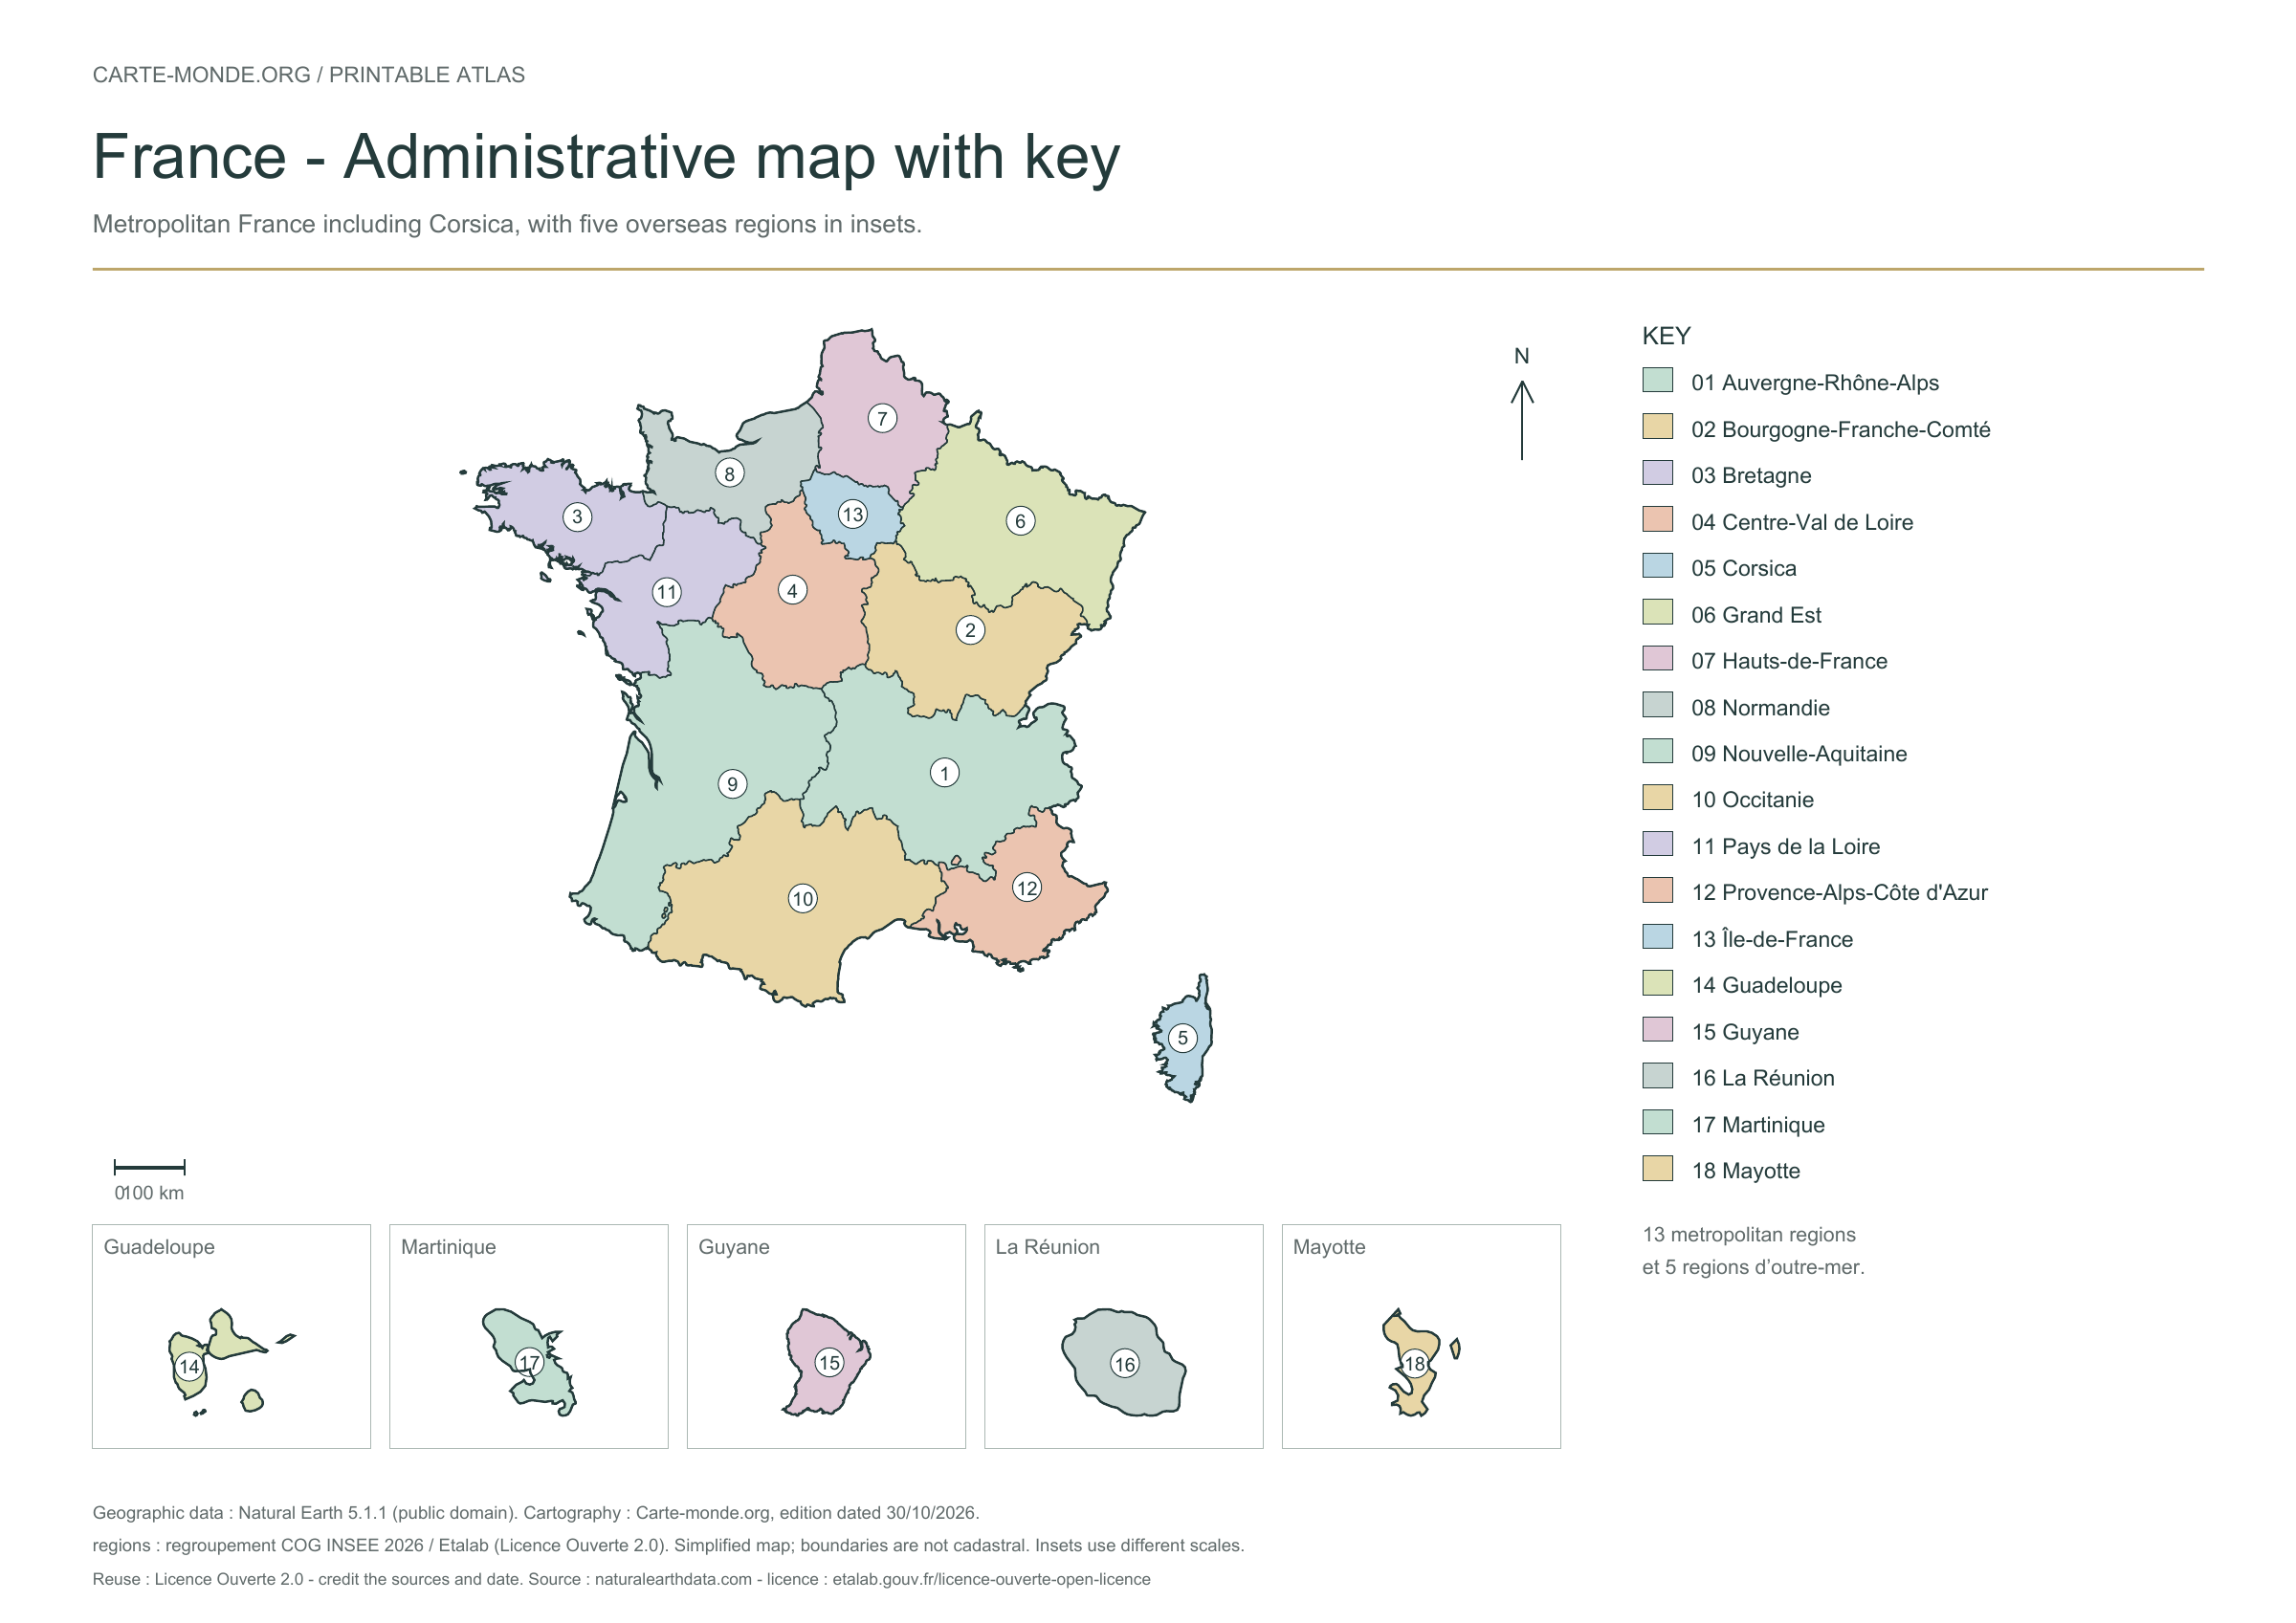
Regions of France

The 13 metropolitan regions and five overseas regions are numbered and named in the key. For named and numbered departments, see the IGN poster below.

A4 vector PDF · PNG 2 400 px · Licence Ouverte 2.0
Location of France in Europe — map of France

New series · 2026 edition

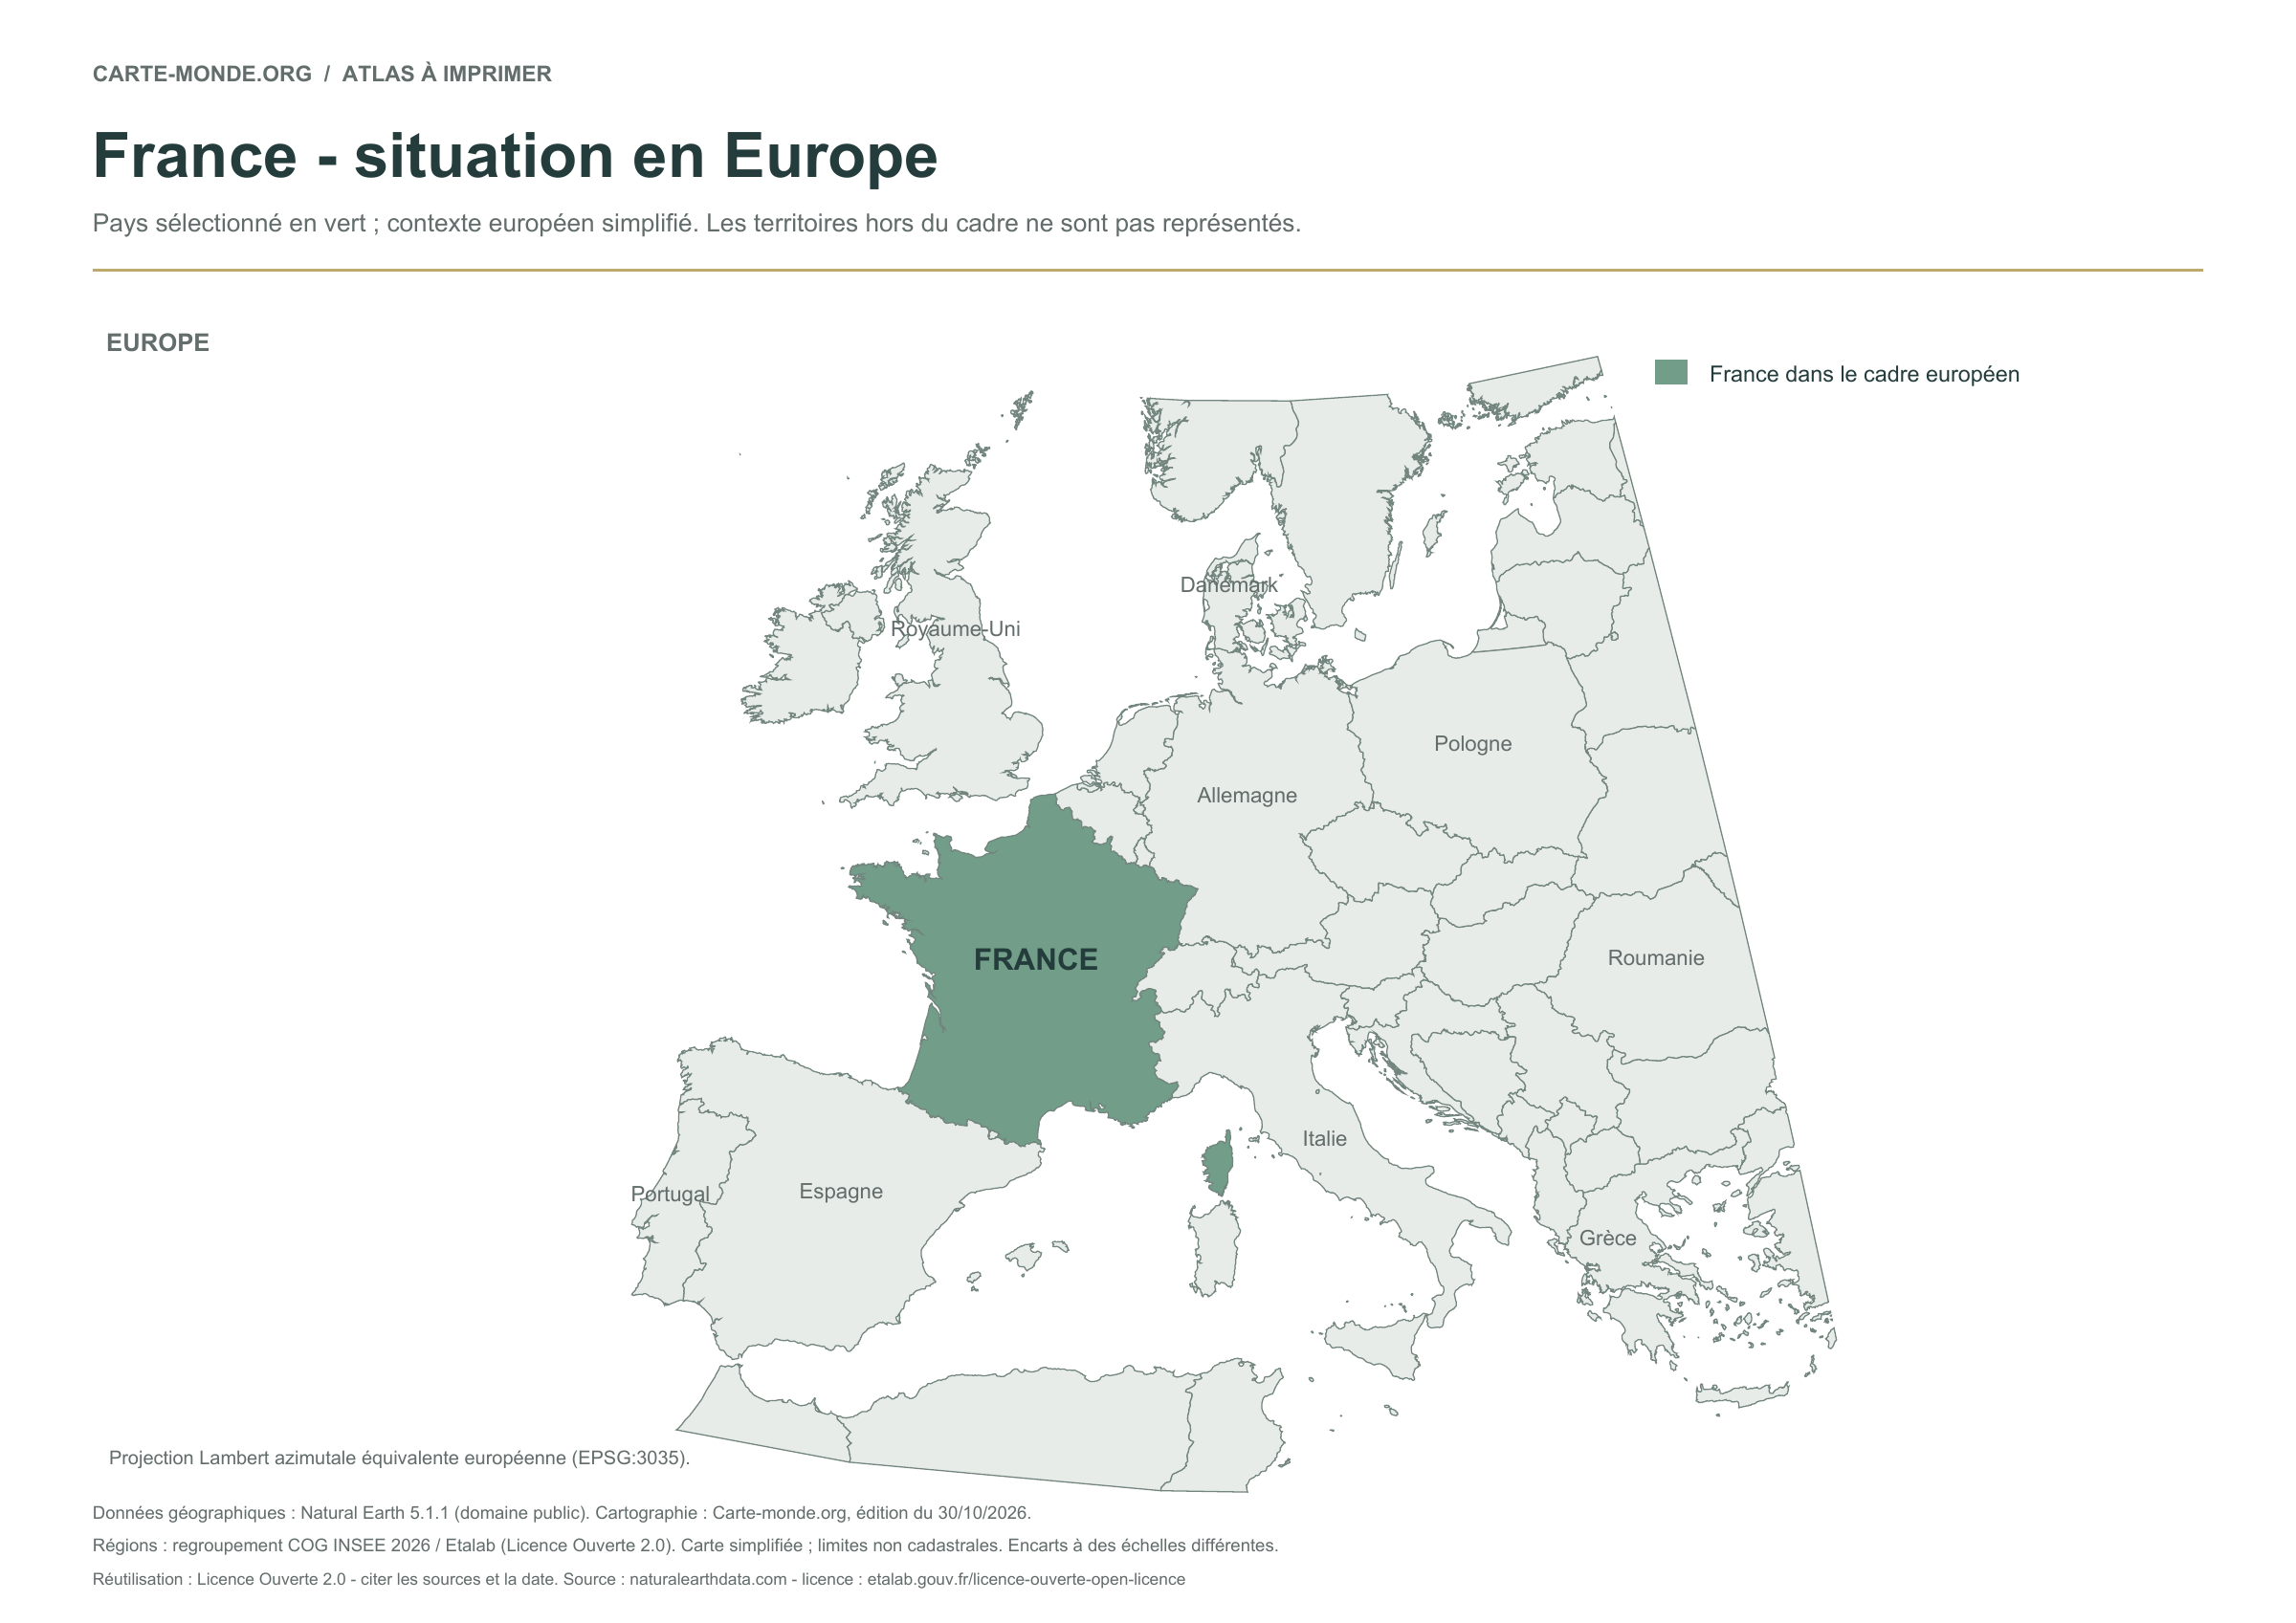
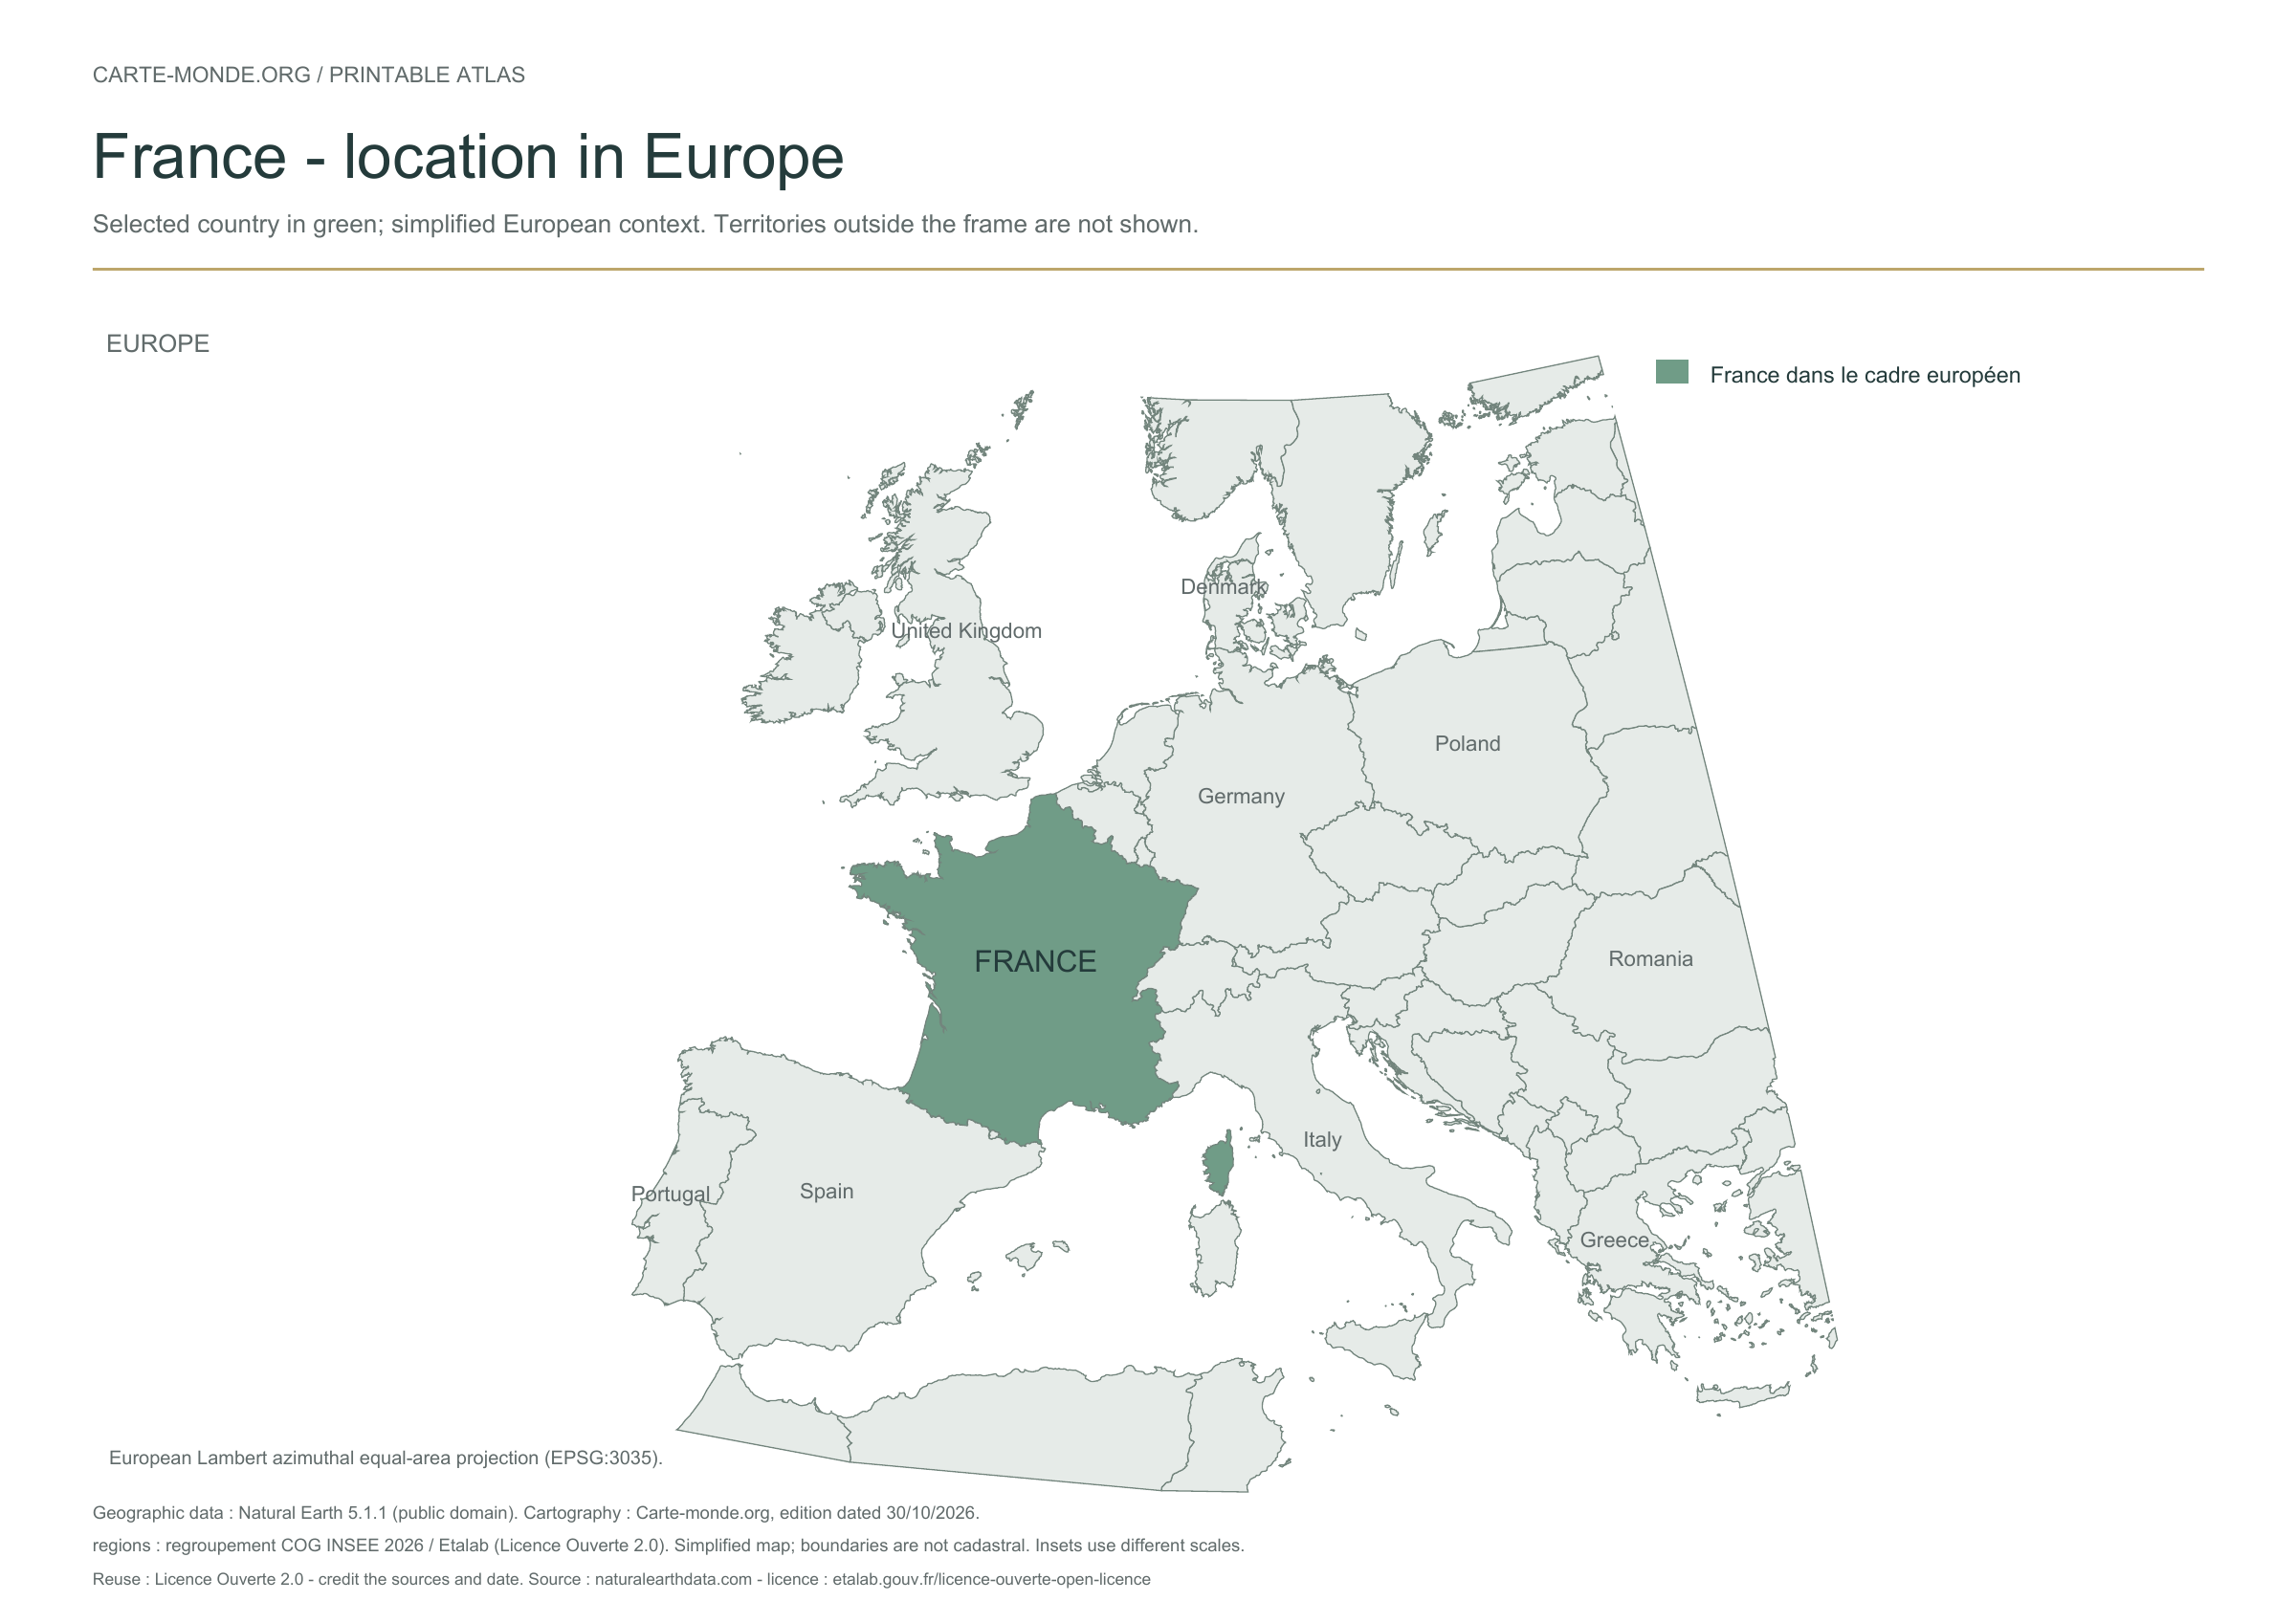
Location of France in Europe

The country is highlighted in colour among European states. Some neighbouring countries are named. This location view covers Europe and does not show territories outside that area.

A4 vector PDF · PNG 2 400 px · Licence Ouverte 2.0

Two maps to understand the relief

Choose shaded relief for an overview, or elevation classes for school use.
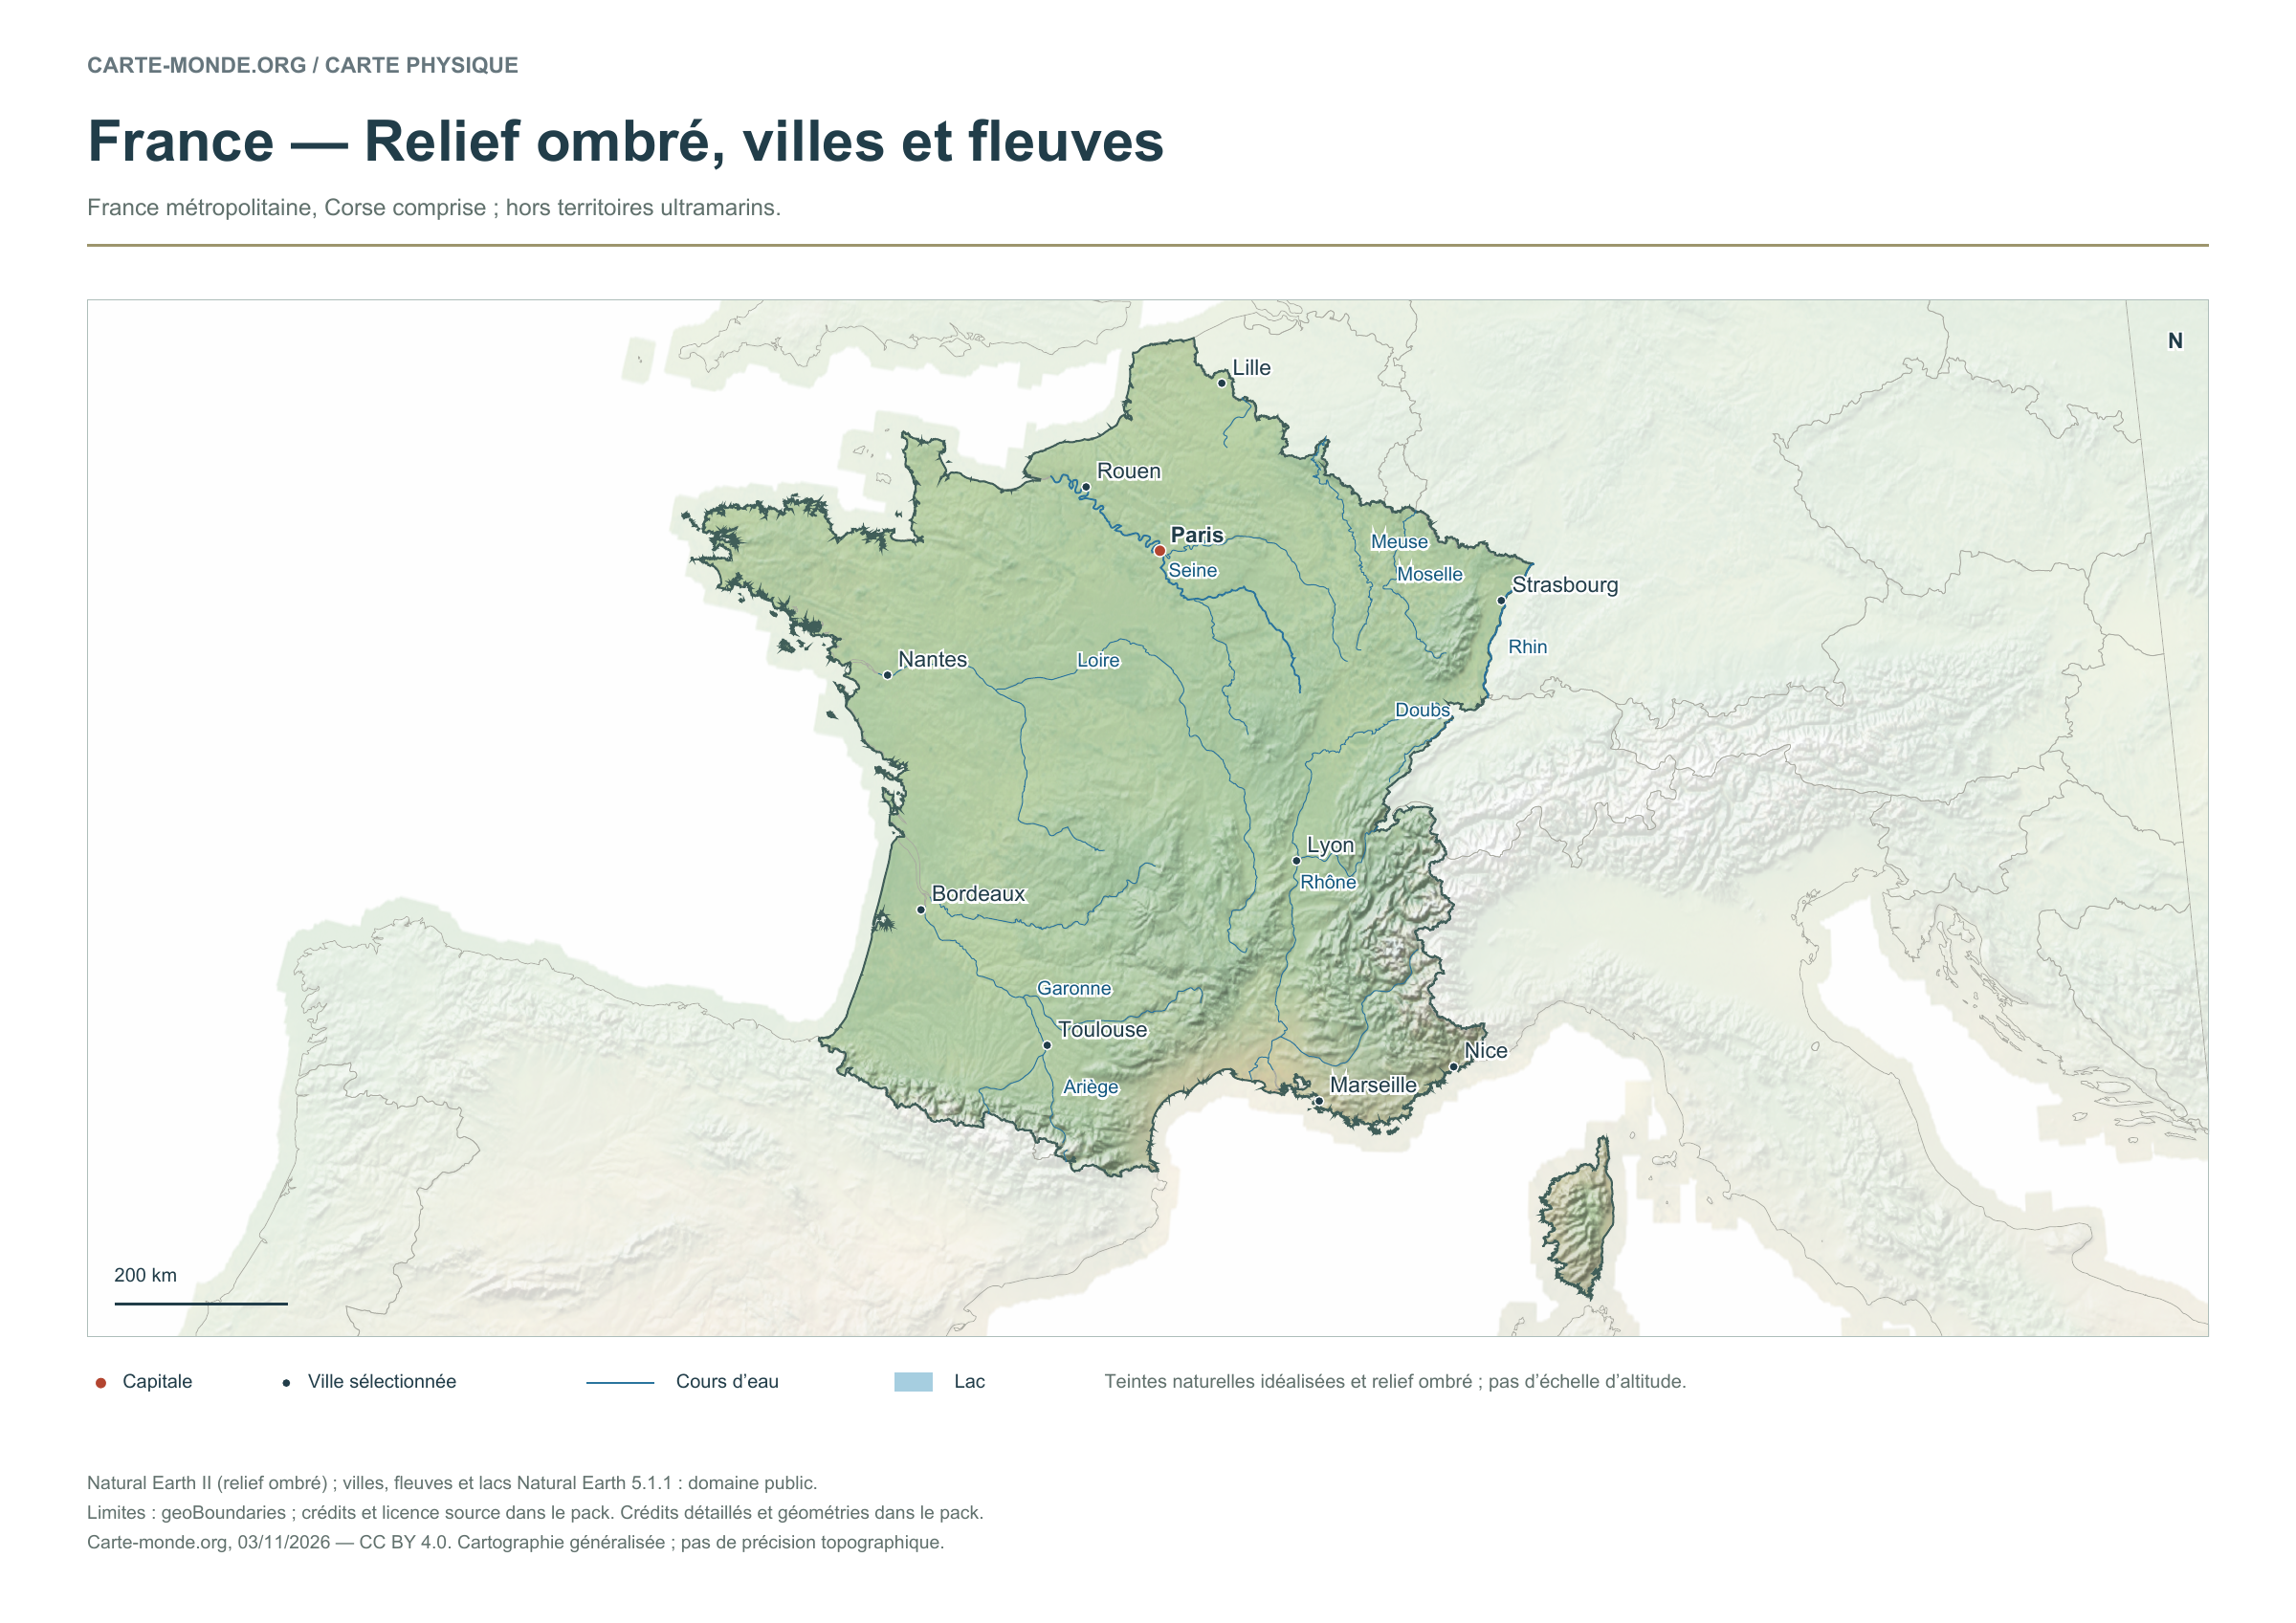
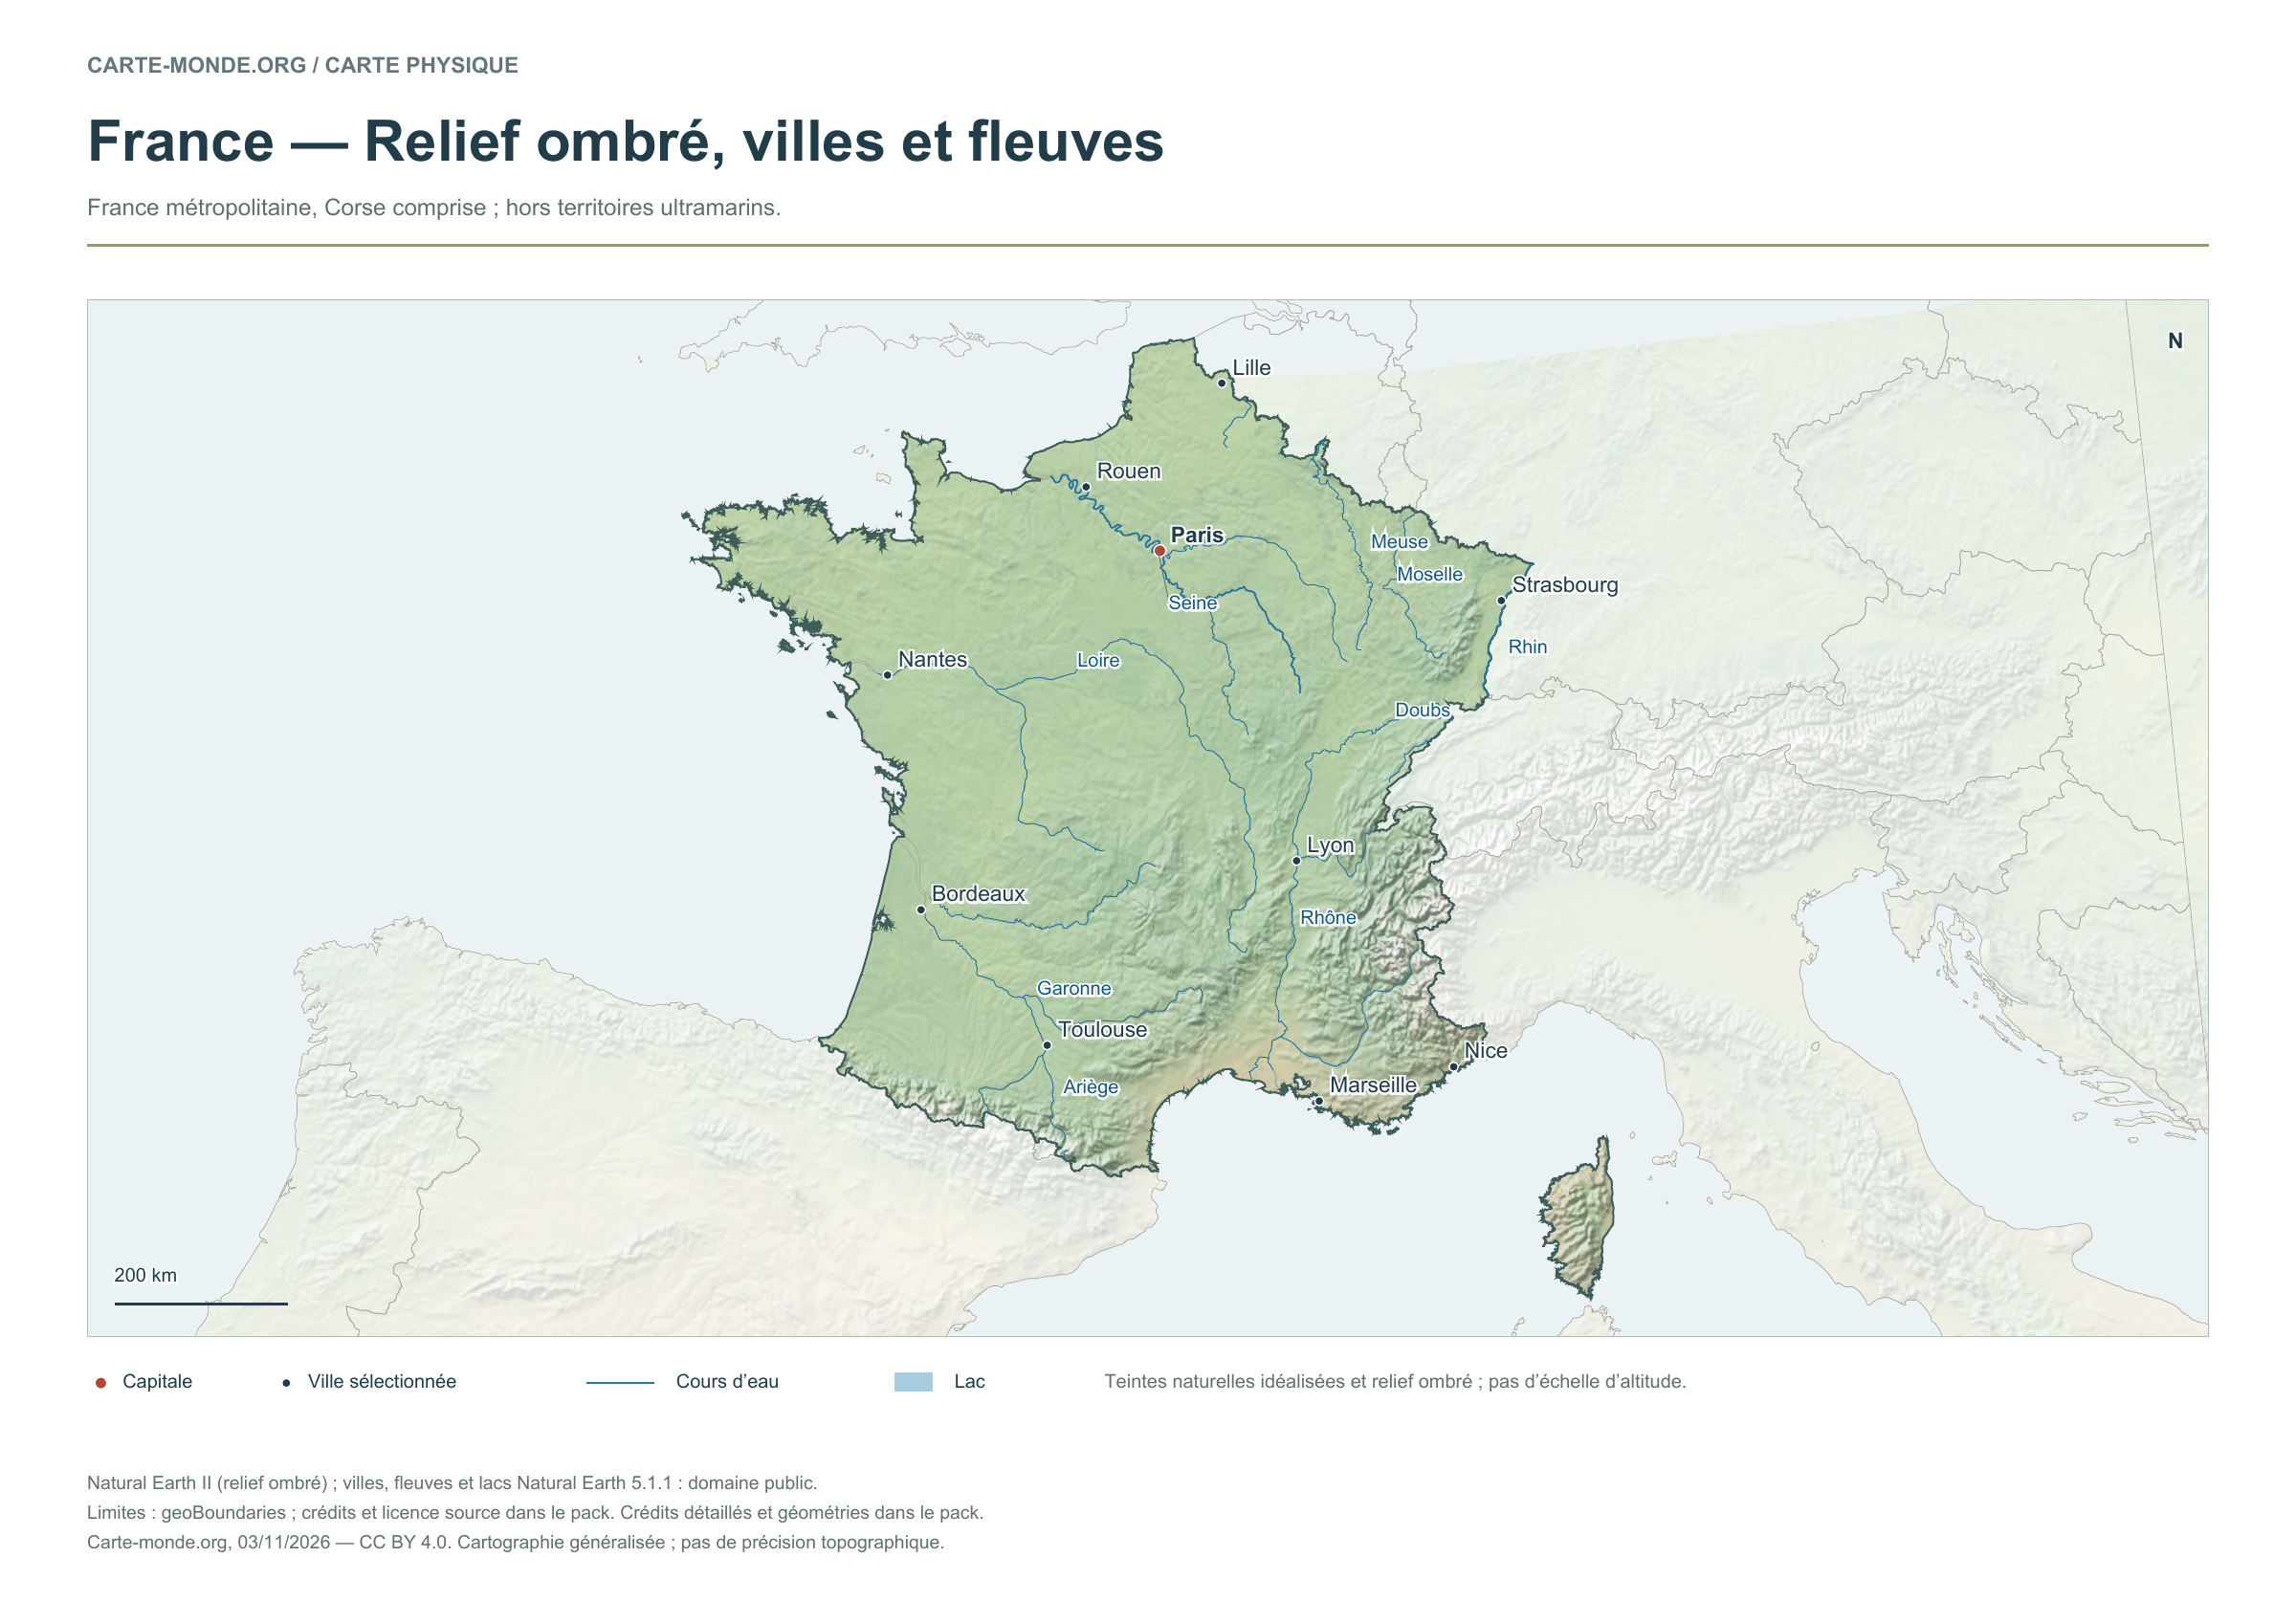
France — Shaded relief, cities and rivers

Carte-monde.org · November 2026

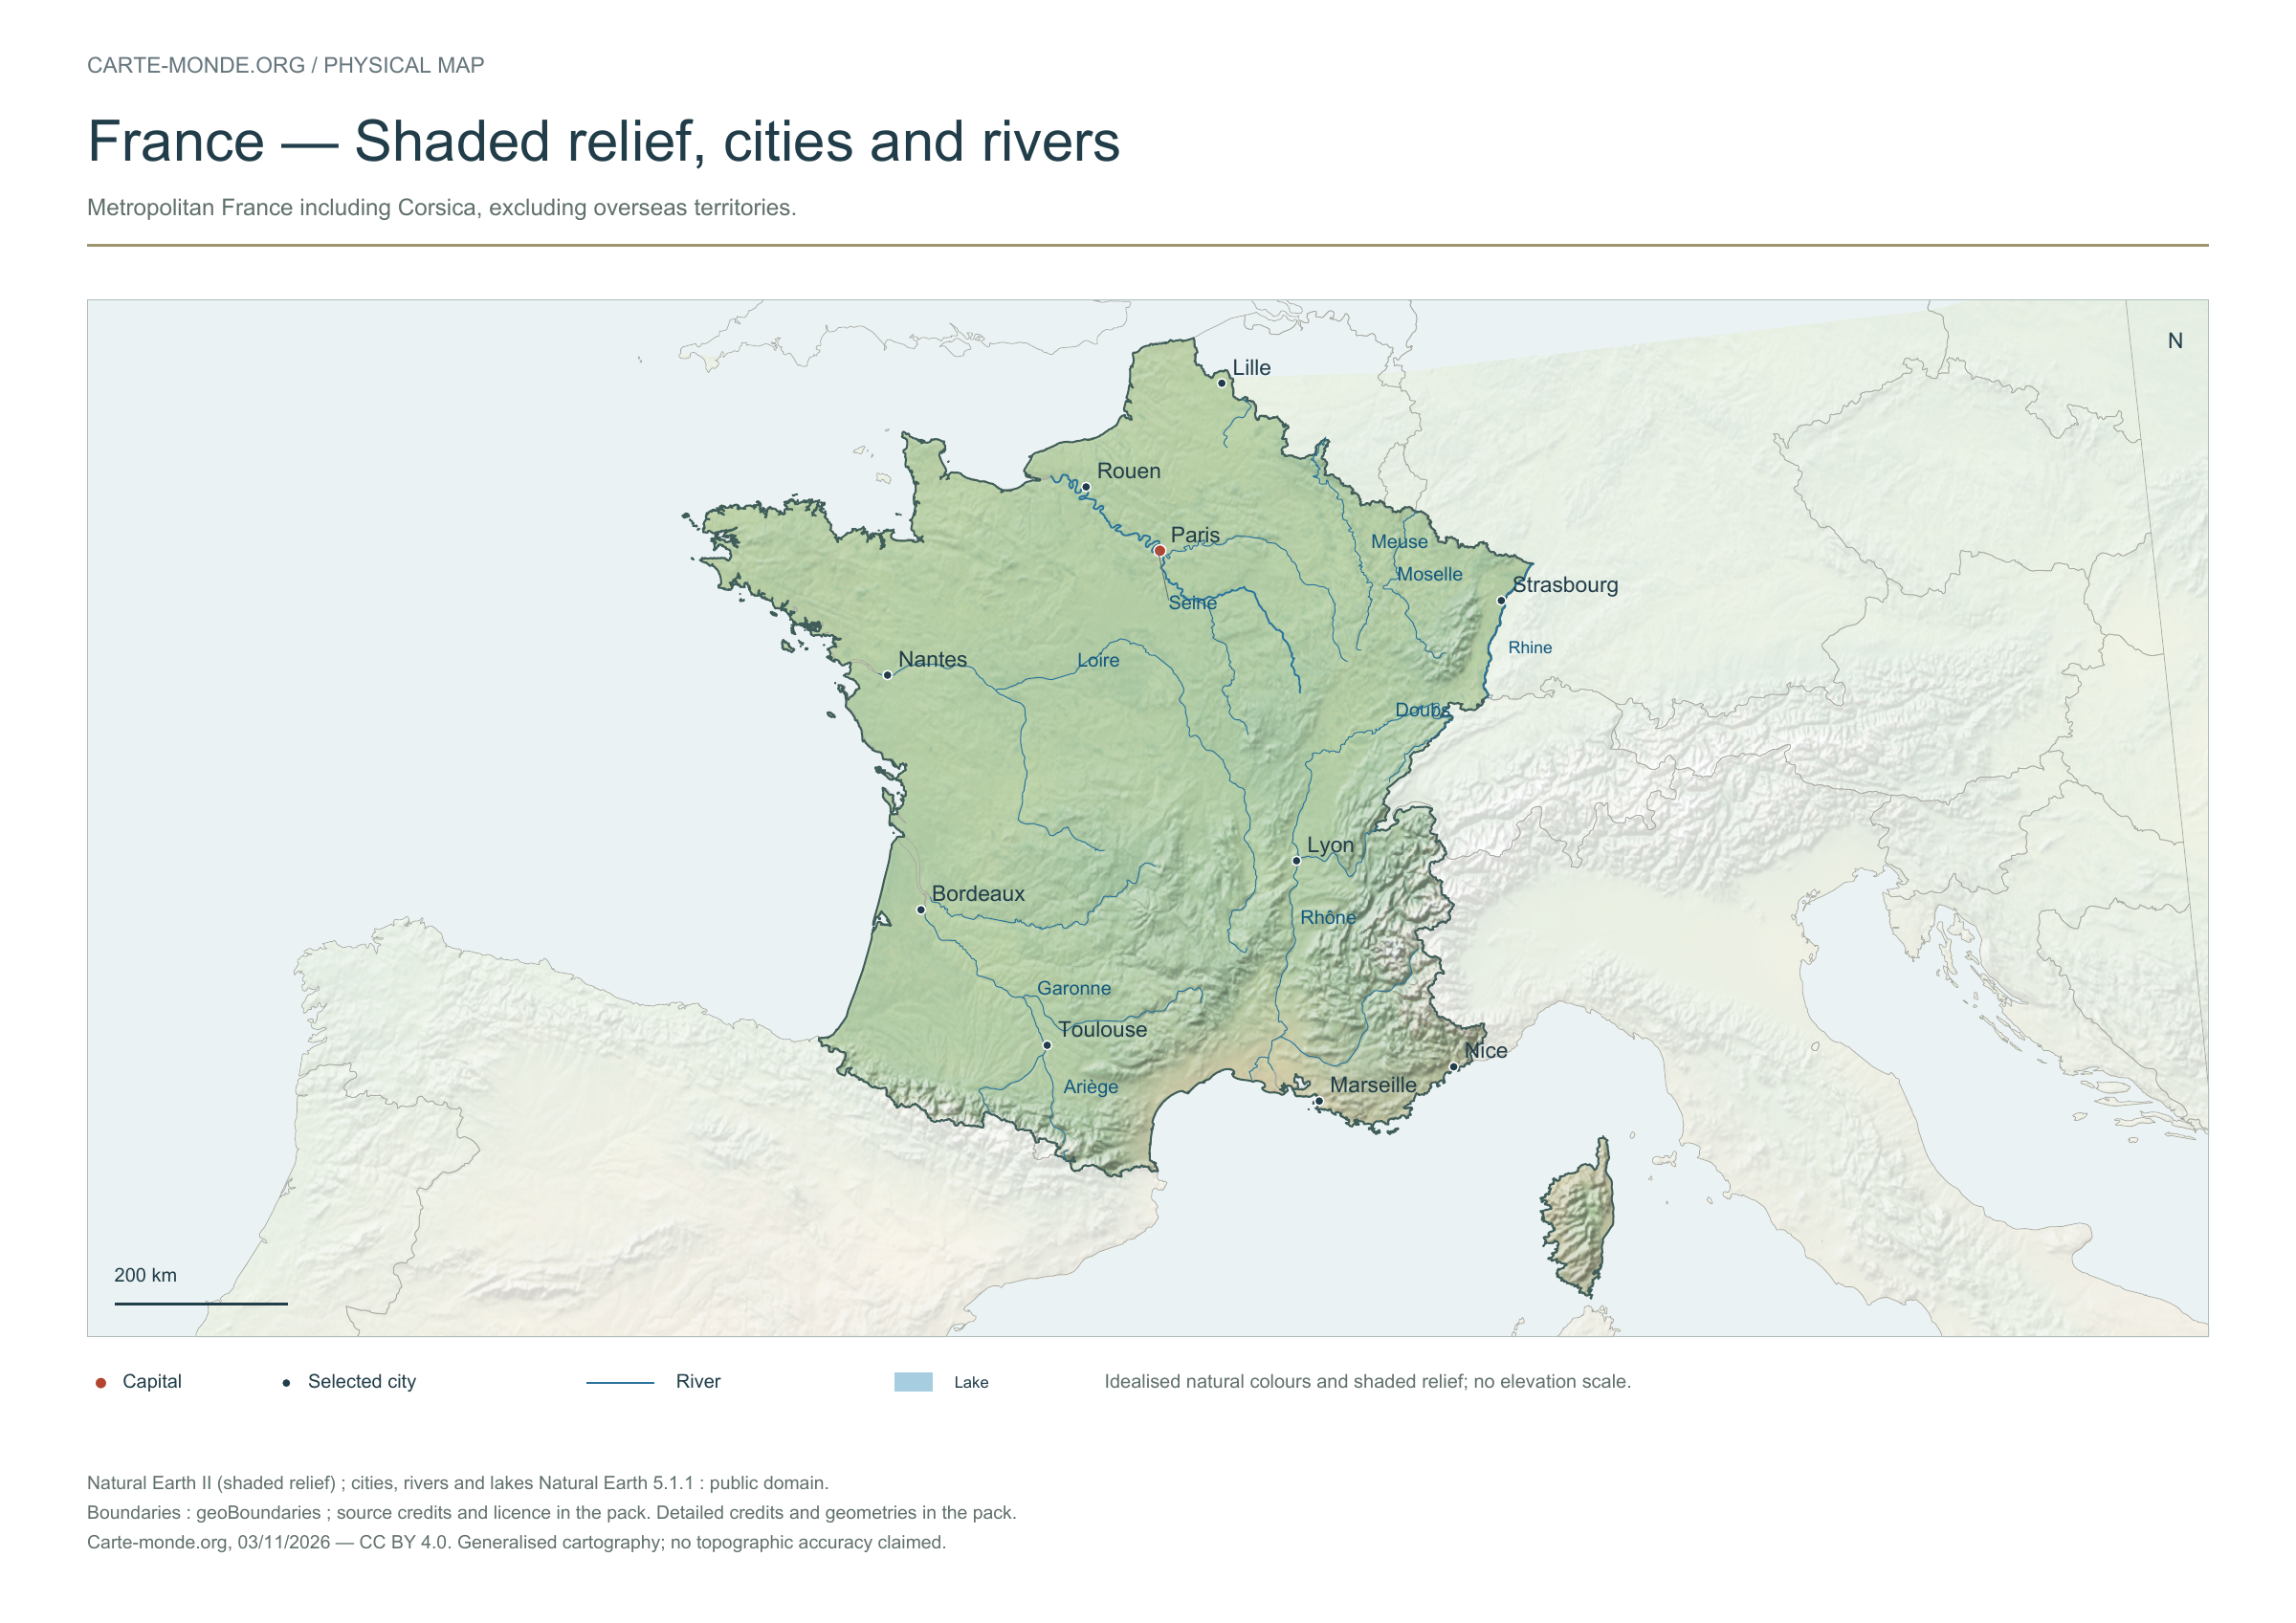
Shaded relief, cities and rivers

To identify major landforms, cities and the river network. The natural colours are not an elevation scale.

Raster base map, cities, rivers and lakes: Natural Earth, public domain. Other boundary credits and licences are retained in the pack. Cartographic work CC BY 4.0; ODbL-derived data retains its licence. No topographic accuracy is claimed.

Territory, data and selection of names

Metropolitan France, including Corsica; excluding overseas territories.

Natural Earth II shaded relief background, 10 selected cities. Named rivers: Ariège, Doubs, Garonne, Loire, Meuse, Moselle, Rhin, Rhône, Seine.

The colours represent idealised natural cover; they do not correspond to elevation classes. This global background remains generalised, particularly for small states.
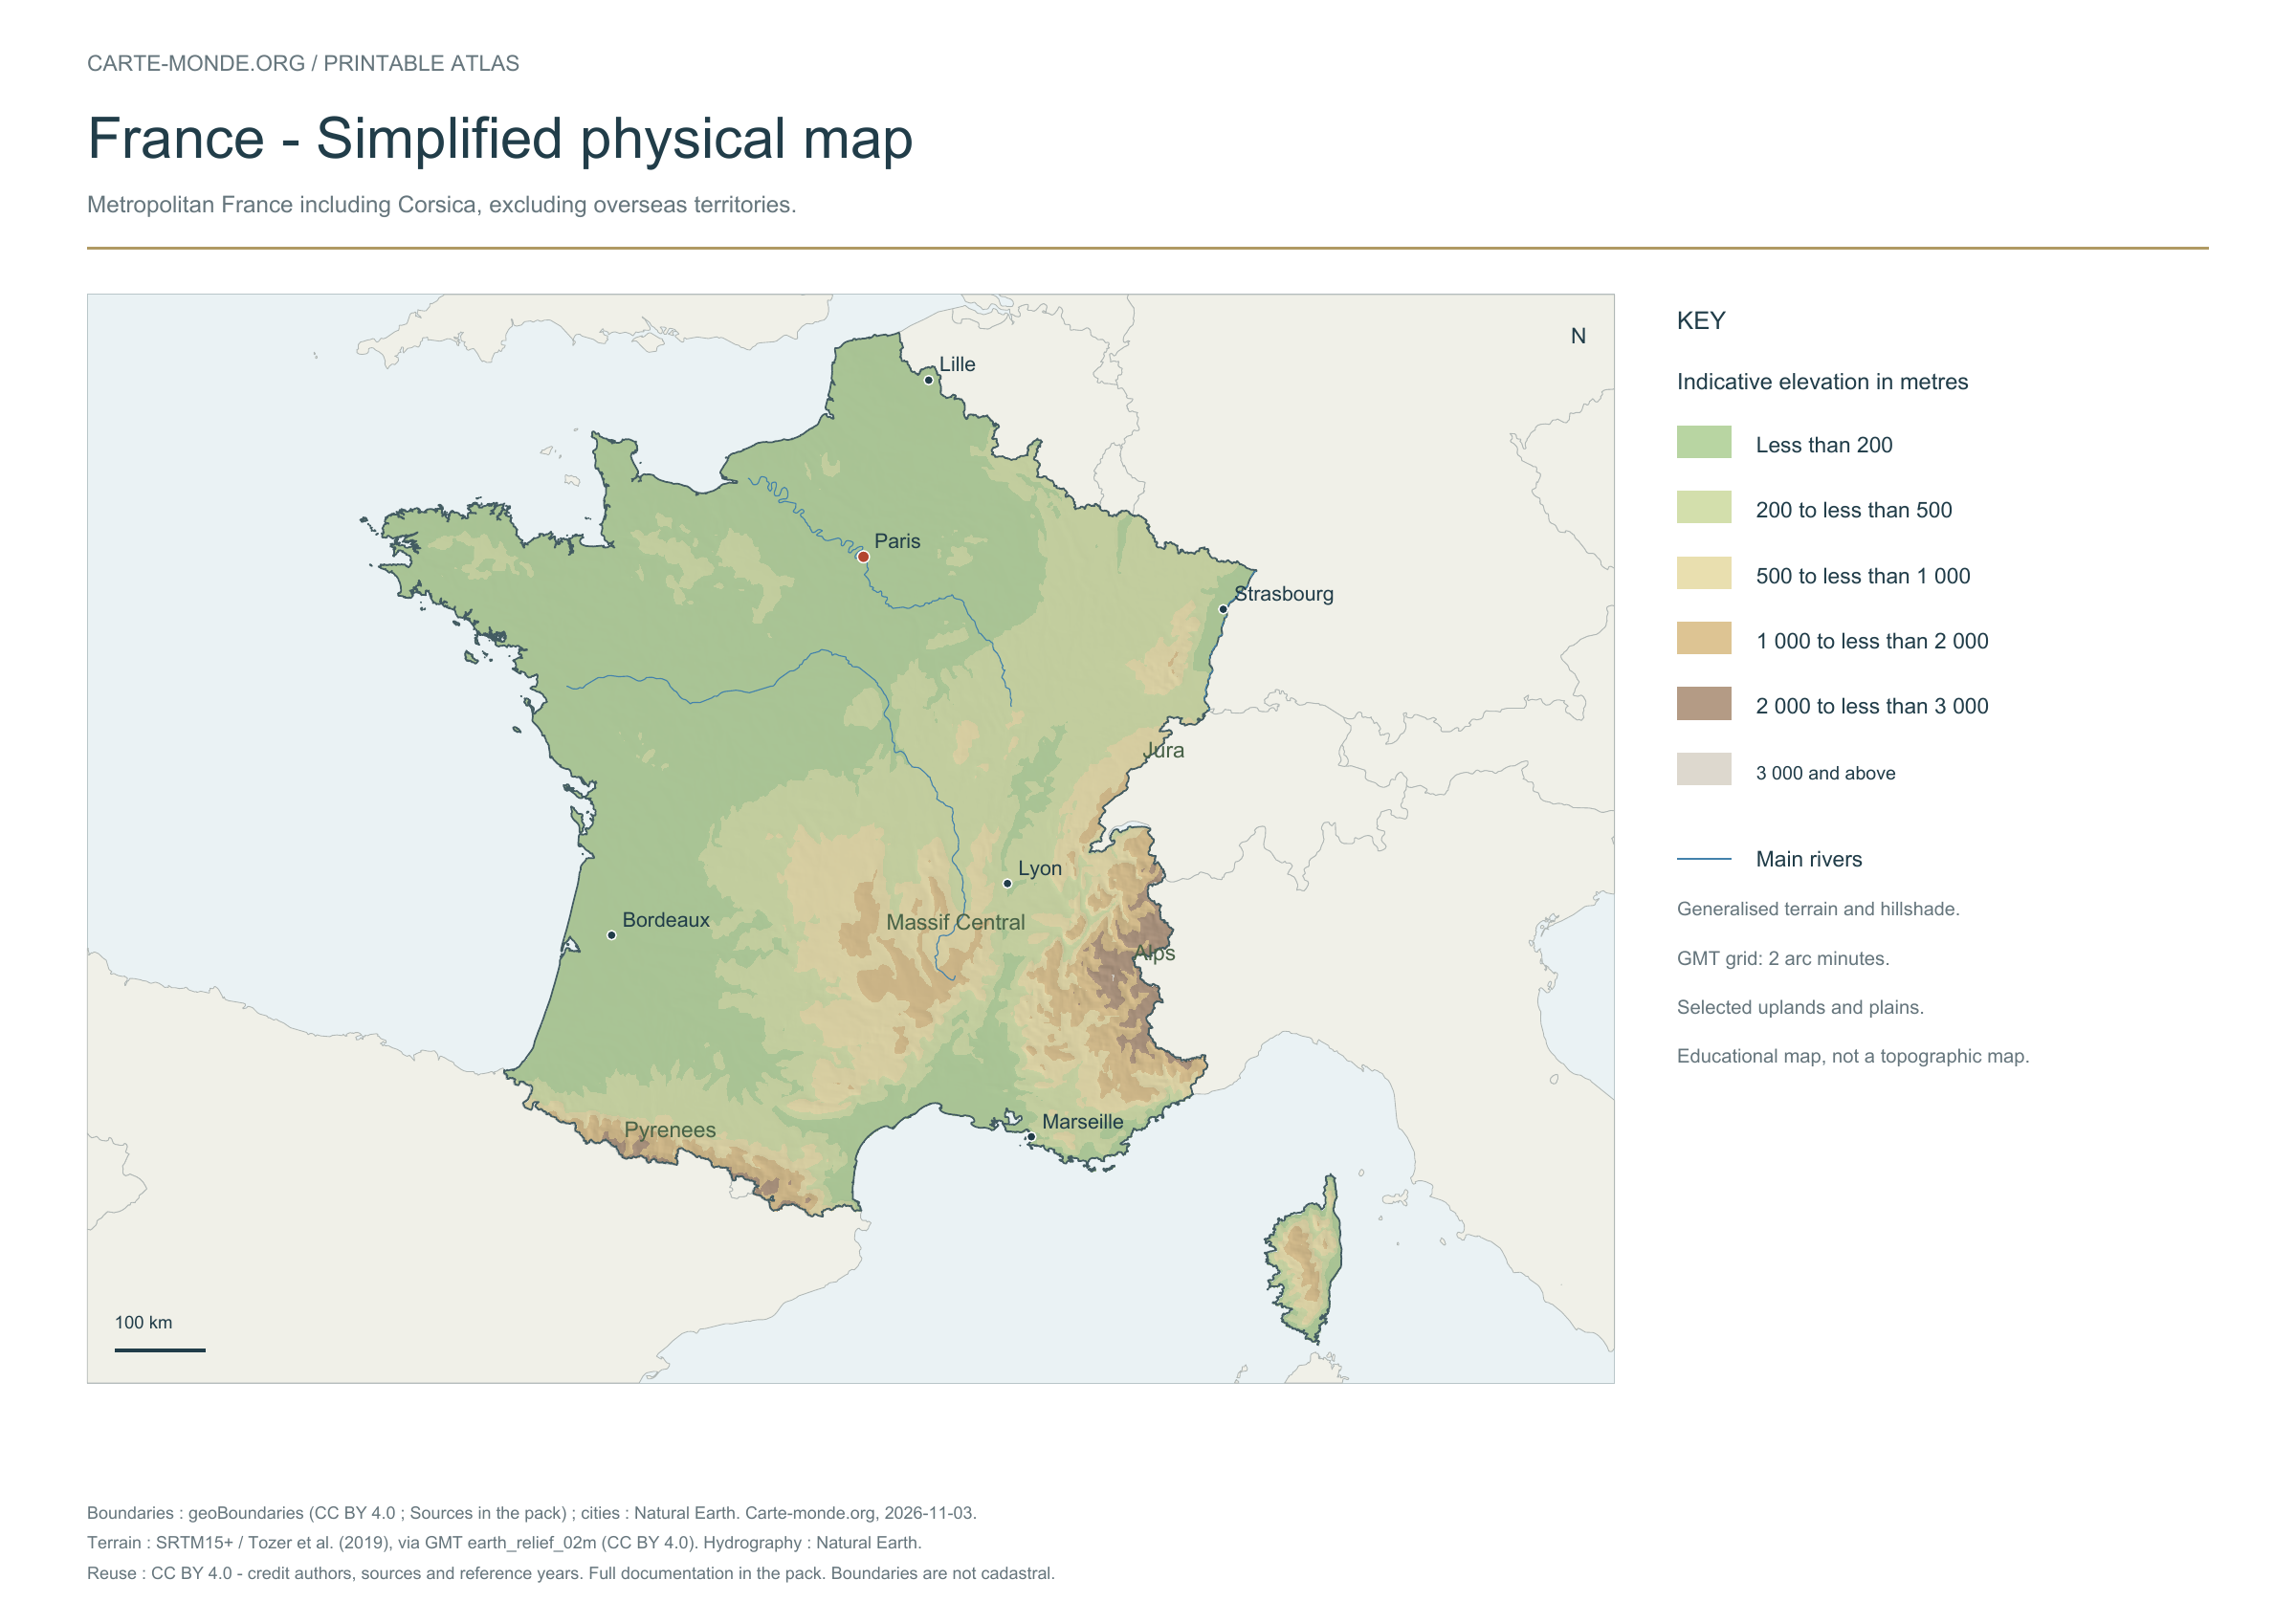
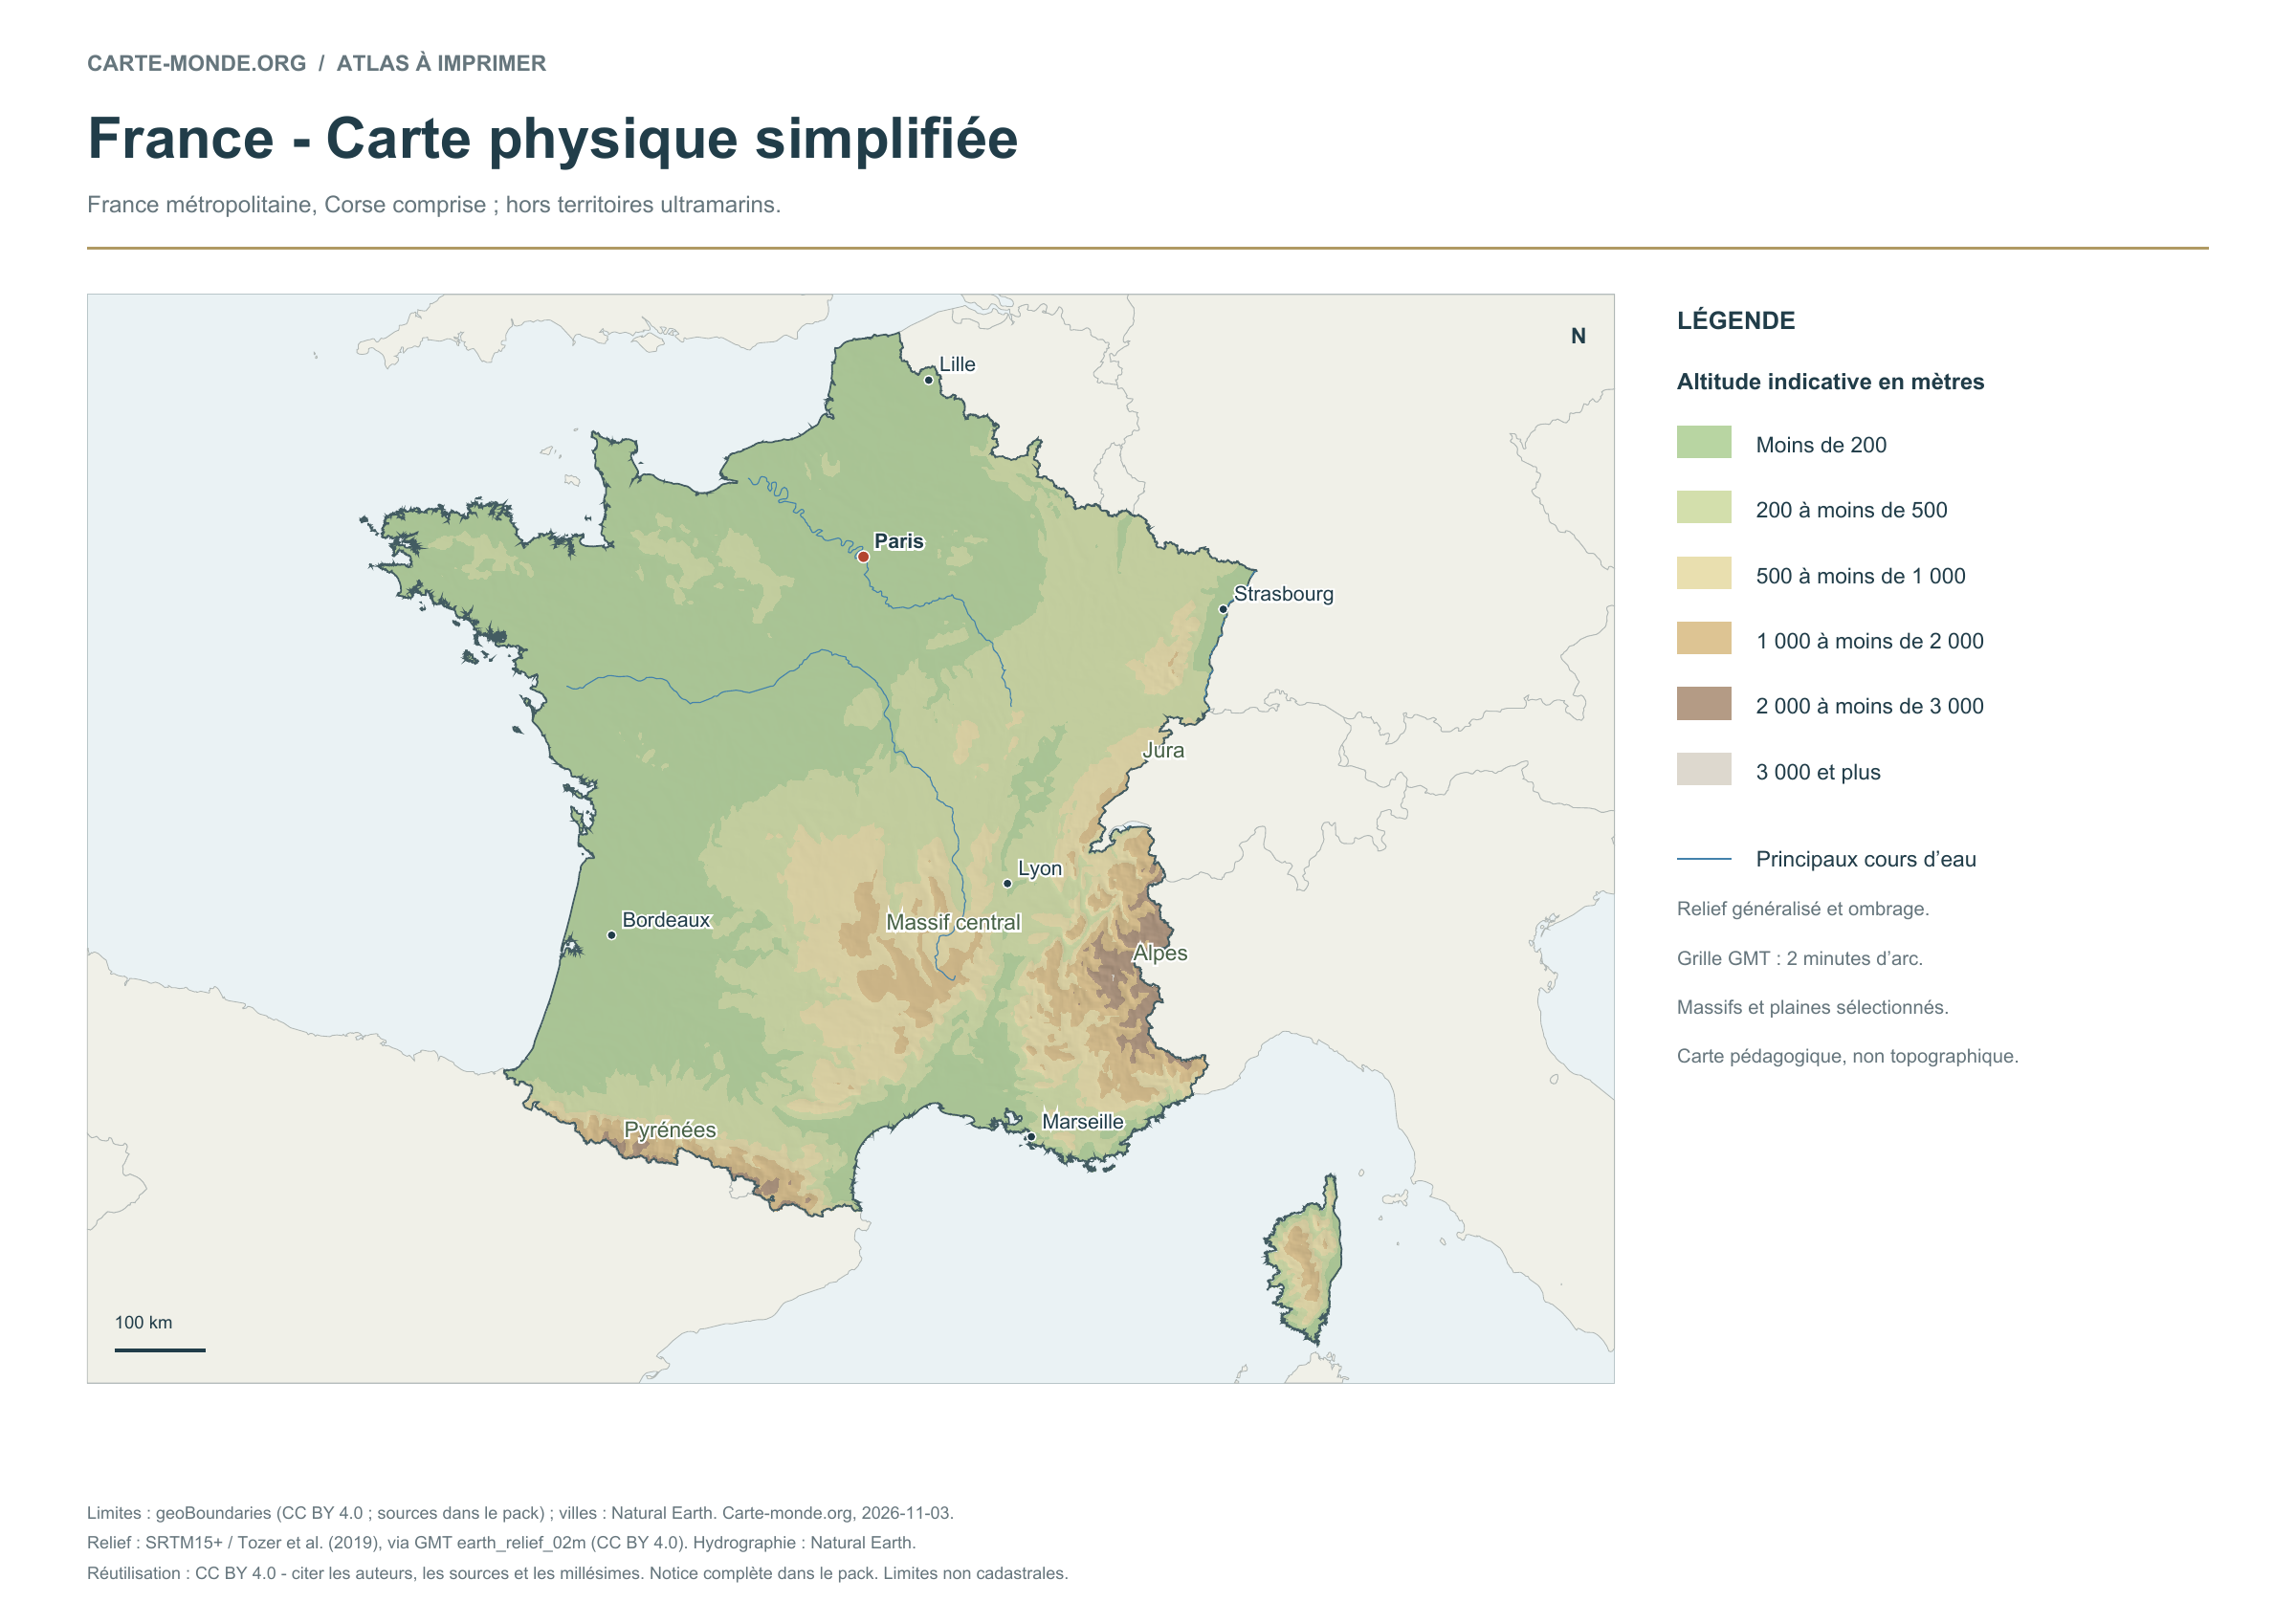
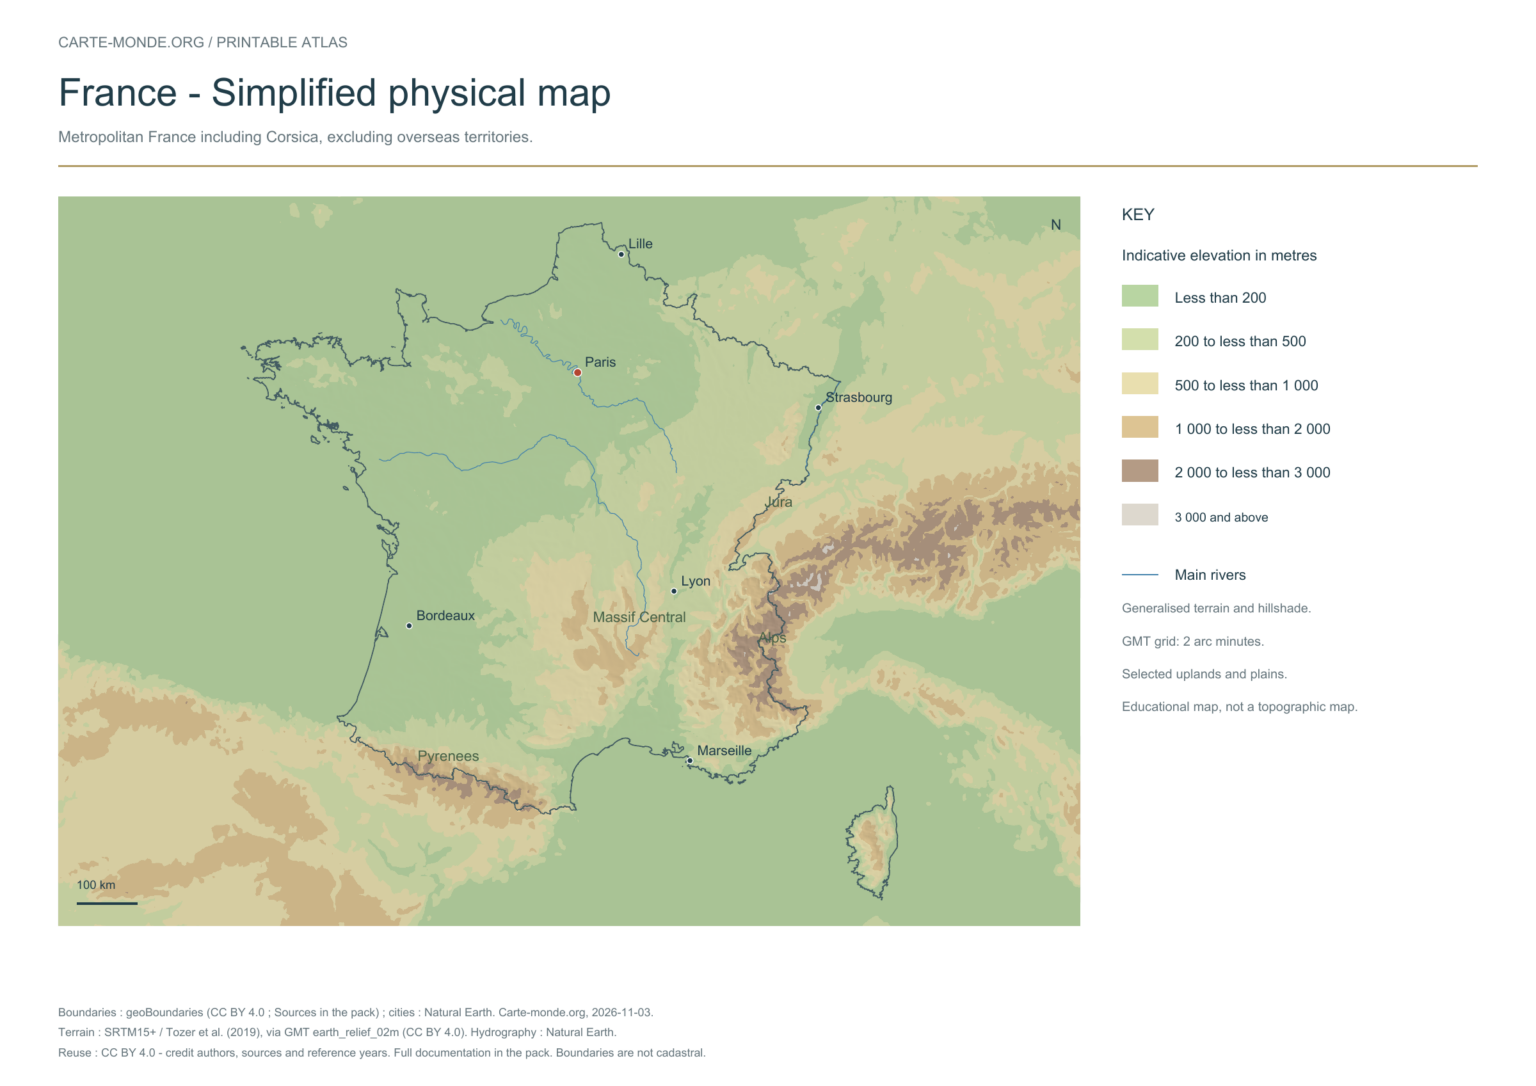
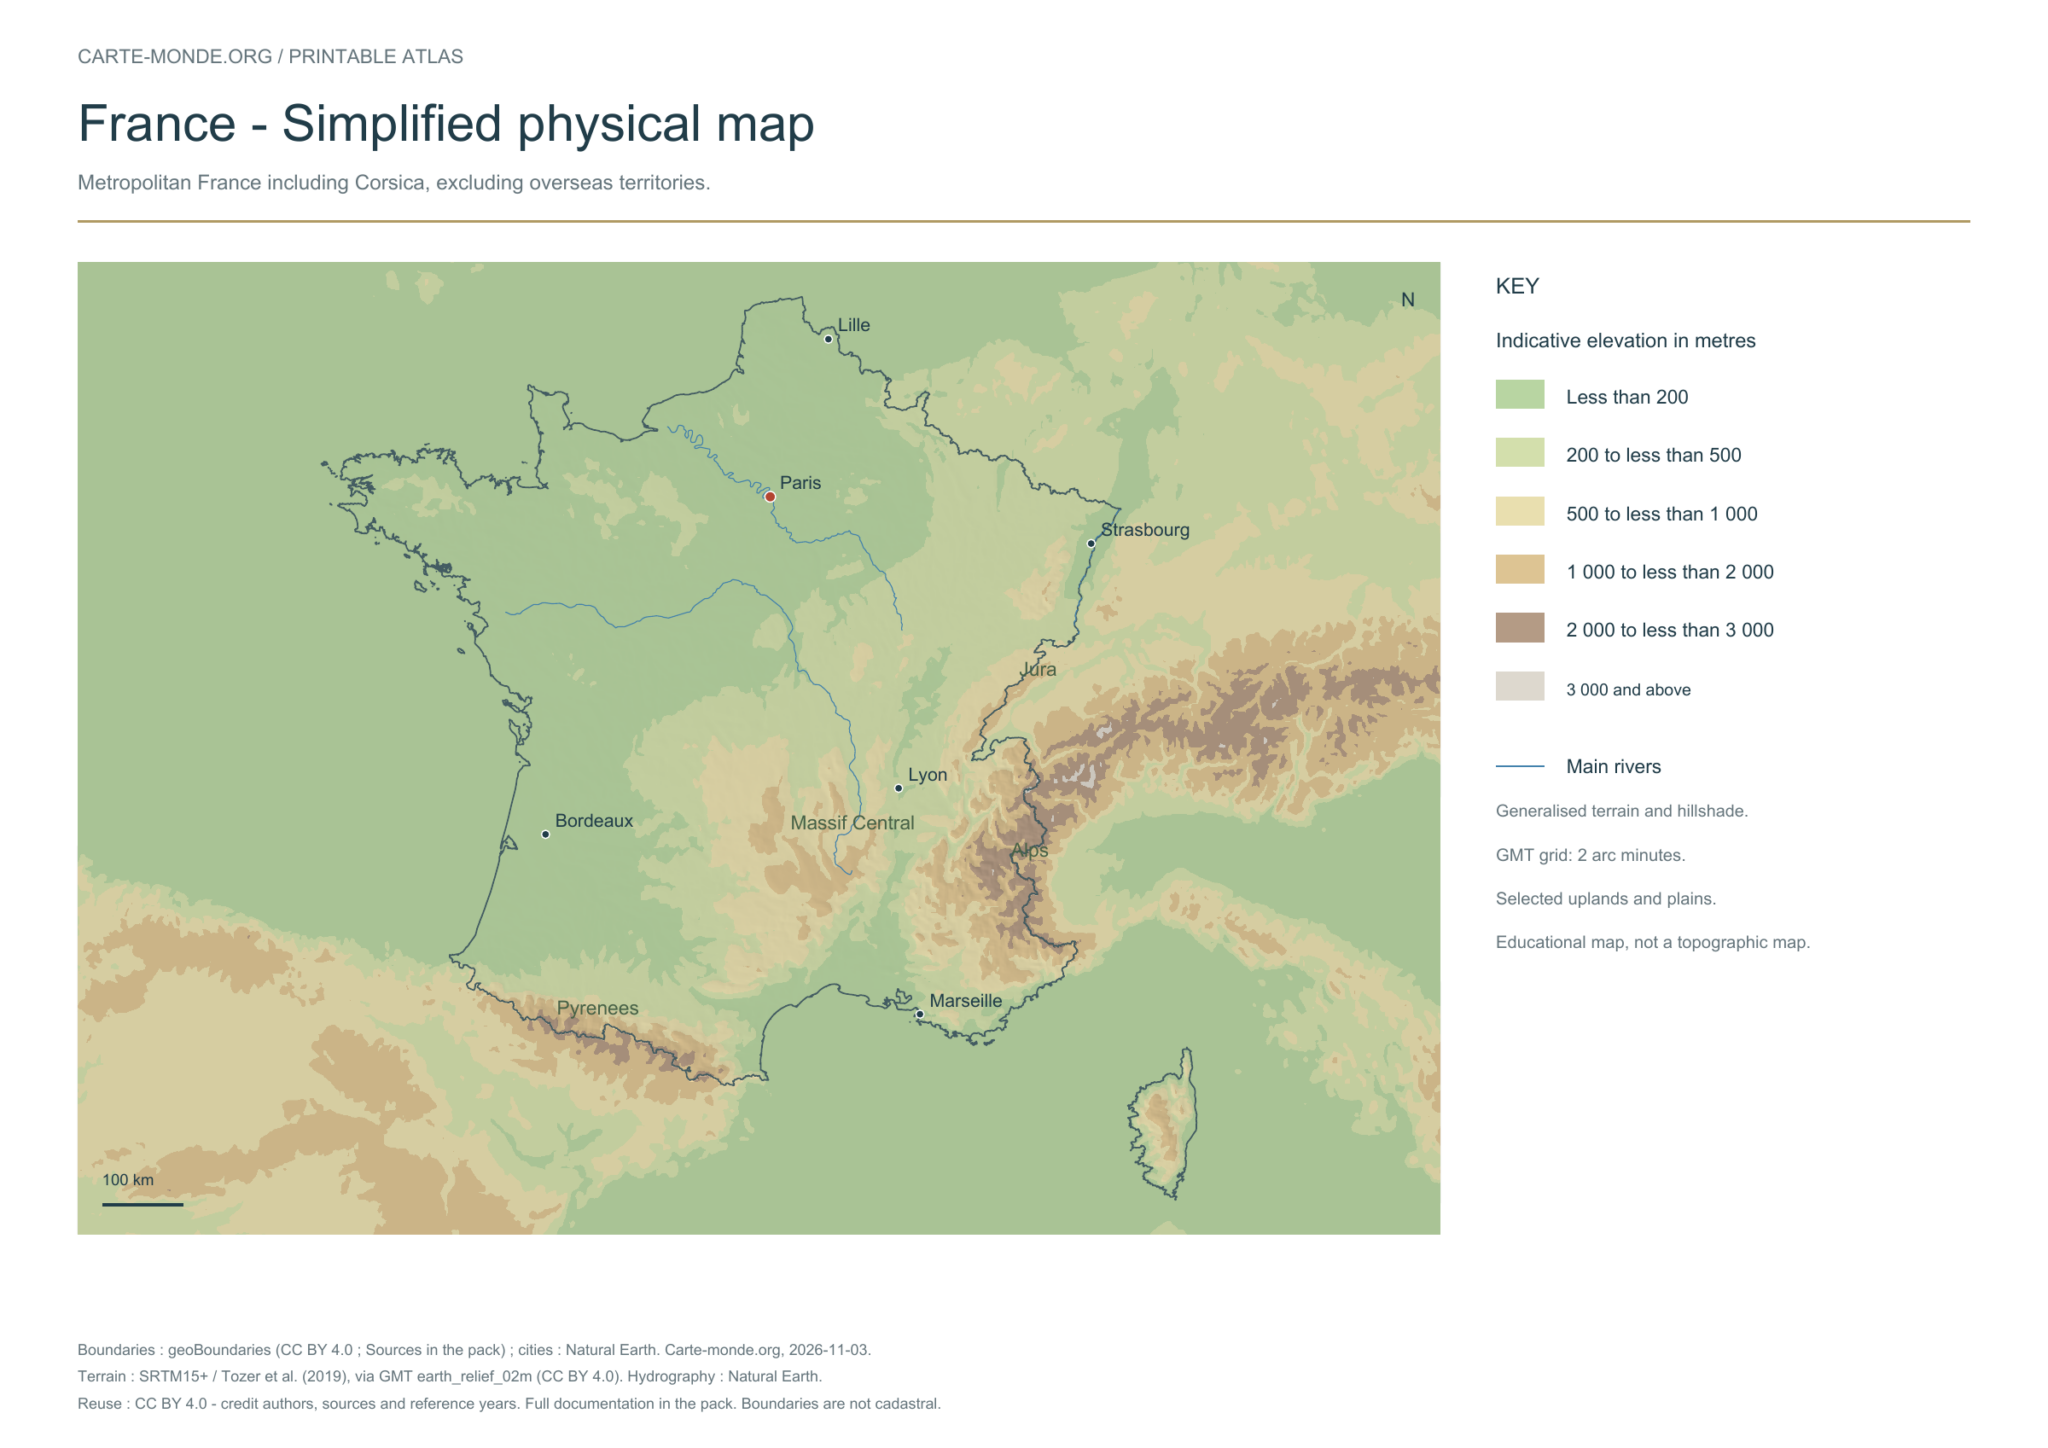
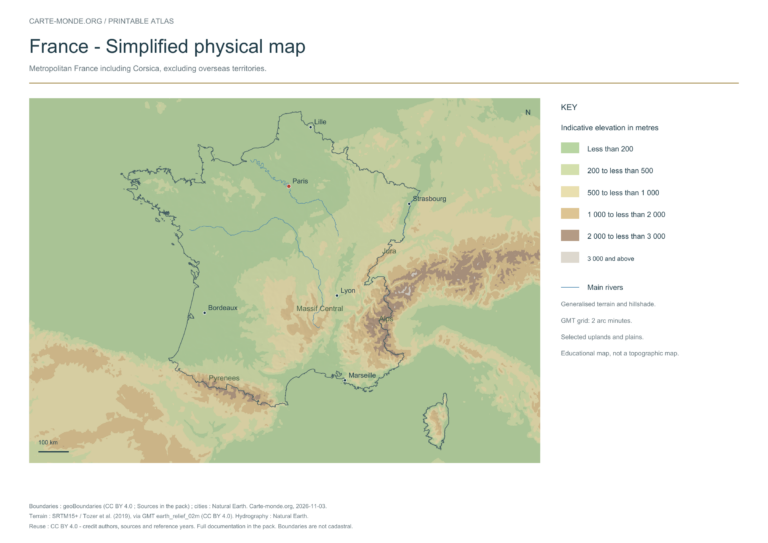
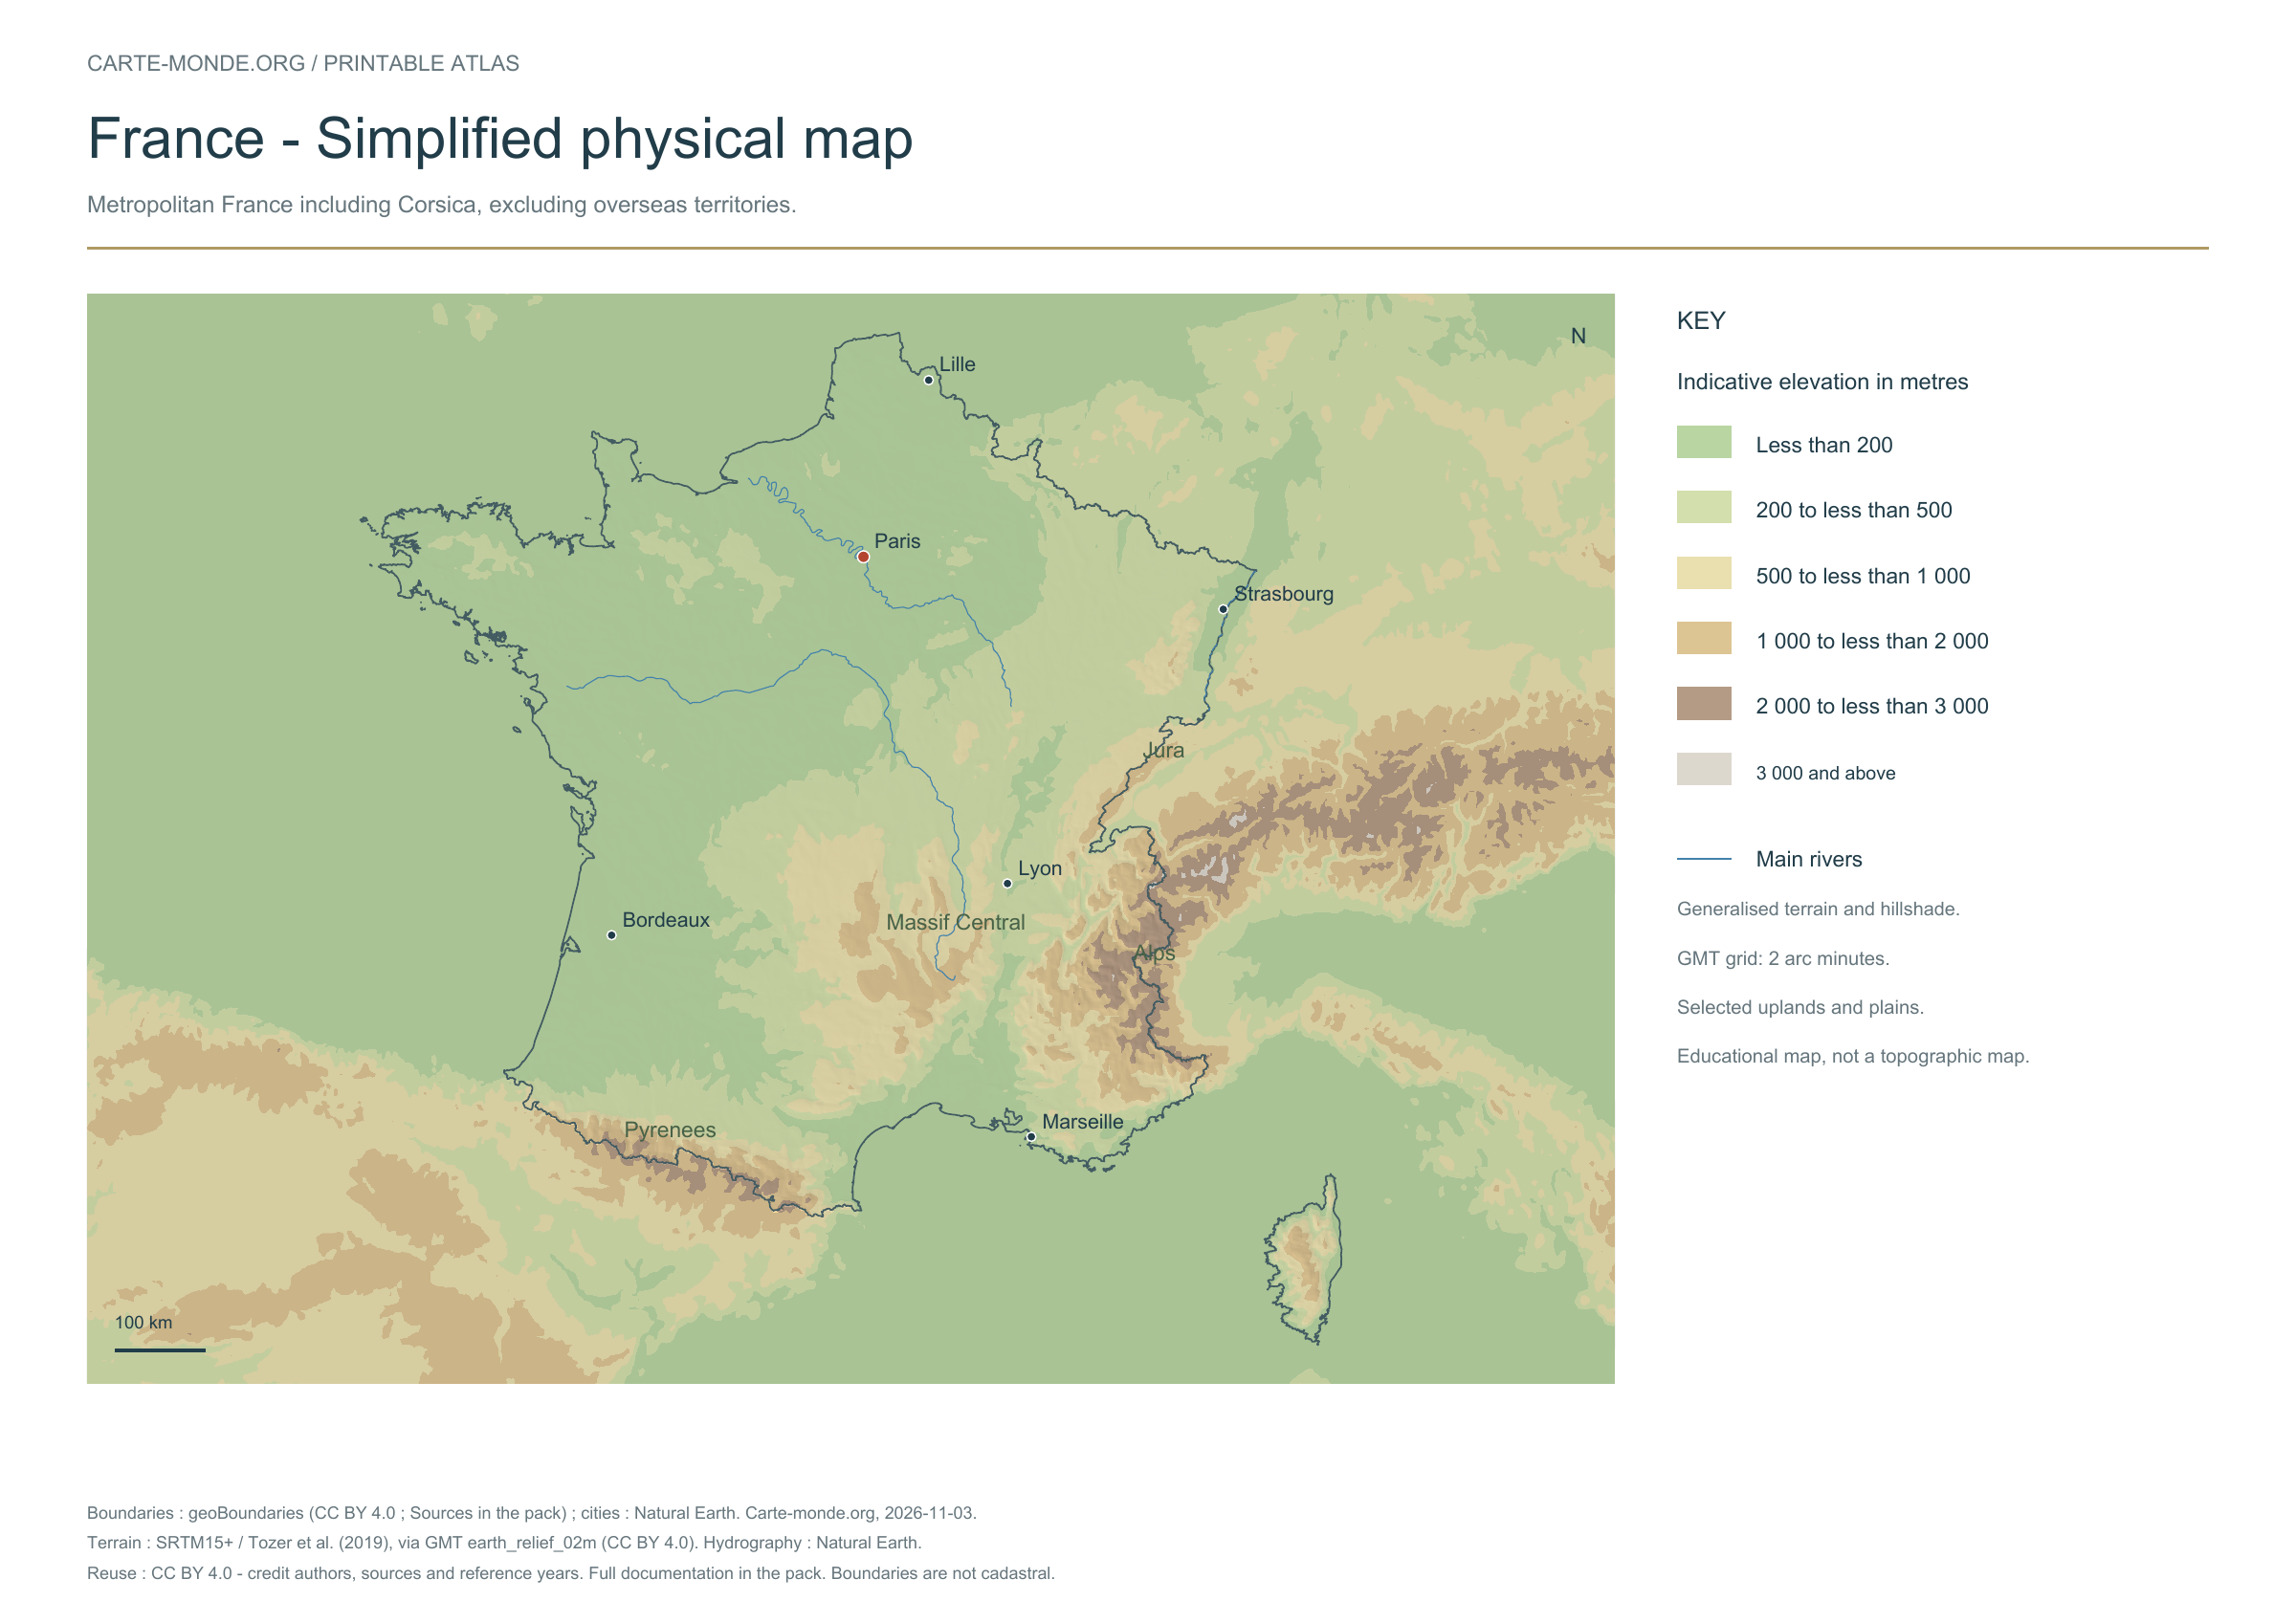
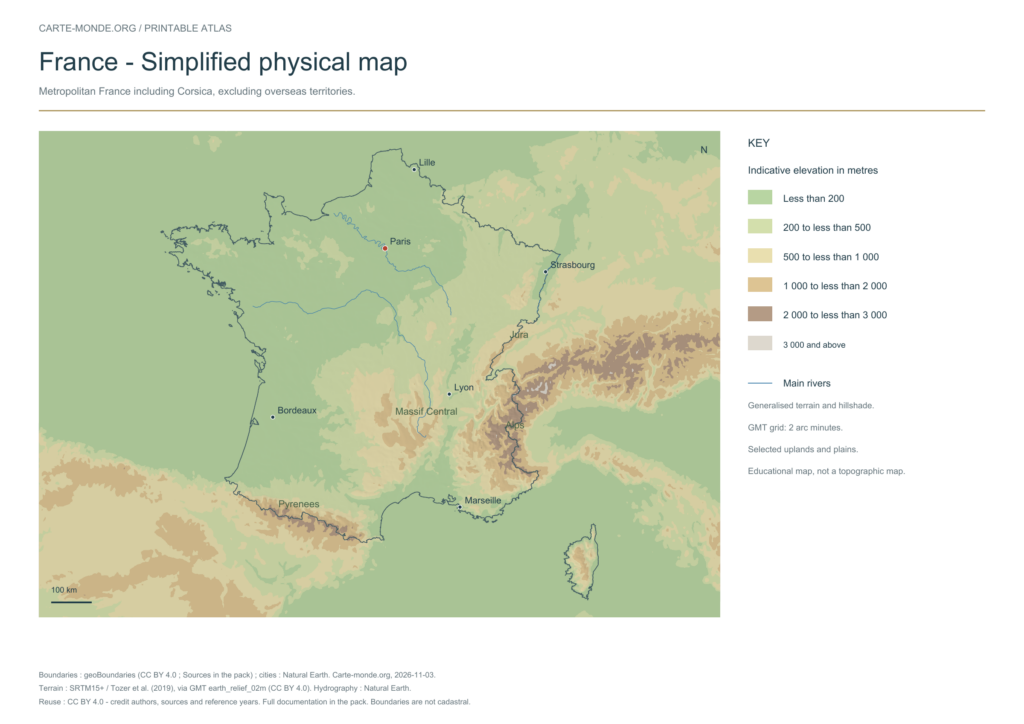
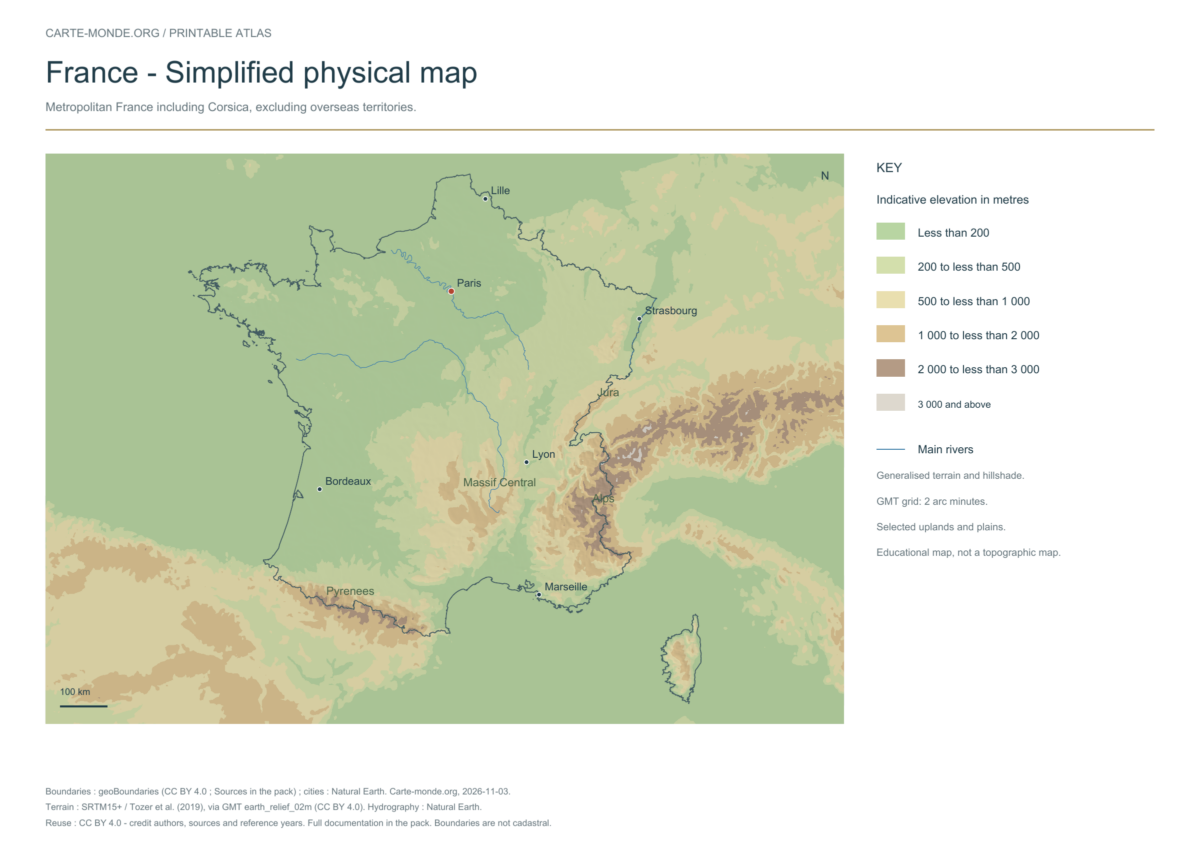
Simplified physical map — metropolitan France

Simplified elevations

Smoothed relief and main natural regions. Metropolitan France, including Corsica; excluding overseas territories.

A4 landscape PDF and PNG · Carte-monde.org, November 2026 · CC BY 4.0.

Download the PDF Open the PNG

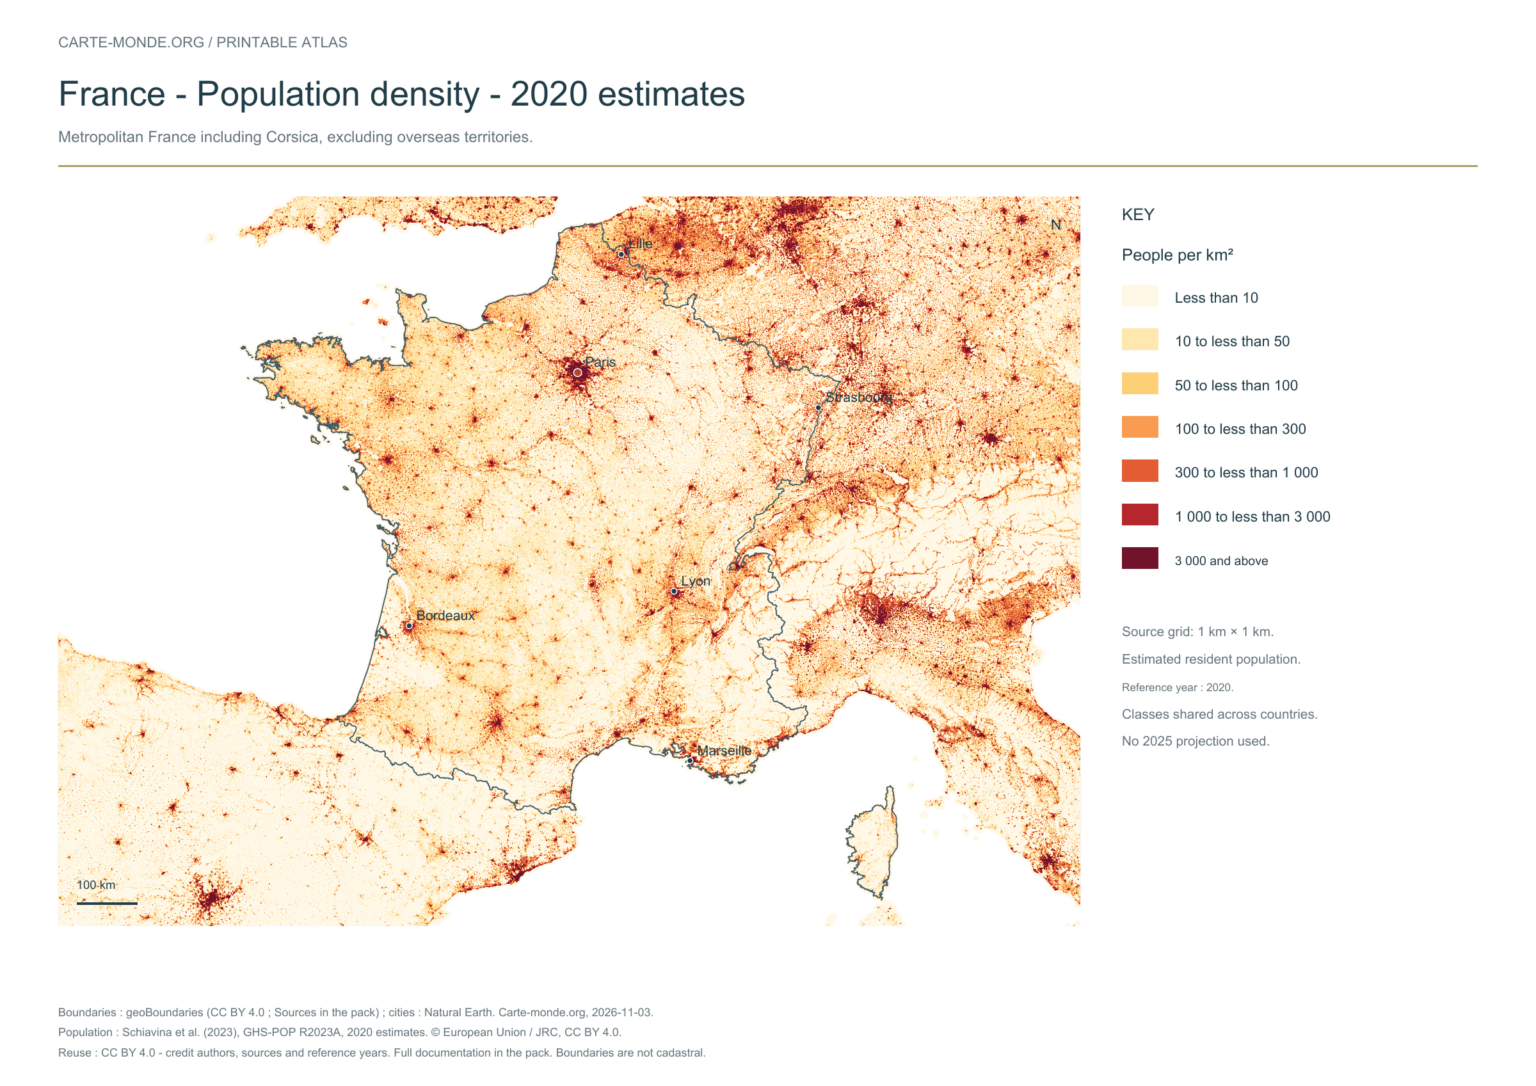
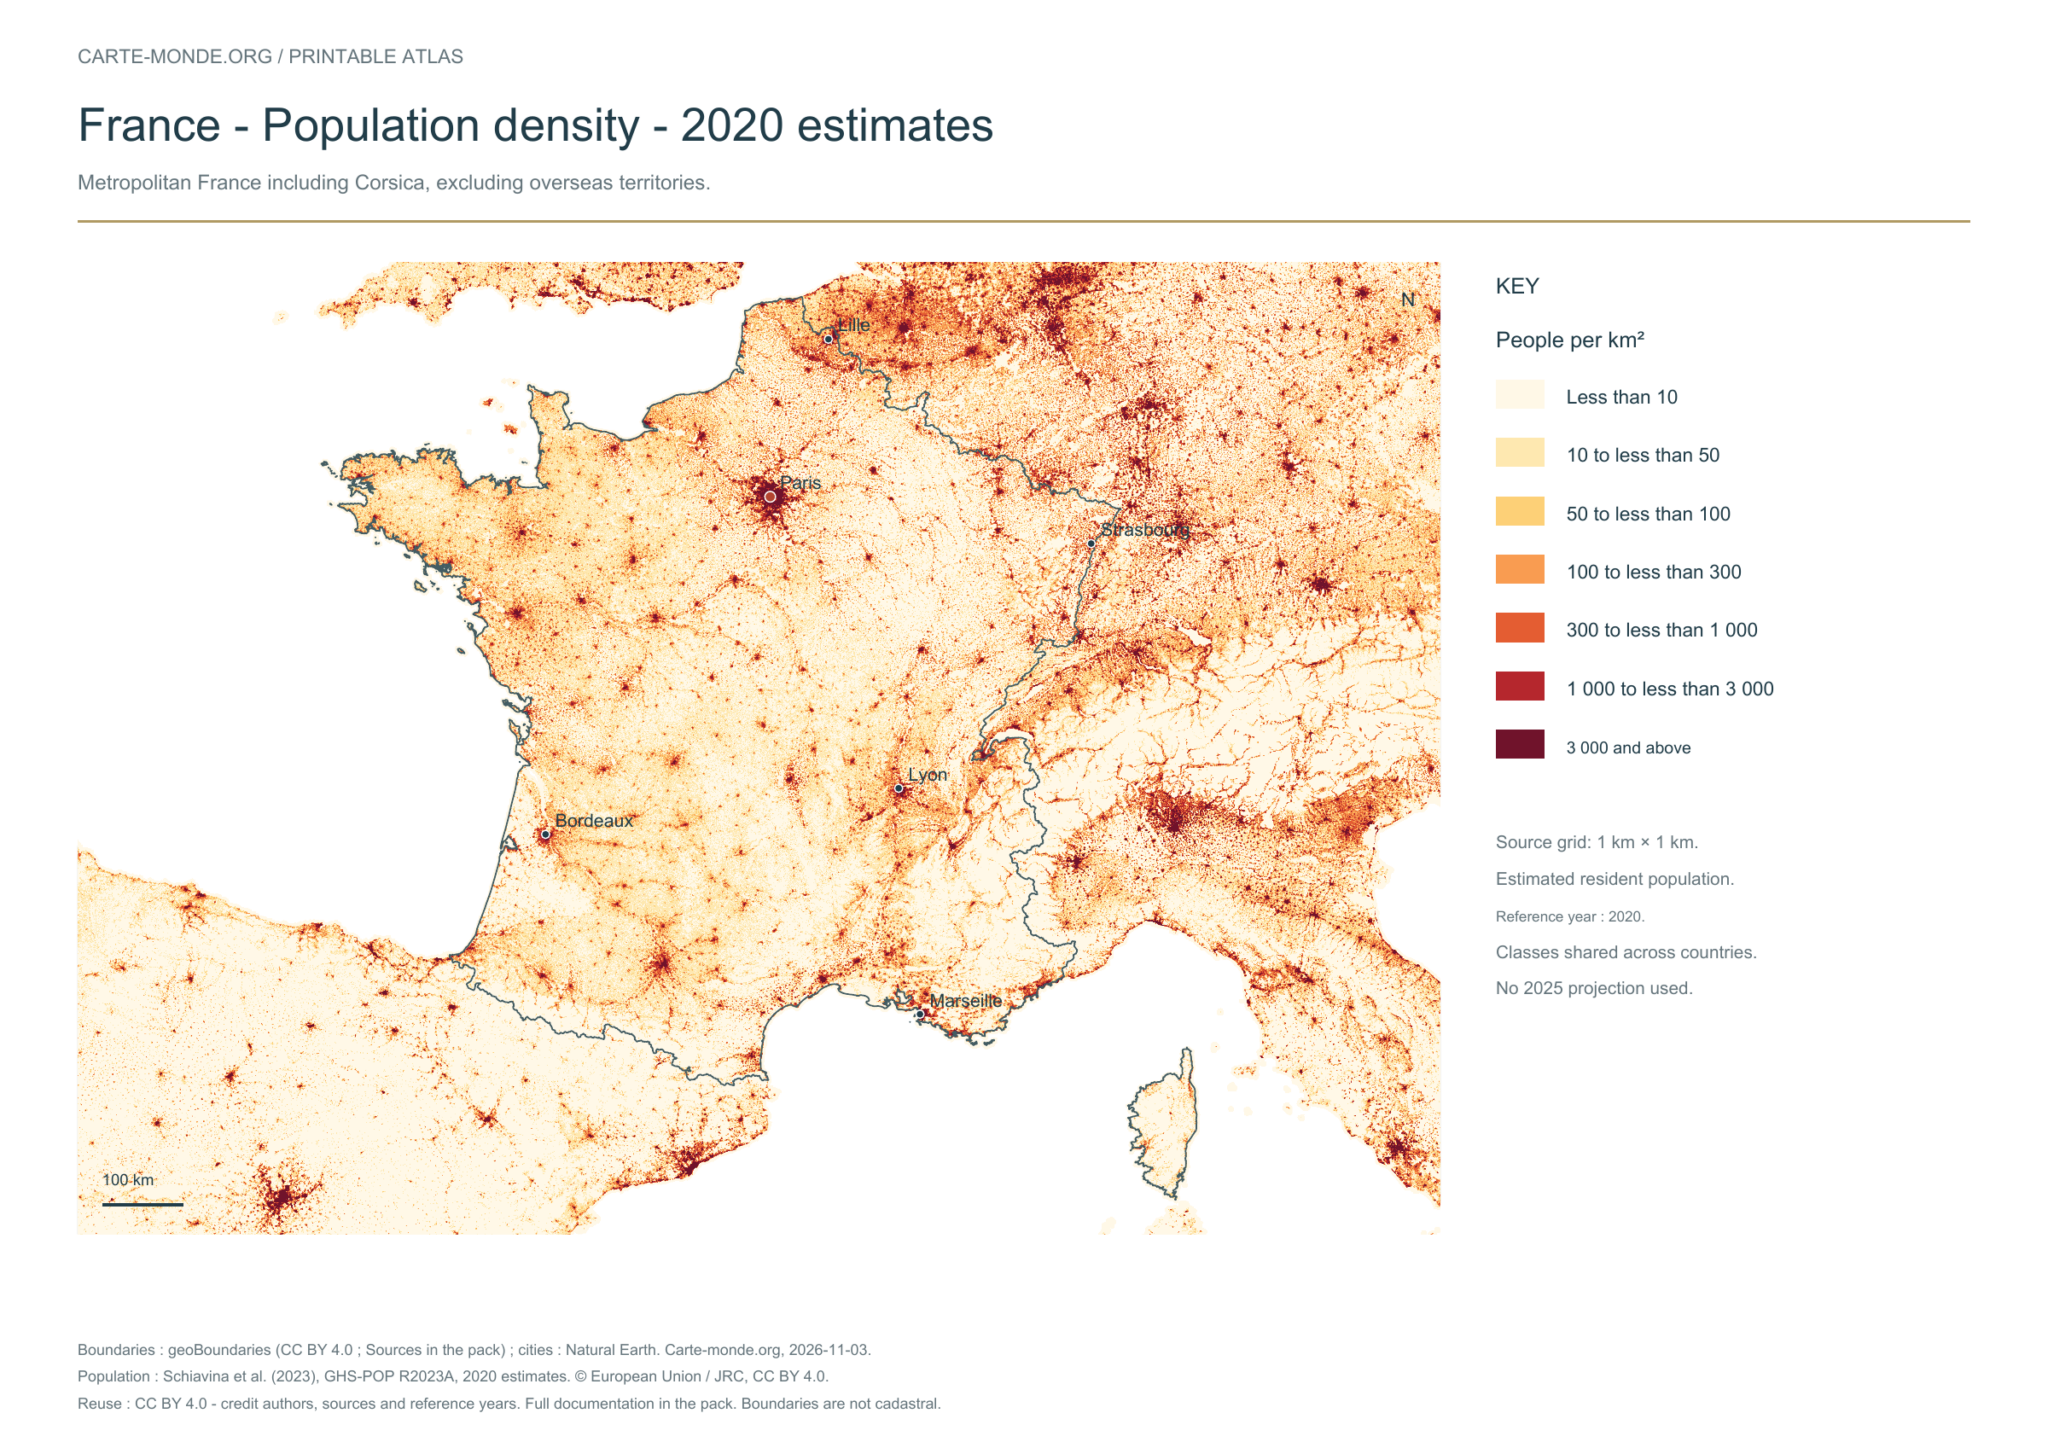
Population density: 2020 estimates

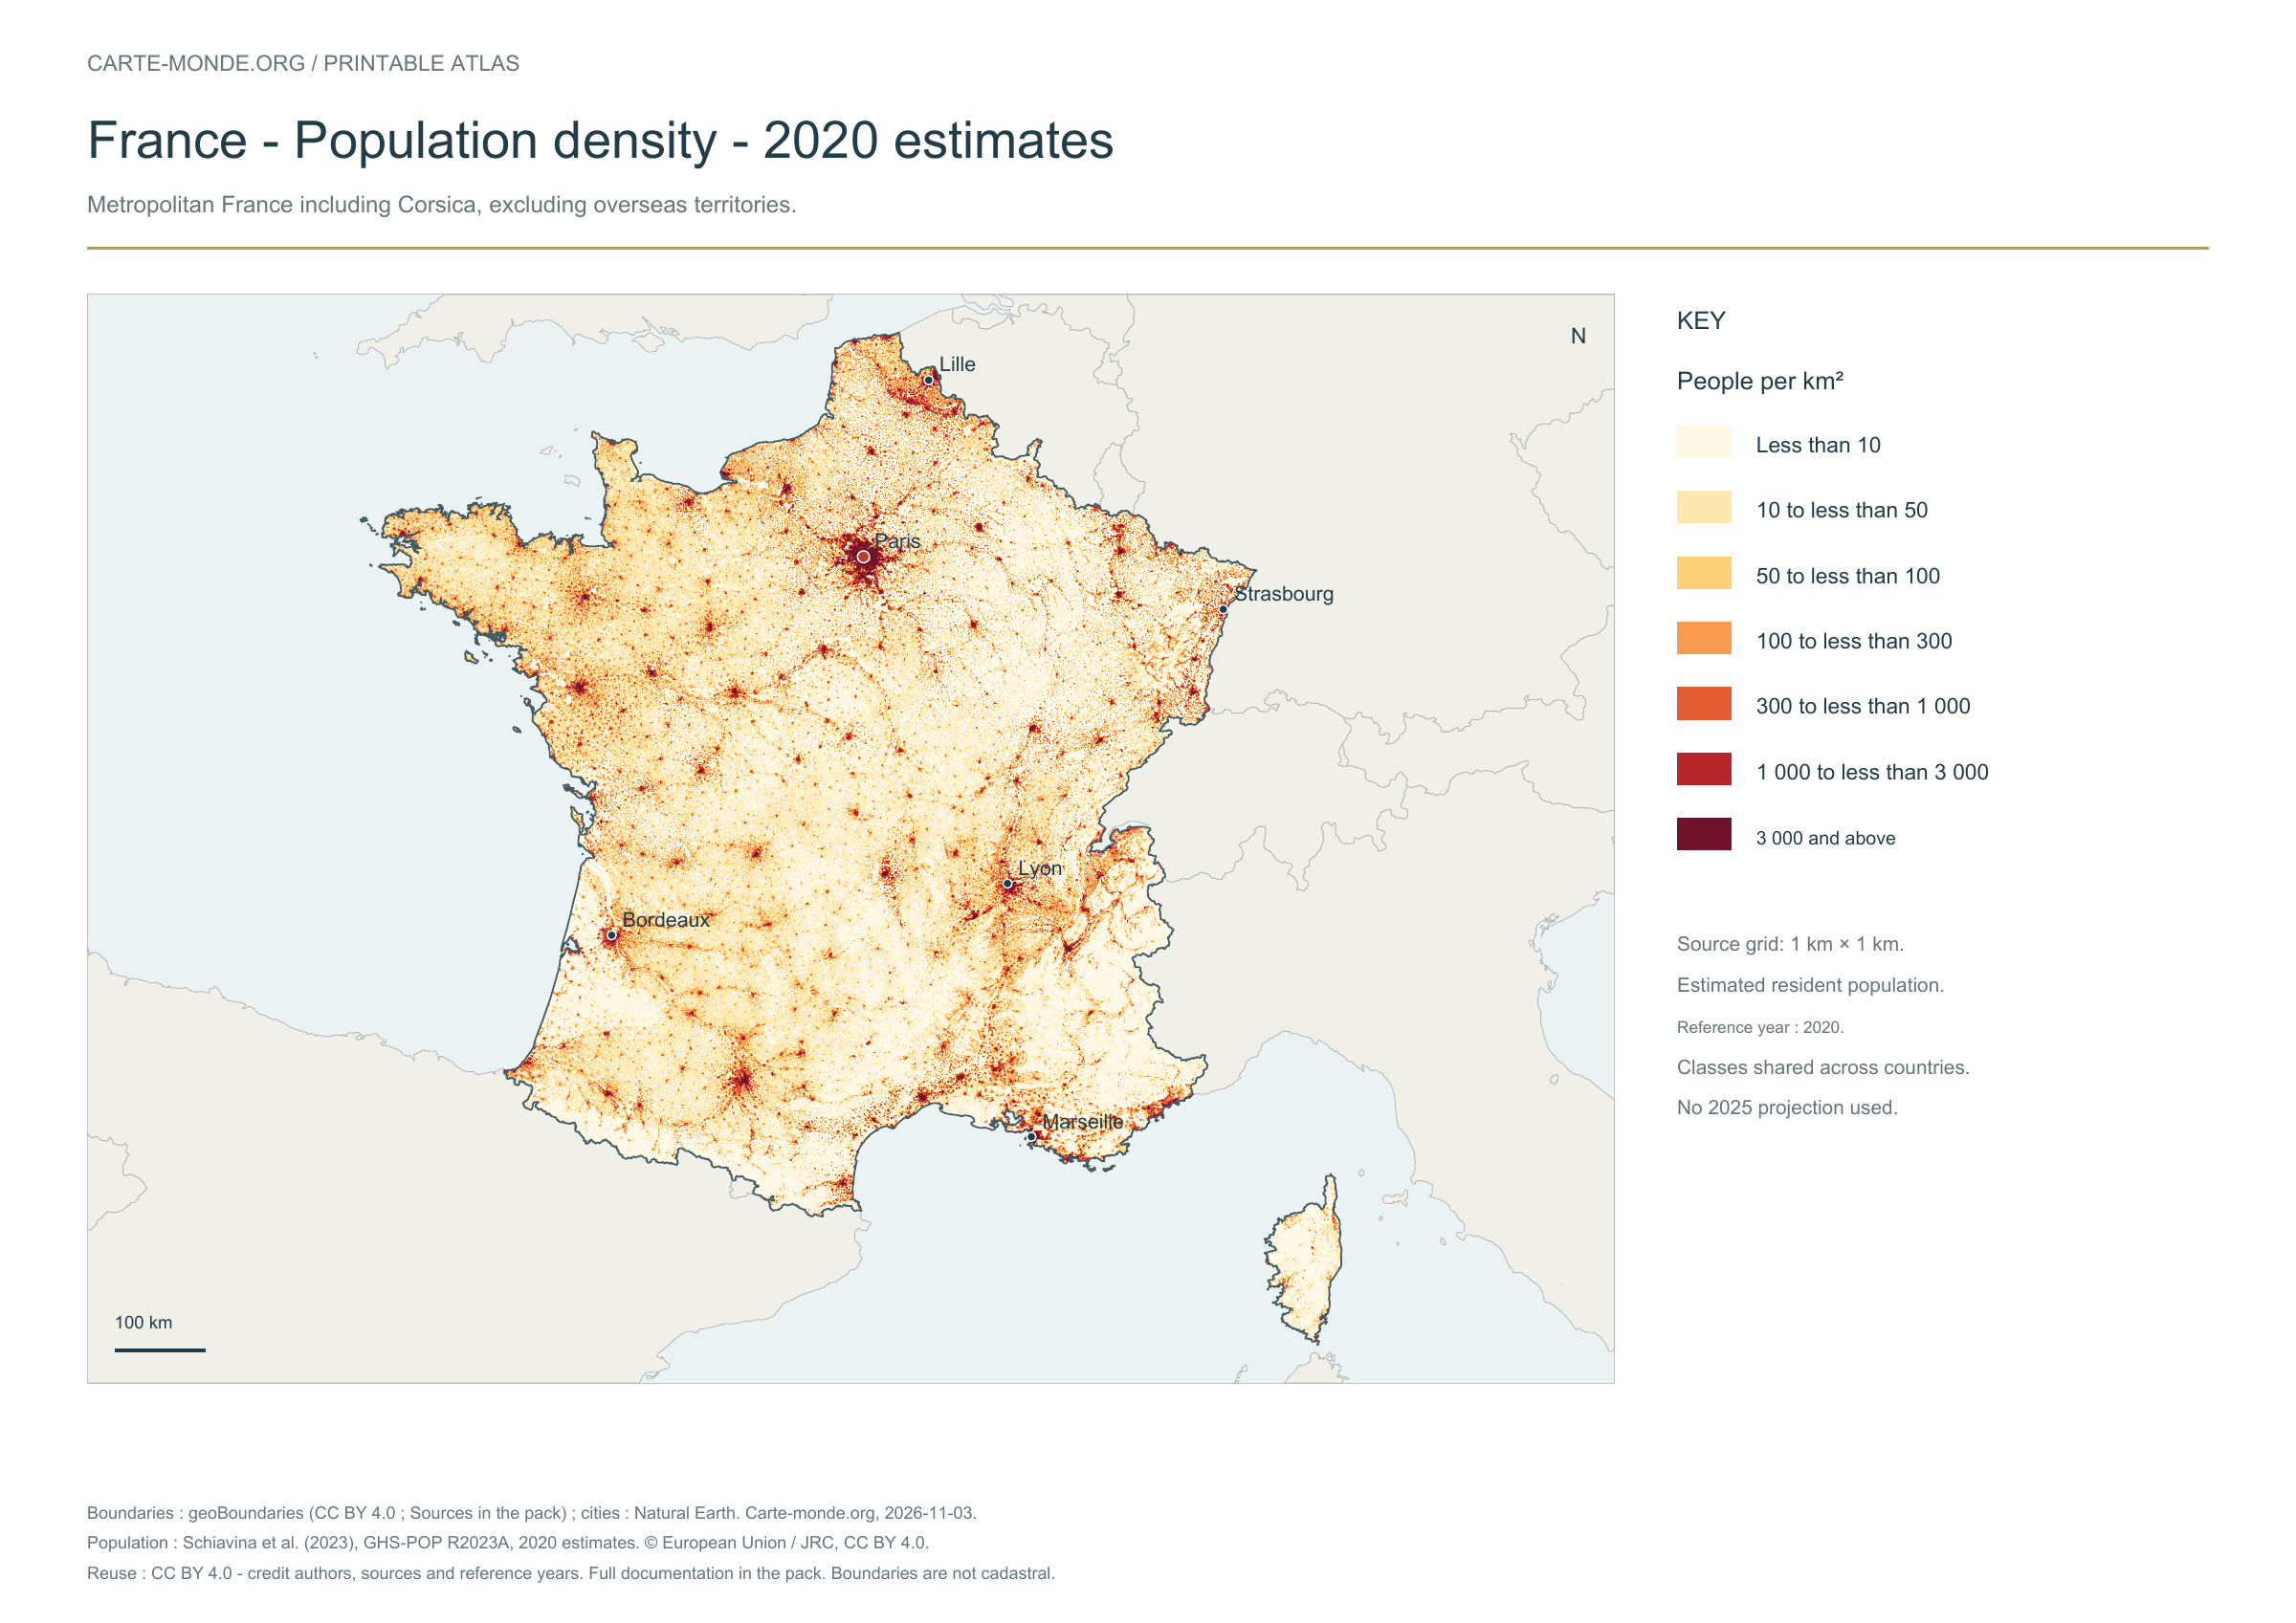
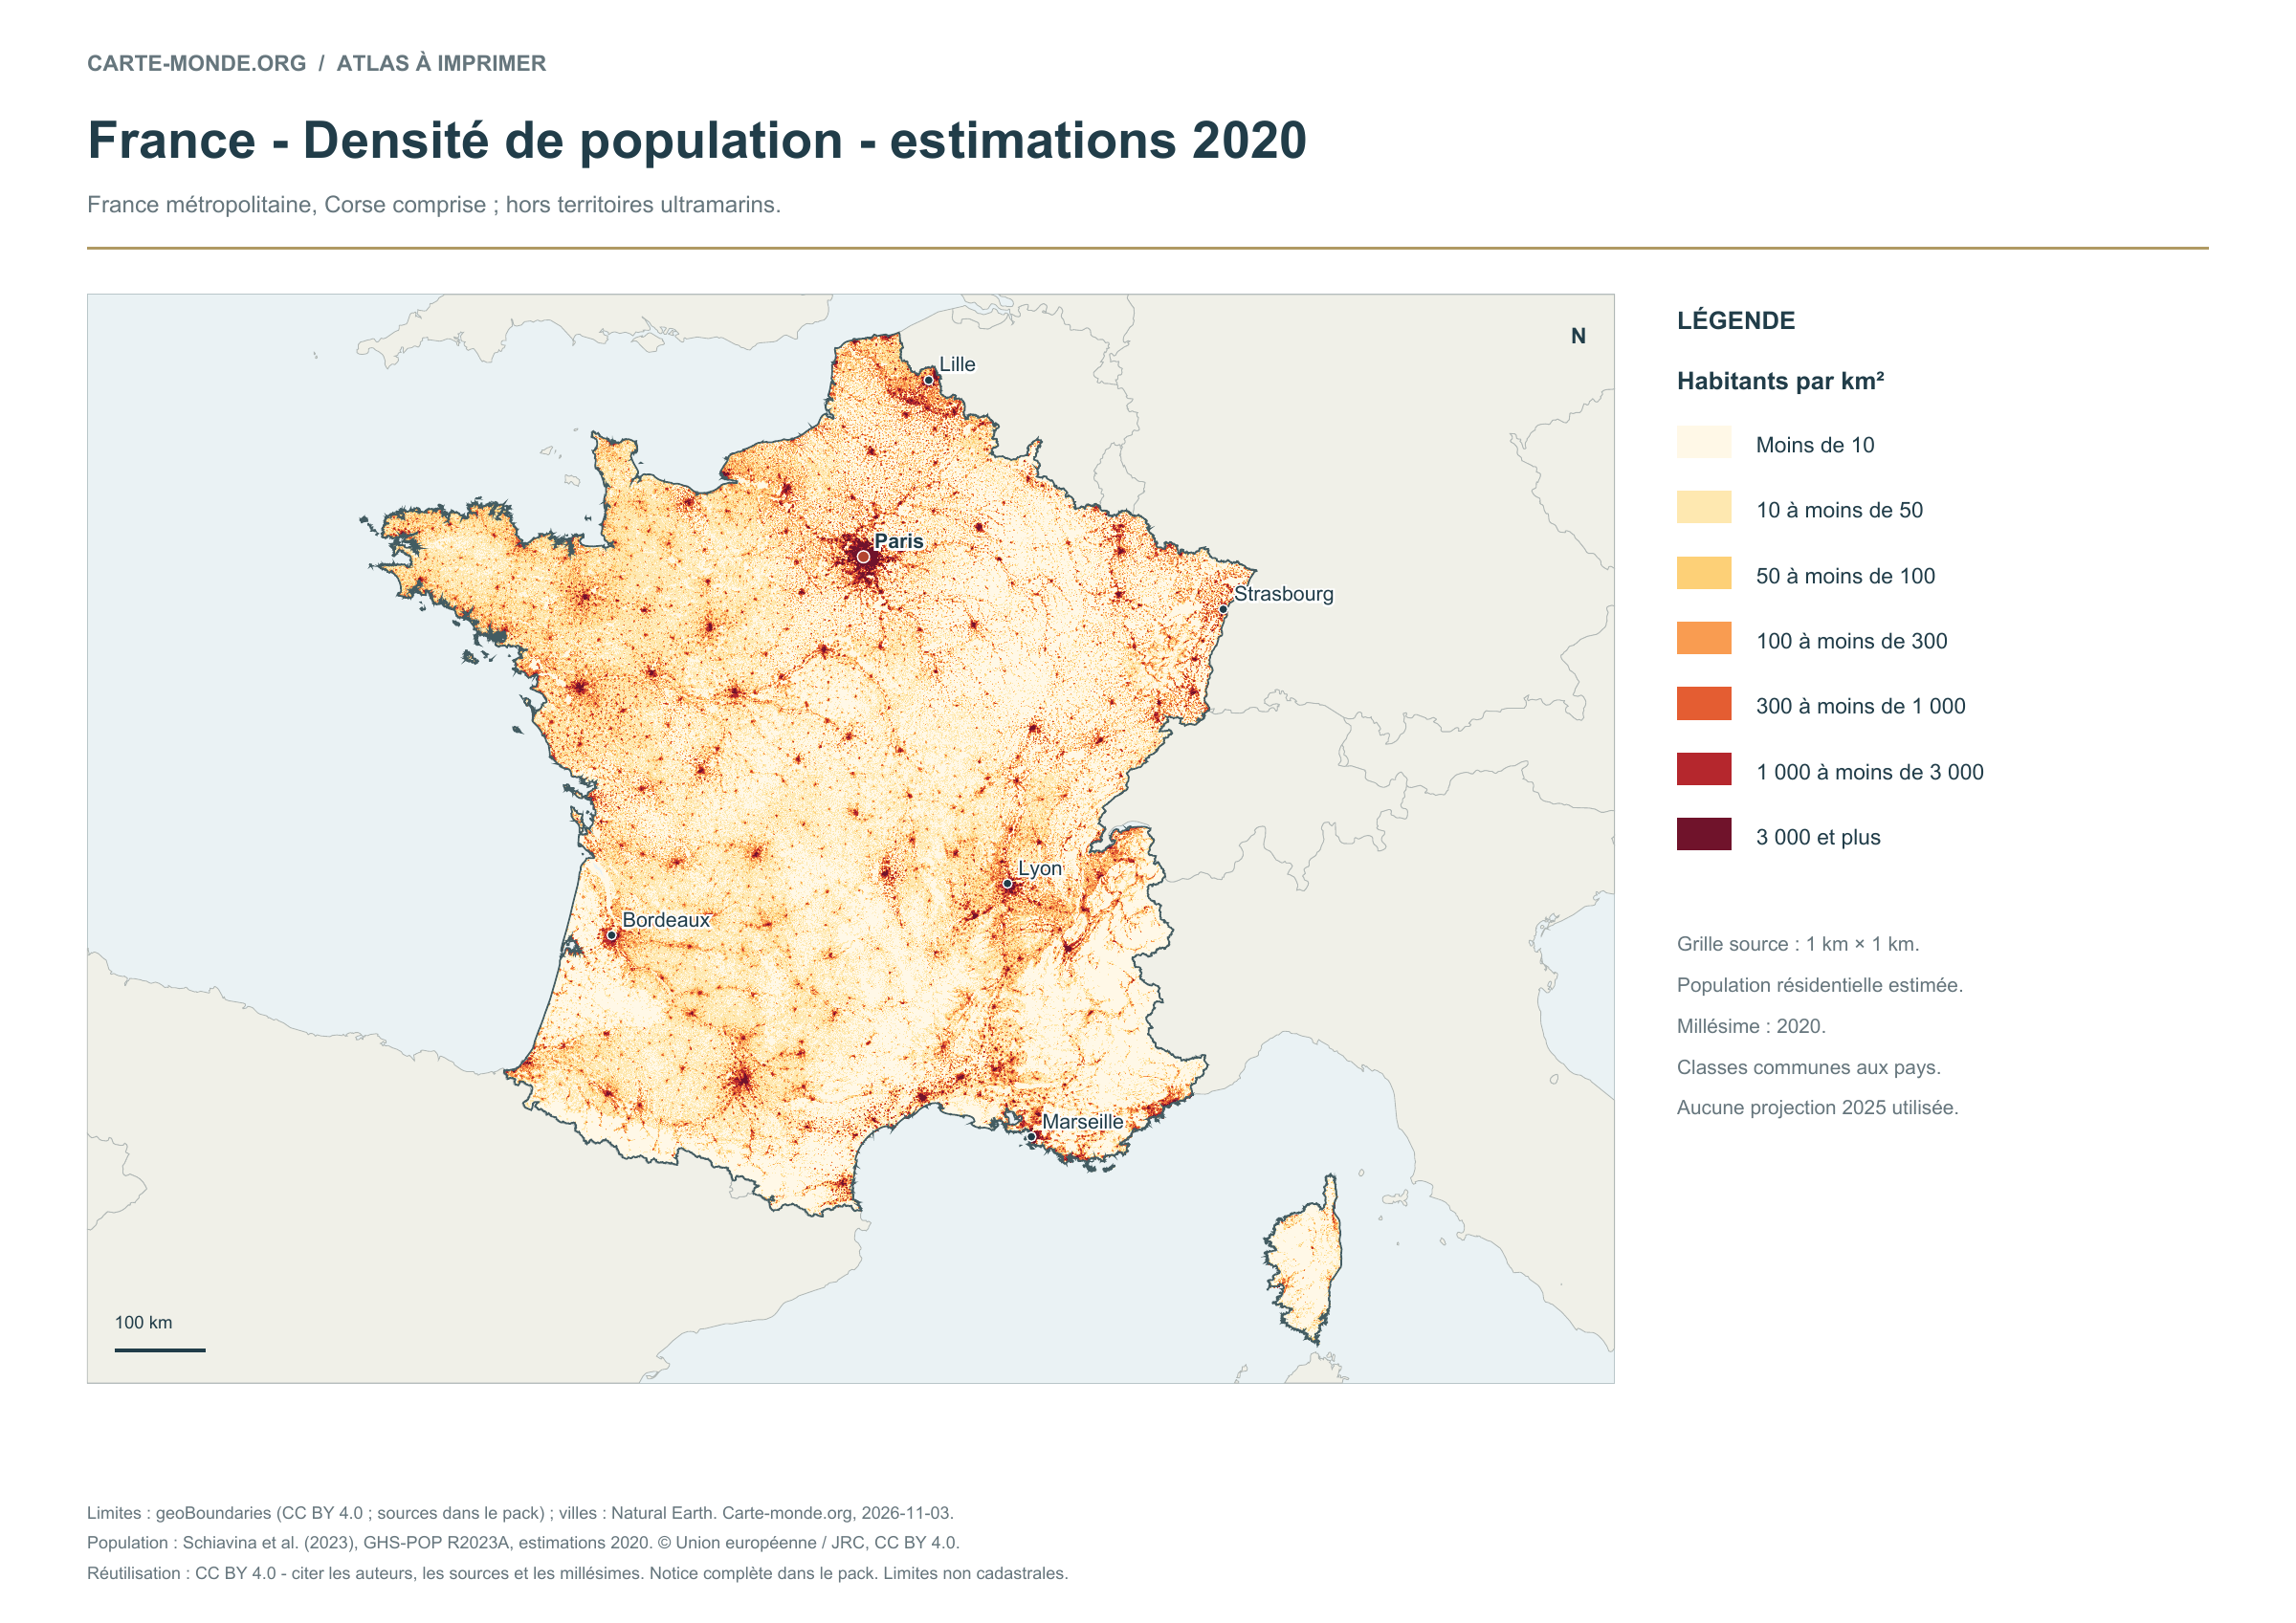
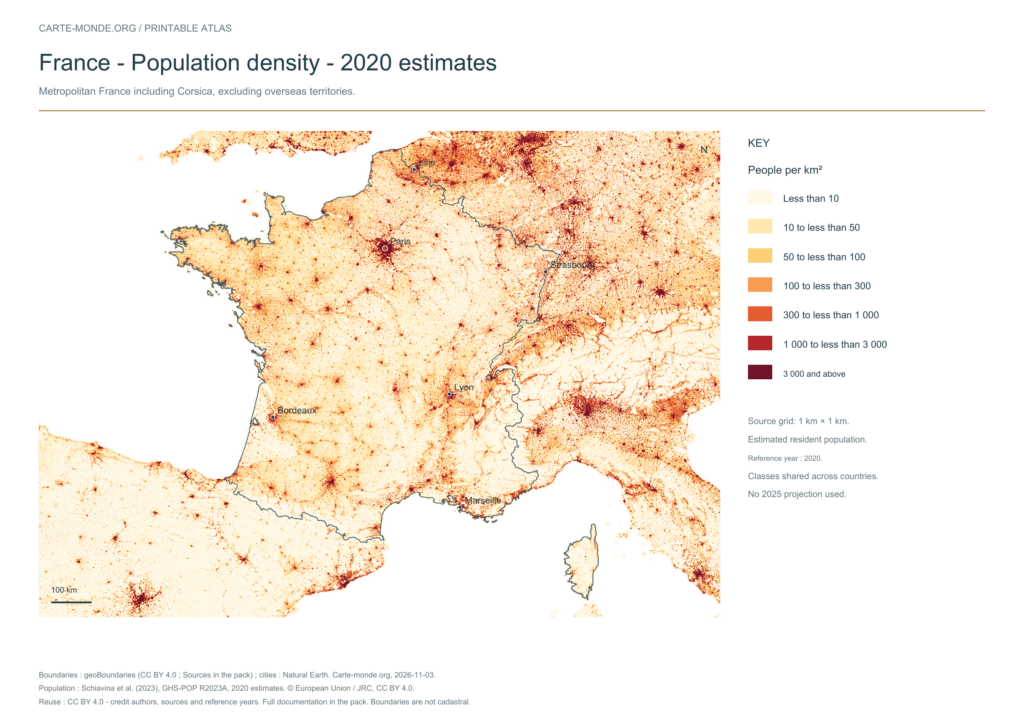
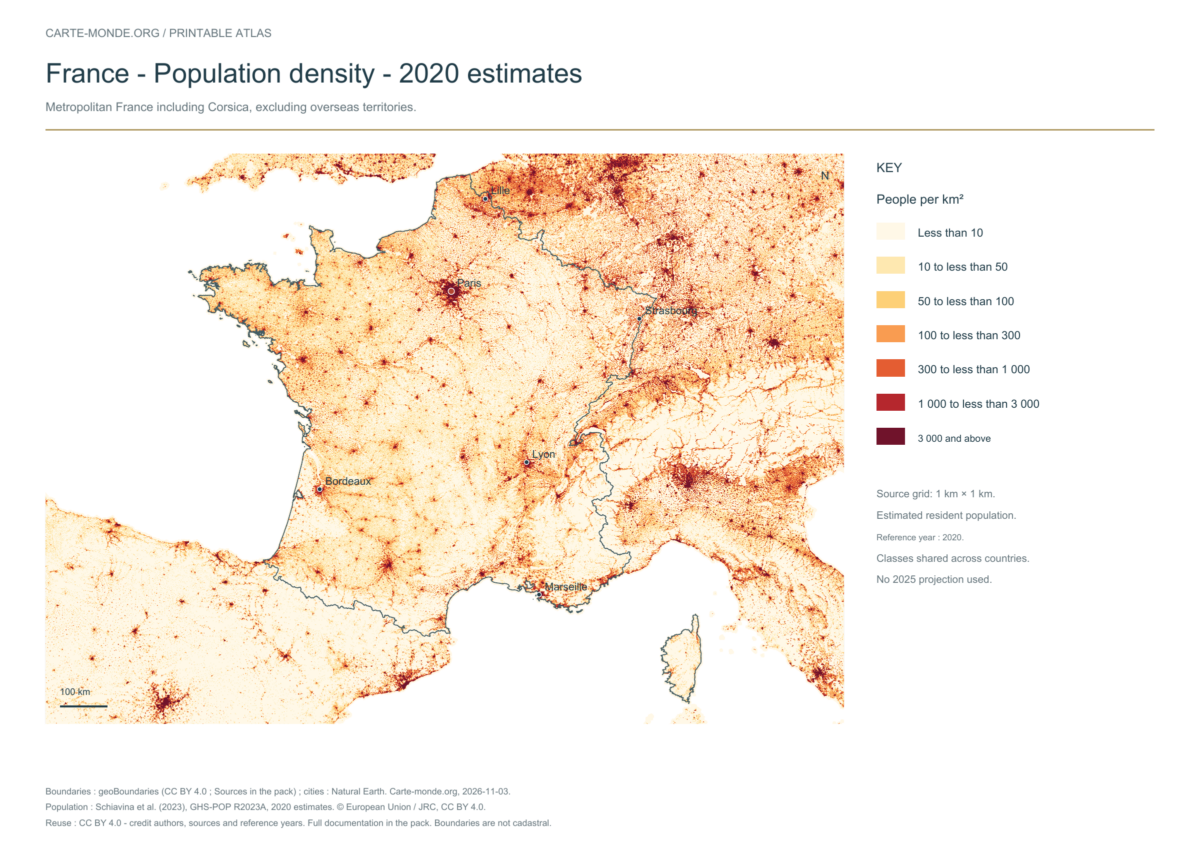
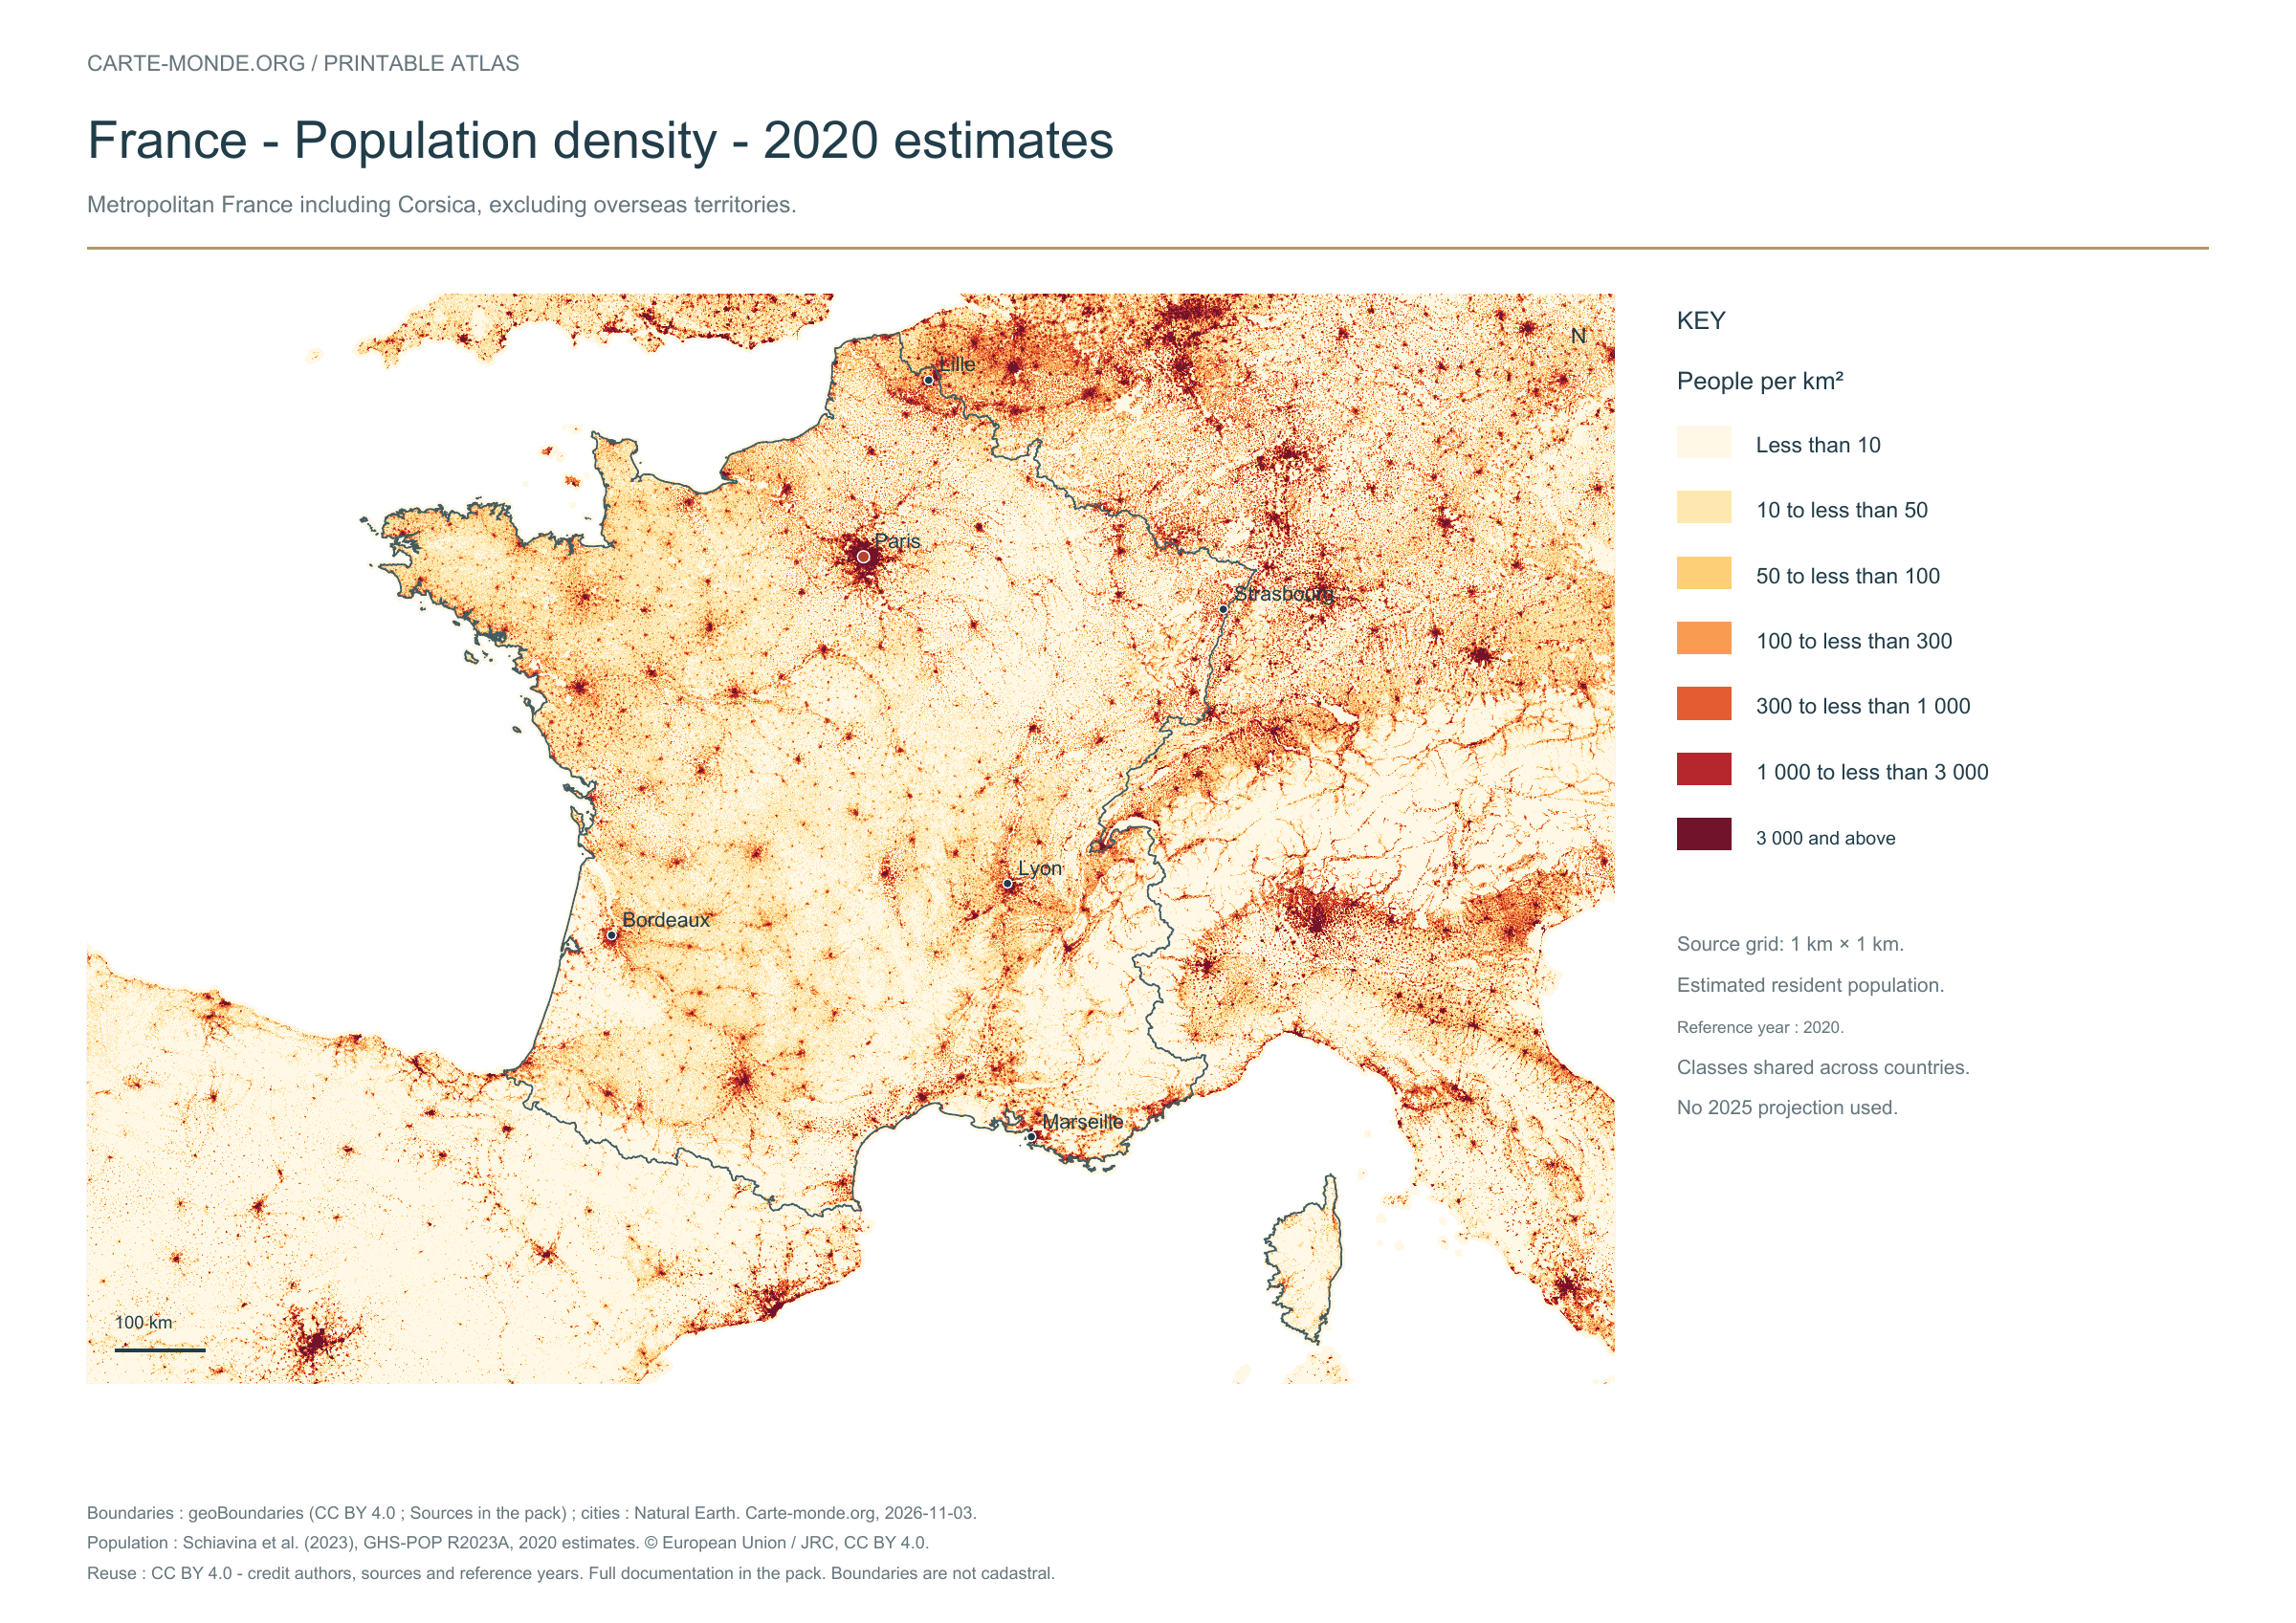
Population density — 2020 estimates — metropolitan France

Population density — 2020 estimates

Estimated residential population in 2020, GHS-POP R2023A, 1 km² grid. Values in inhabitants/km². Metropolitan France, including Corsica; overseas territories excluded.

A4 landscape PDF and PNG · Carte-monde.org, November 2026 · CC BY 4.0.

Download the PDF Open the PNG

The data represents estimated residential population in 2020, on a 1 km² source grid. The document’s creation date does not change this reference year.

The five in-house maps in one pack

Regions and cities, location in Europe, simplified elevations, 2020 population density and shaded relief: five A4 PDFs, their PNGs and SVGs, with sources and licences.

Download the five maps — ZIP

Physical map and population density

The four labelled maps in one pack

Regions, location in Europe, physical features and density, in PDF, PNG and SVG with sources. The first two October maps are reused unchanged under Licence Ouverte 2.0; the two new maps are under CC BY 4.0.

Download the four labelled maps — ZIP

Boundaries: geoBoundaries, credits and conditions in the pack. Surrounding areas, cities and hydrography: Natural Earth 5.1.1, public domain. Relief: SRTM15+V2.7 via GMT earth_relief_02m, CC BY 4.0. Population: GHS-POP R2023A, 2020 estimates, © European Union/JRC, CC BY 4.0. Retain attribution and dates. The grids are suitable for national overviews, without topographic precision.

Previous edition packs

Original pack: blank base maps and labelled maps

Outlines, boundaries, administrative map and location in Europe: each map is provided in PDF, PNG and editable SVG. The ZIP also includes notes with sources and the license.

Download the France pack — ZIP

Which map should I choose?

Use the administrative map to identify the regions. The location map places the country in its European surroundings. For an exercise without answers, open the blank maps on the companion page.

View the base maps of France.

Additional maps: regions, relief and general map

Three existing IGN maps, reproduced without redrawing, with attribution and a licence link. Their date is 2016 : the poster shows current regional divisions, but these files are not 2026 editions.
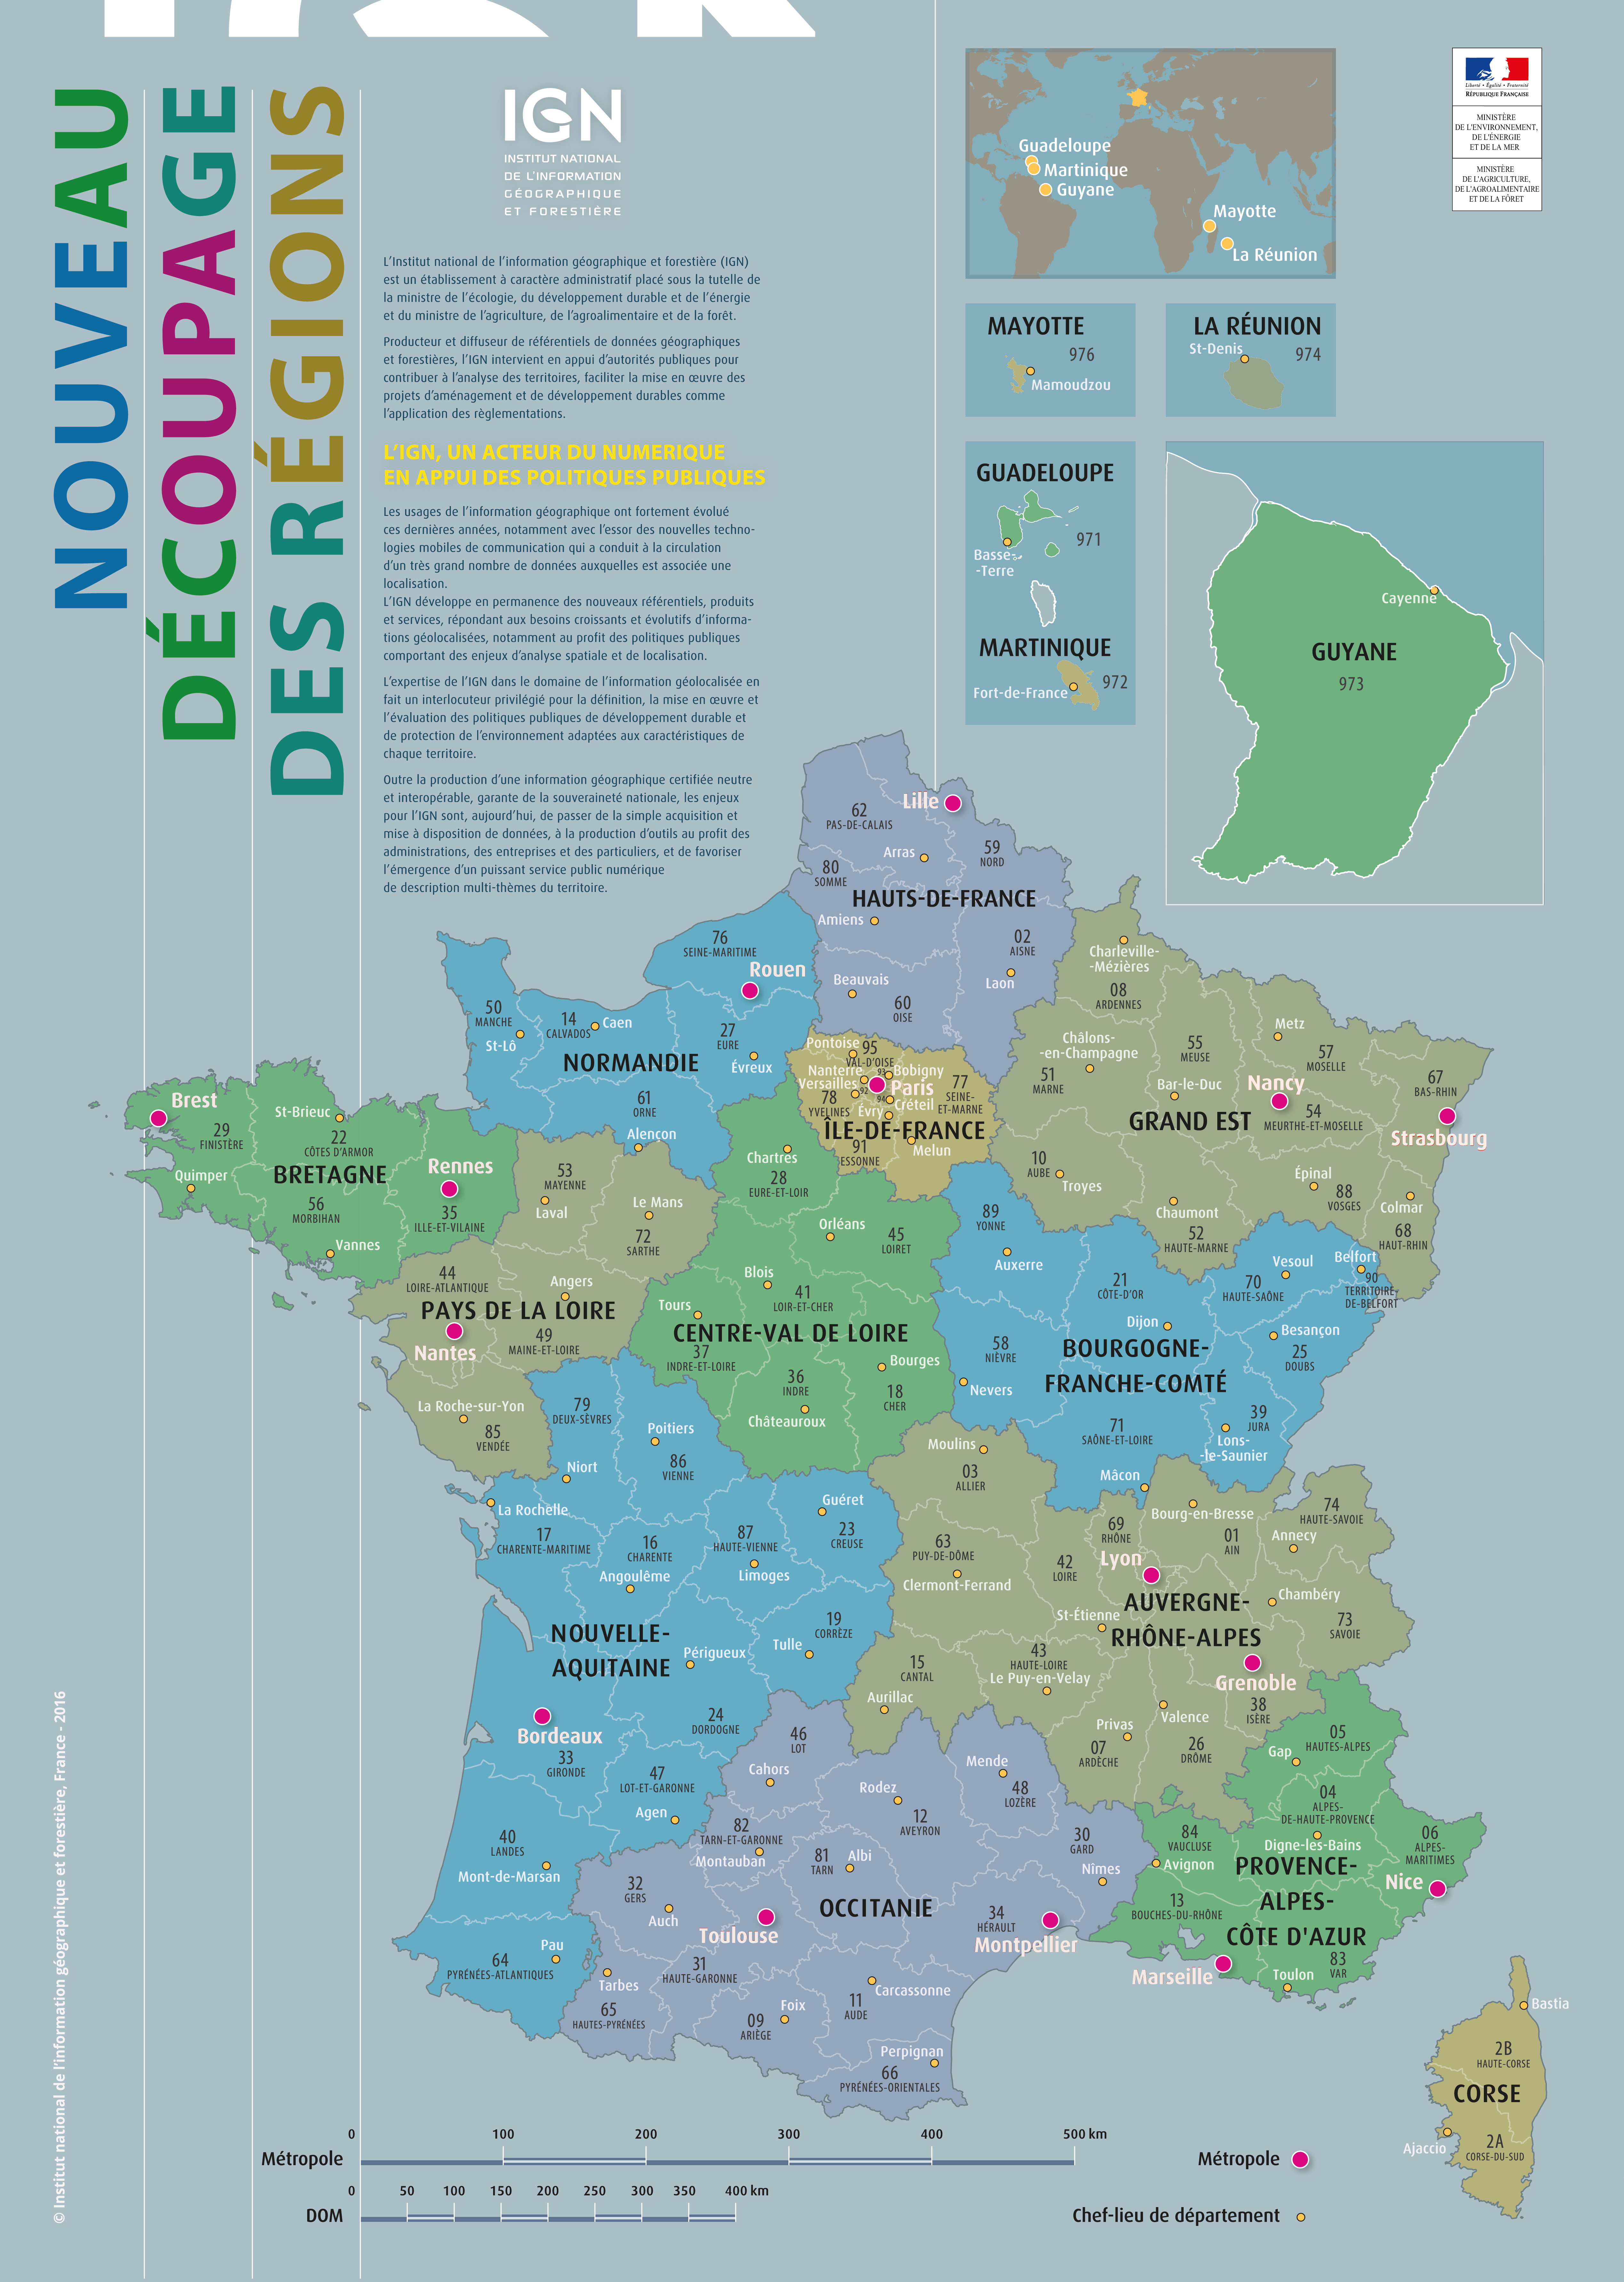
Regions and departments of France - IGN map, 2016 edition

Existing map · IGN 2016

Regions and departments of France

Poster showing regions according to the current divisions, numbered departments and main cities, with overseas departments and regions (DROM) in insets. Grand Est, Hauts-de-France, Nouvelle-Aquitaine and Occitanie are named.

IGN 2016 – Licence Ouverte · Source and reuse terms
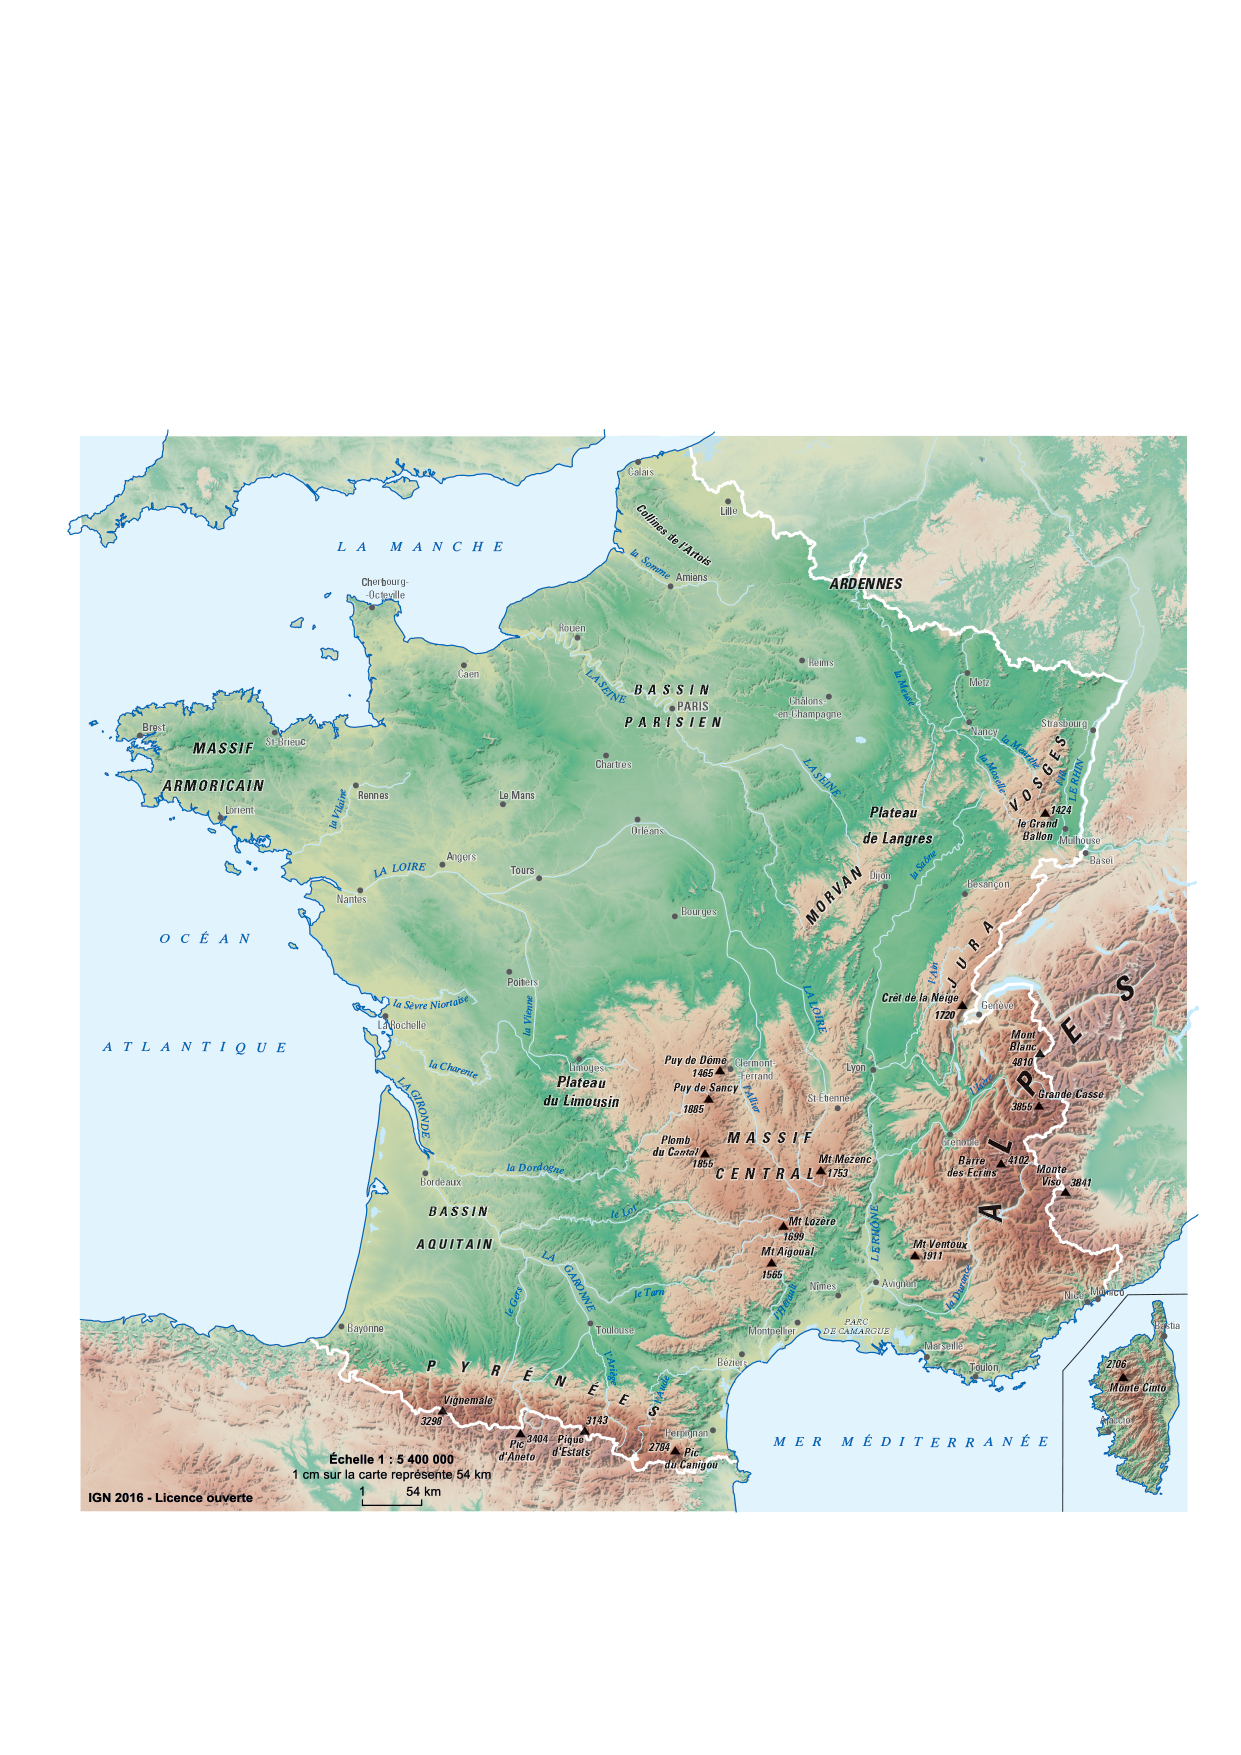
Relief of France - IGN map, 2016 edition

Existing map · IGN 2016

Relief of France

Physical map of France, covering metropolitan France with Corsica in an inset: mountains, basins, rivers and main cities. A document ready to download, without redrawing.

IGN 2016 – Licence Ouverte · Source and reuse terms
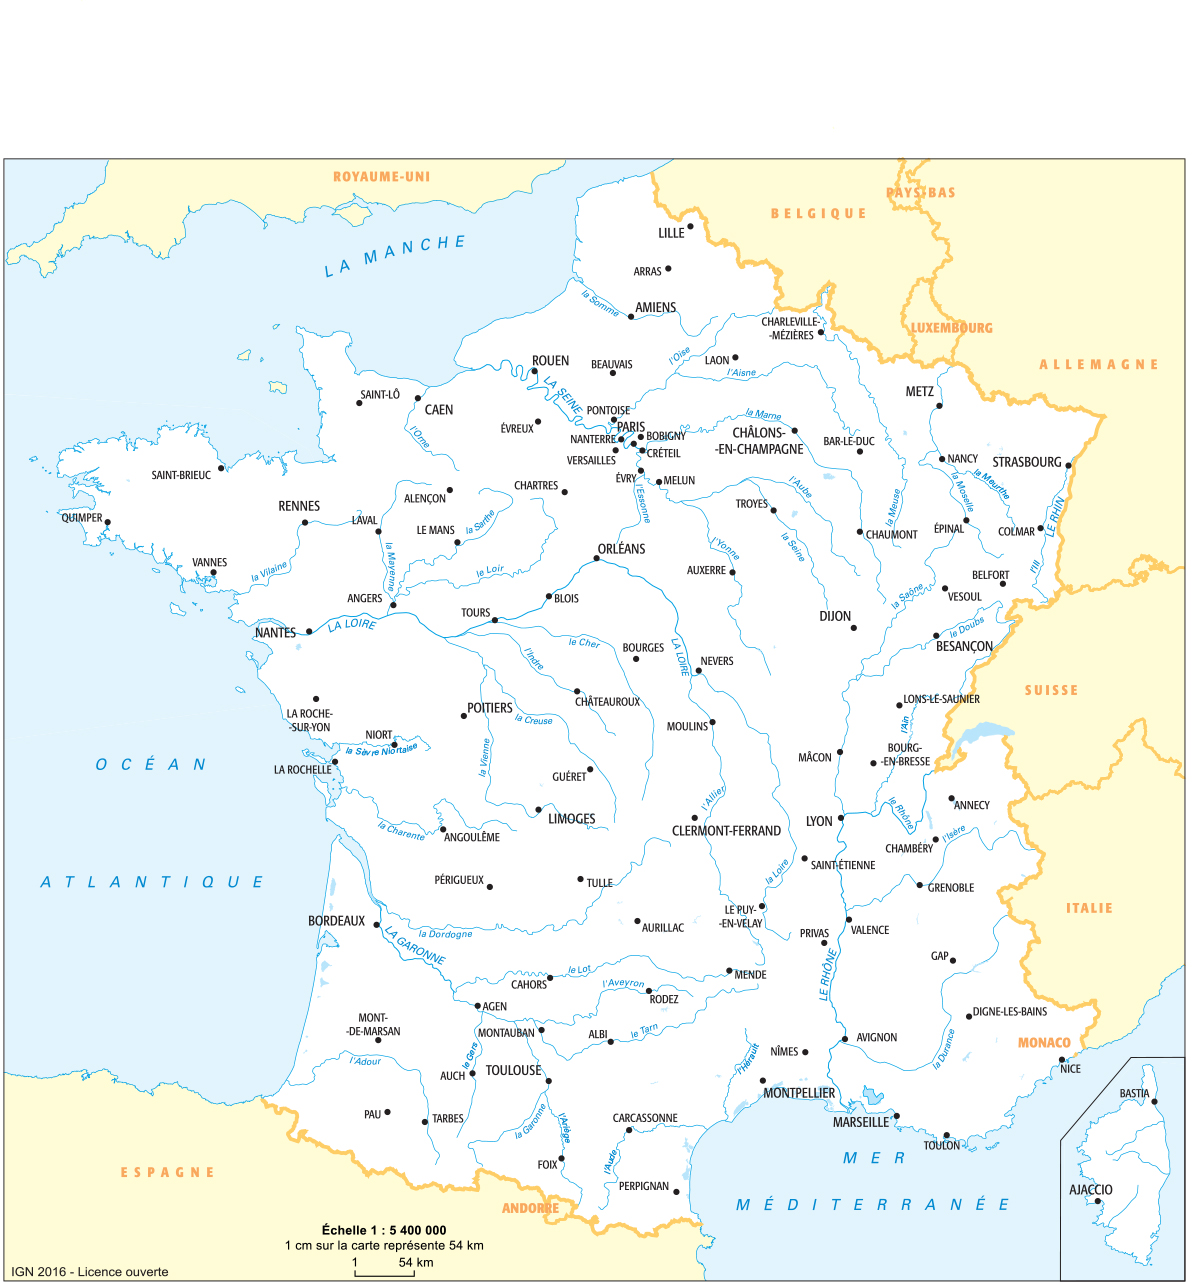
General map of France: cities and rivers - IGN map, 2016 edition

Existing map · IGN 2016

General map of France: cities and rivers

Main rivers, prefectures and neighboring countries to find your bearings in France, in its metropolitan area. This selection focuses on cities and hydrography rather than an older road network.

IGN 2016 – Licence Ouverte · Source and reuse terms

The five old maps in this collection remain available in Archives: maps of France from the original collection. Their images and URLs are preserved.

How do I download and print the map?

  1. Open the PDF beneath the preview for a sharp printed map. The PNG is suitable for a presentation or document.
  2. Save the file from your browser, then print using the document’s orientation and “Fit to page” if needed. IGN maps retain their original format.
  3. To change linework or colors, unzip the pack and open the SVG in a vector editor. Retain the source credit.

The insets have their own extent; the scale of the main map does not apply to them.

Sources and reuse terms

Carte-monde.org series: created by Carte-monde.org, October 2026, based on Natural Earth 5.1.1 (geometries at 1:10 million, public domain data). The French grouping follows the Code officiel géographique 2026, via Etalab, administrative divisions 6.0.0. The outlines are generalised and are unsuitable for cadastral use or legal boundary demarcation.

The new PDF, PNG and SVG files are available under Licence Ouverte 2.0 : copying, adaptation and commercial use permitted with source and date attribution. Example credit: Carte-monde.org, October 2026 edition — Natural Earth 5.1.1; COG 2026 / Etalab. Licence Ouverte 2.0.

IGN maps: existing files, 2016 edition, reused under the open licence stated on the official educational resources page. Credit to retain: IGN 2016 – Licence Ouverte. The original PDF and JPG files have not been redrawn.

Maps in the older collection, available in the archives, retain their own terms; their license is not confirmed here.

Continue exploring

Maps of Germany · Maps of Spain · All maps of France

Previous versions: maps and files preserved

These files remain available at their original URLs. For corrected maps, use the main links above. Each edition retains its credits and date.

Raster base map, cities, rivers and lakes: Natural Earth, public domain. Other boundary credits and licences are retained in the pack. Cartographic work CC BY 4.0; ODbL-derived data retains its licence. No topographic accuracy is claimed.

Previous collection — original files preserved
Flag of France
Flag of France
Downloadable maps of France
French Regions (before 2016)
Map of French departments (before 2016)
General Relief map of France
General Map of France
Map of French historical regions
Original French files
Previous language edition

Maps of Greece: regions, cities, relief and population

Flag of Greece
Flag of Greece

GREECE · PRINTABLE MAPS

Five printable maps of Greece: regions and cities, location in Europe, two views of the relief and population. PDFs, images and sources are available below.

Our five maps have English labels. Maps from other publishers retain their original language.

Regions, cities and location in Europe

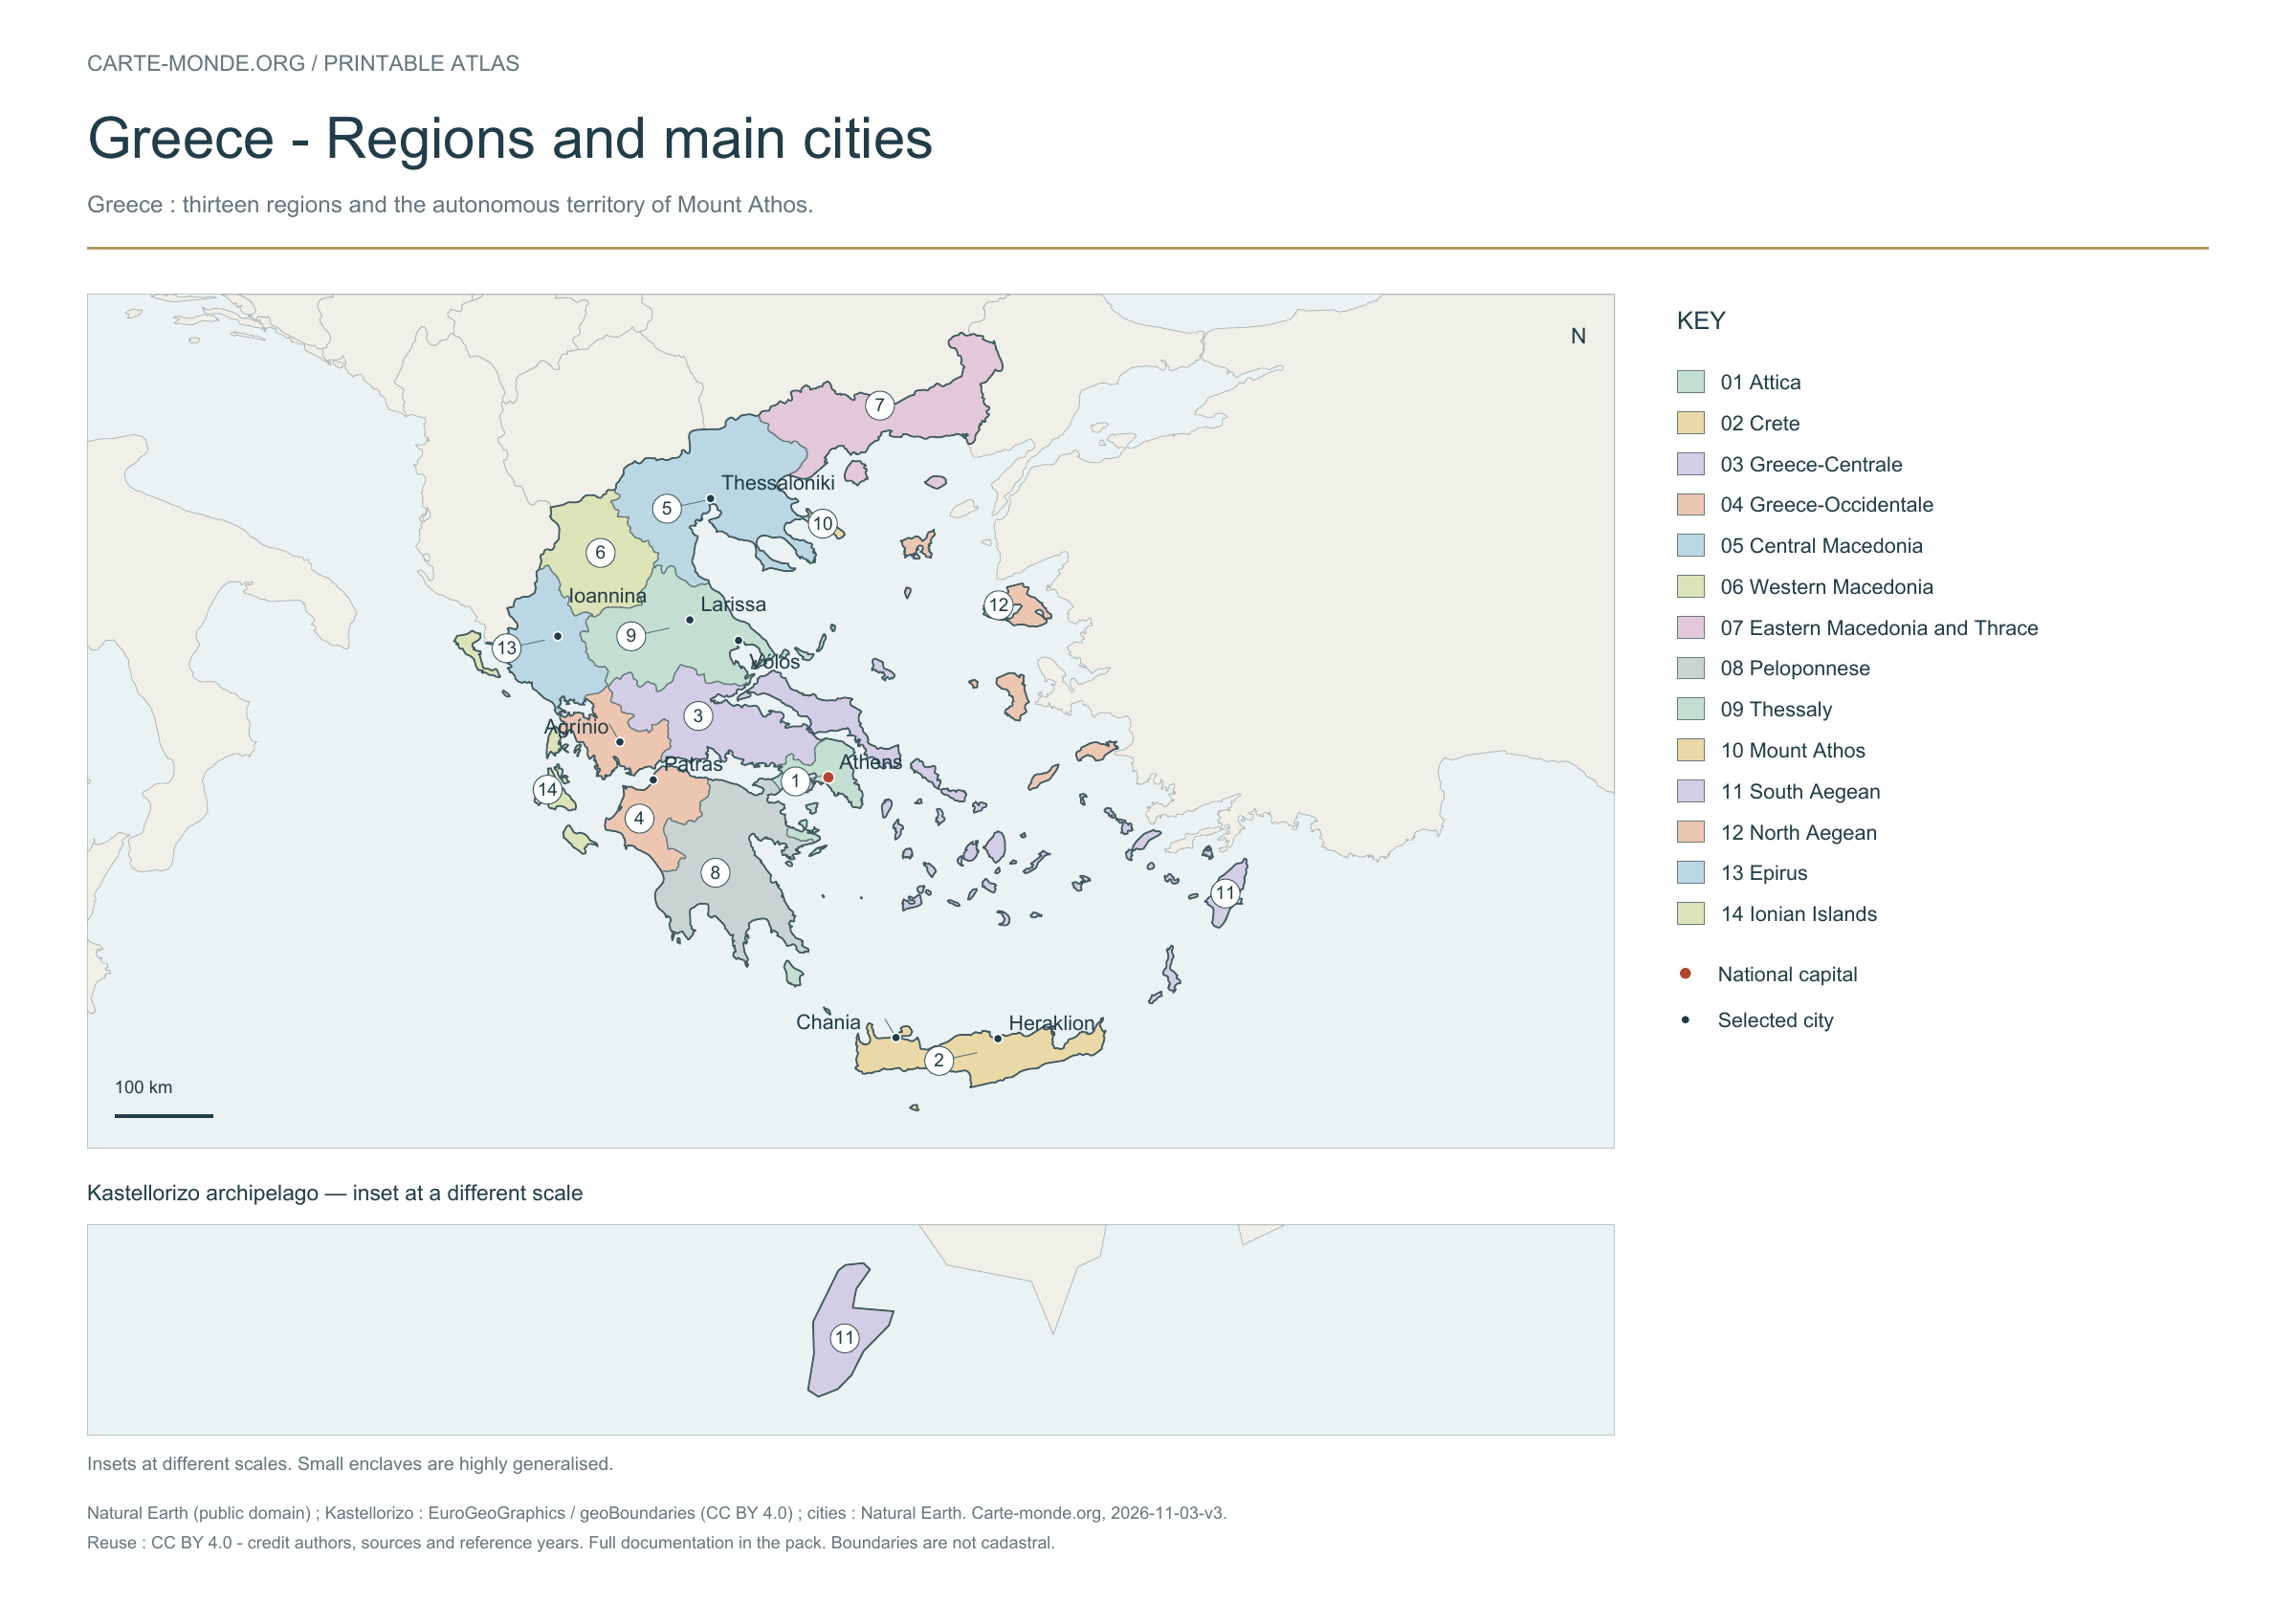
Greece: thirteen regions and the autonomous territory of Mount Athos. Kastellorizo is shown in an inset on the corrected national maps.

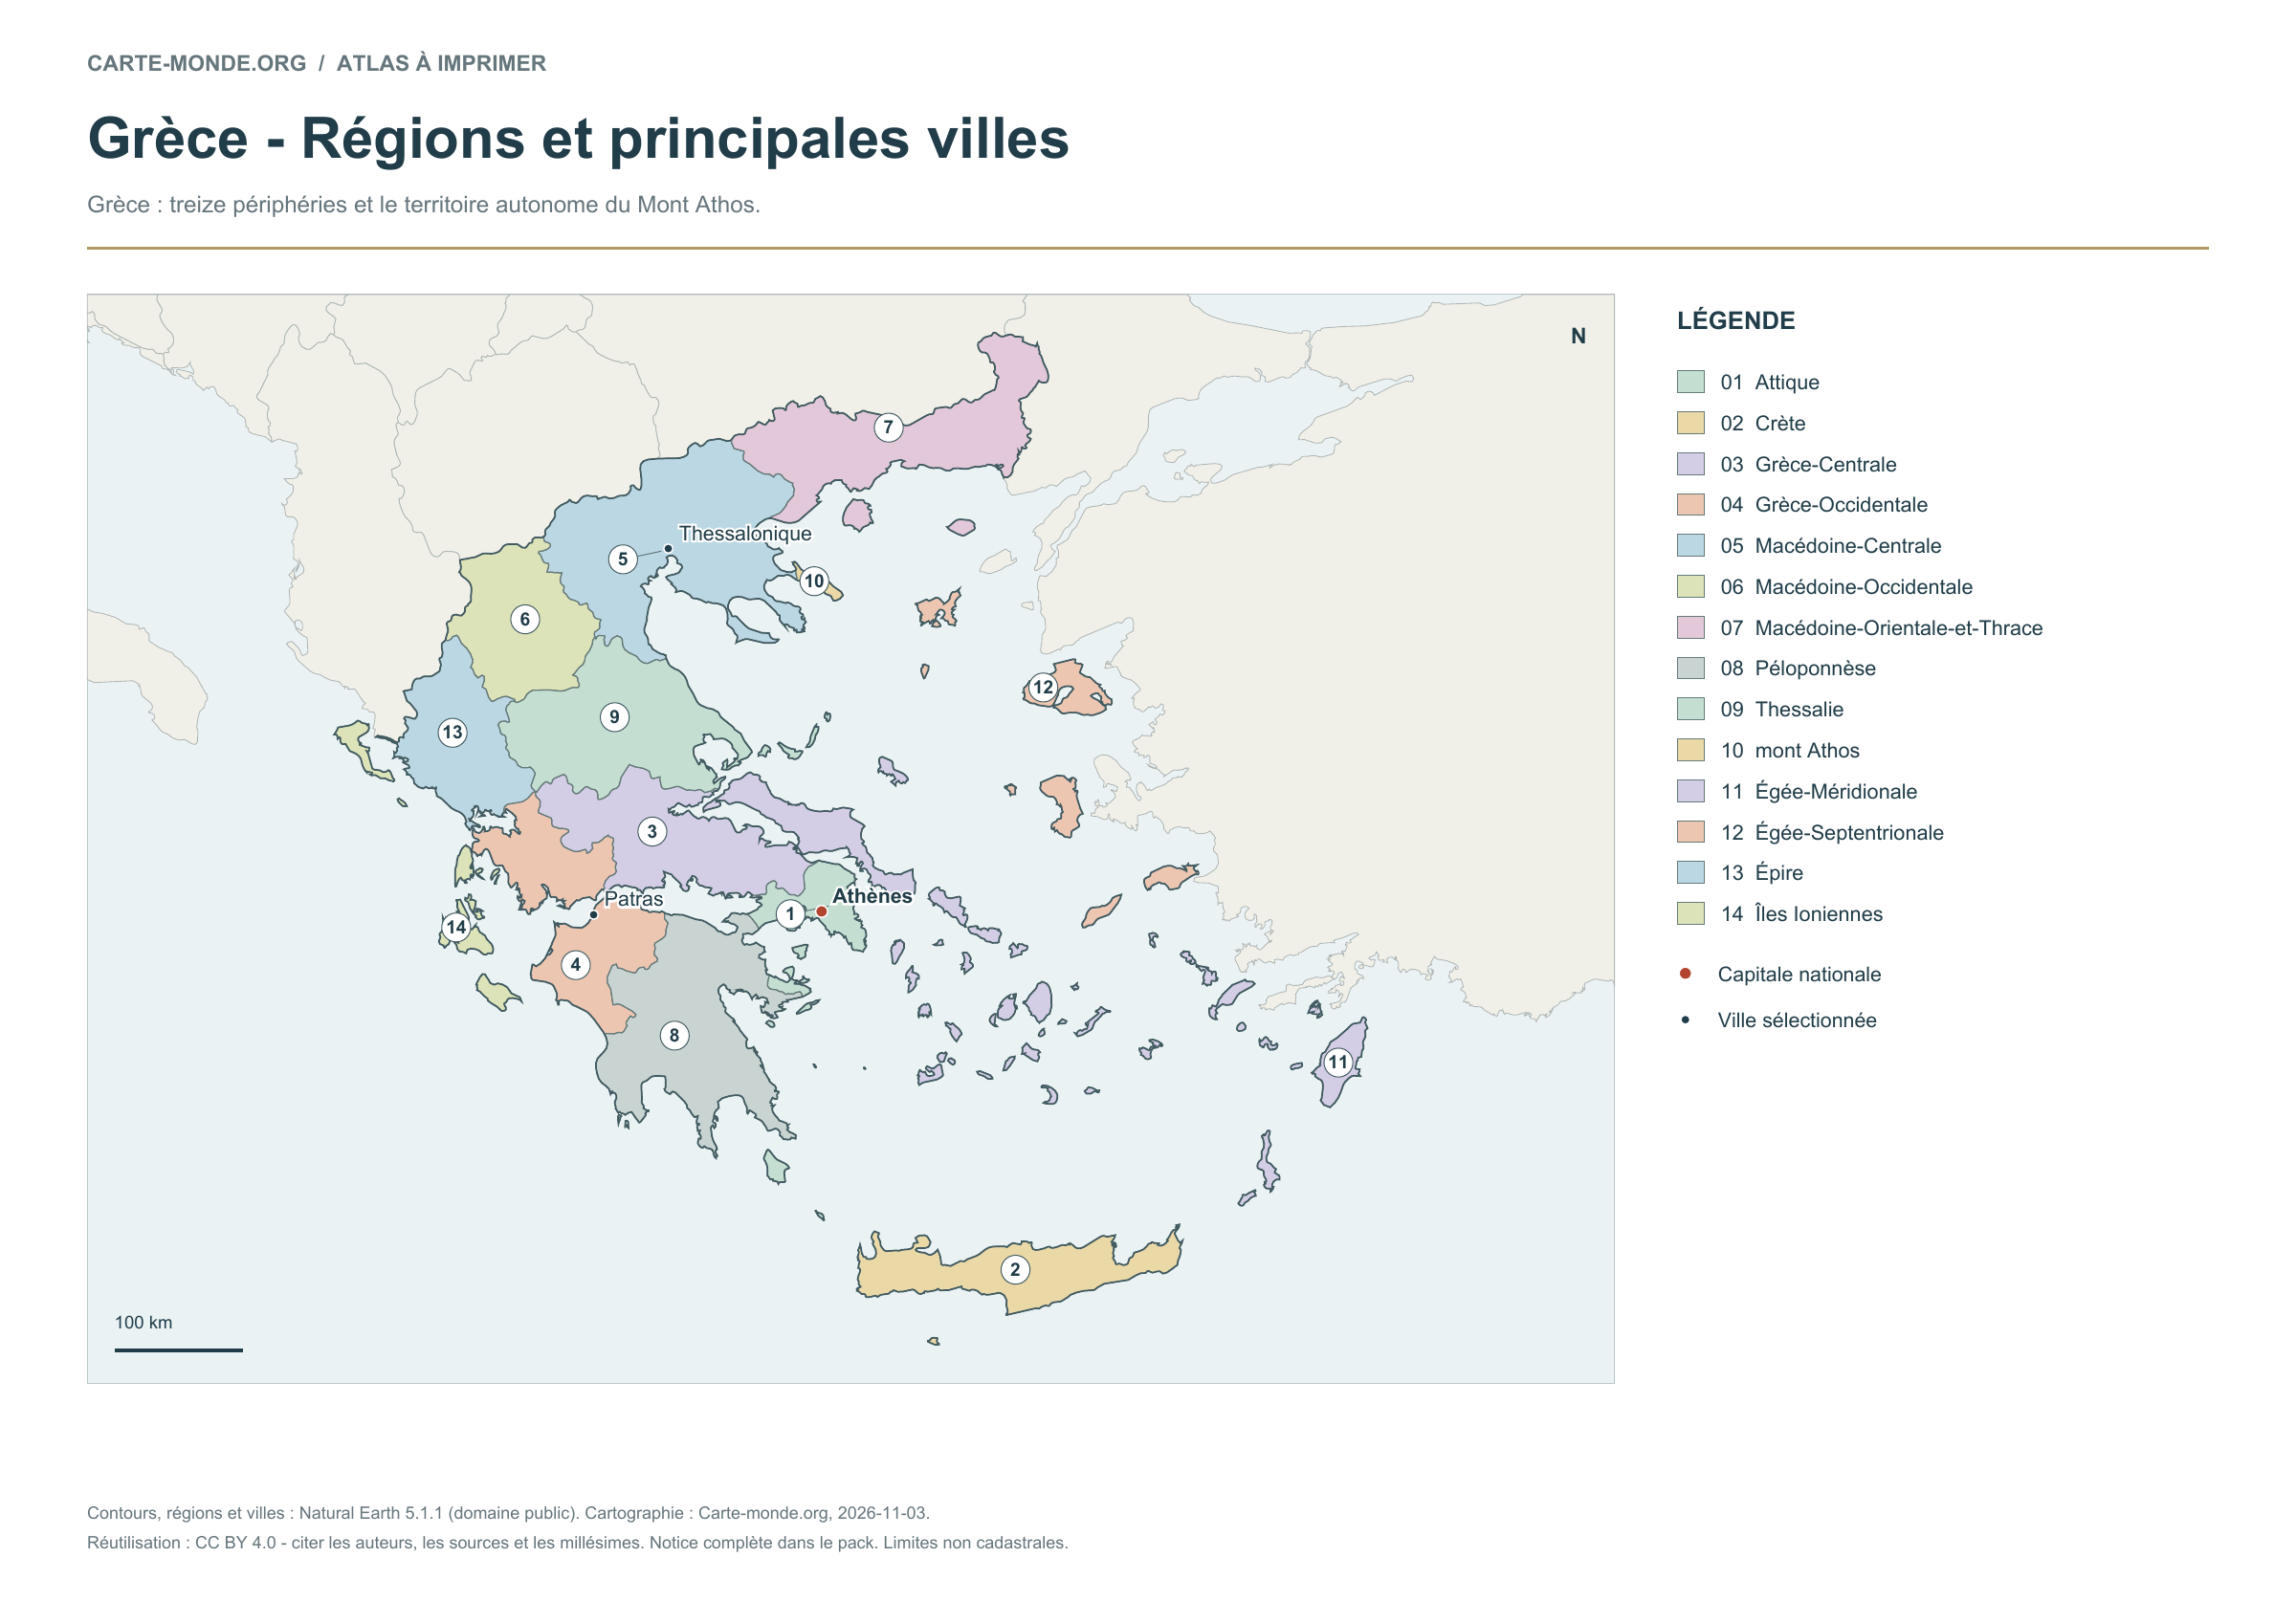
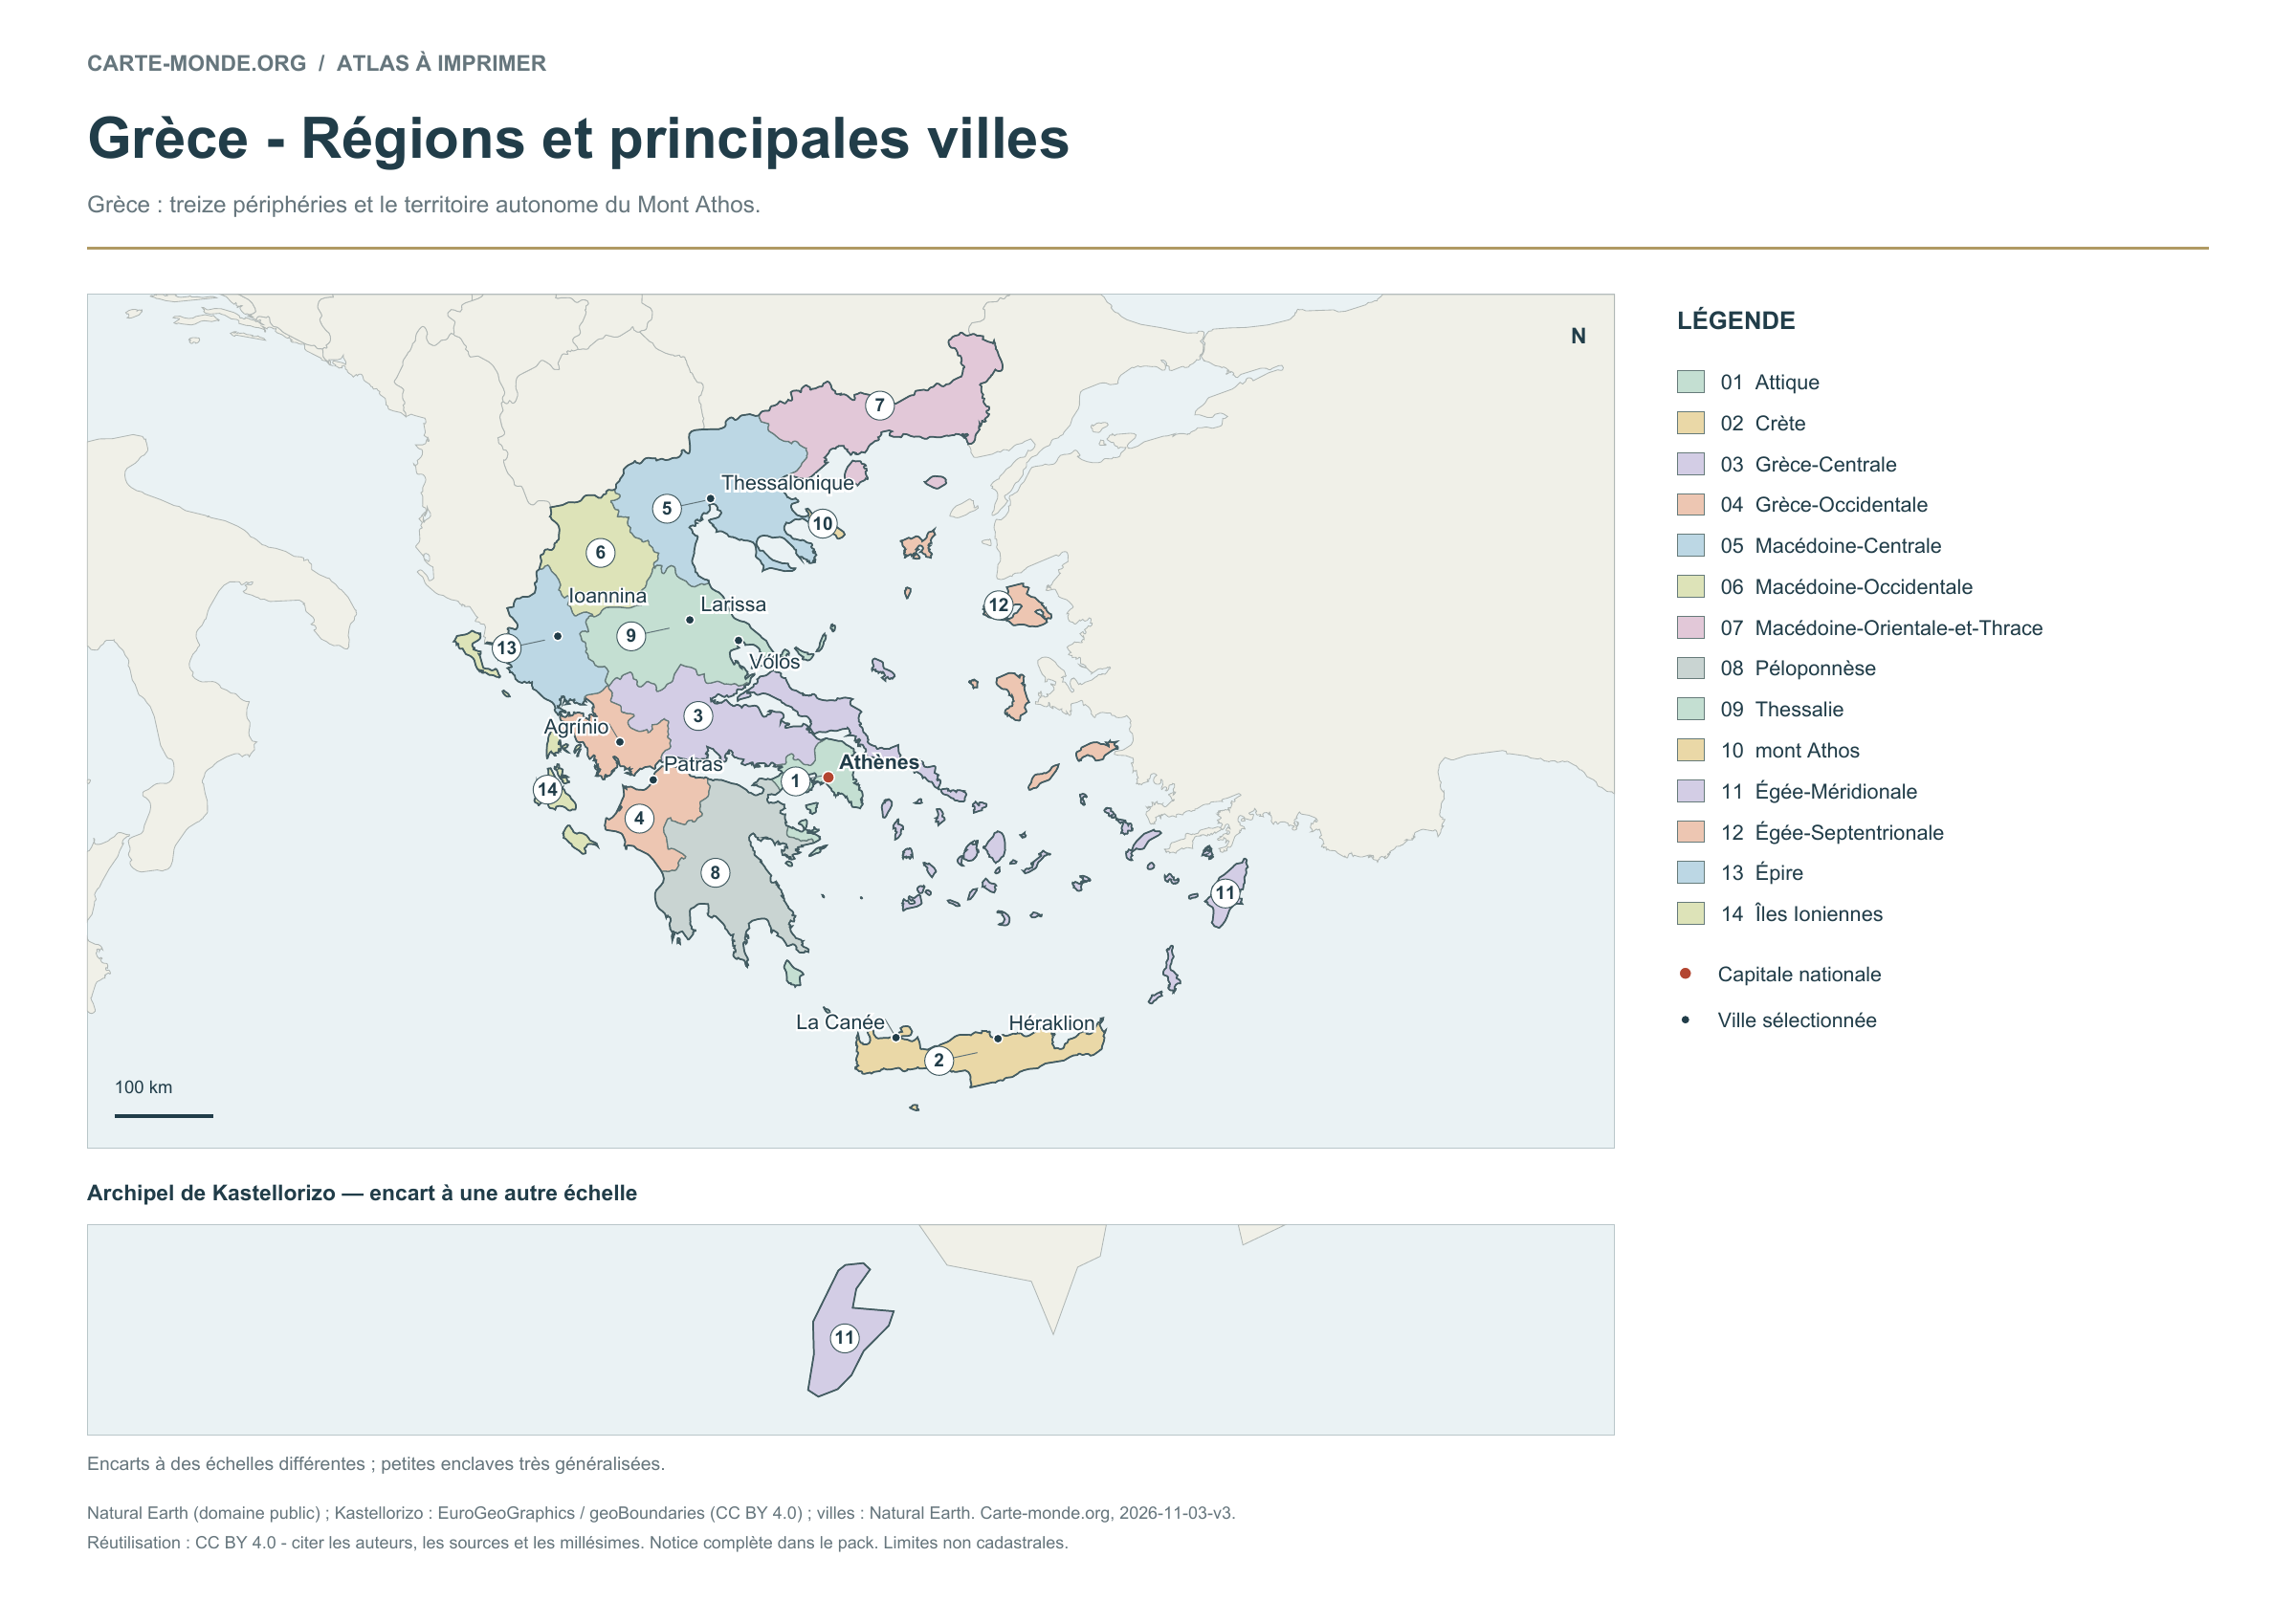
Regions and main cities — Greece

Carte-monde.org · November 2026

Regions and main cities

The thirteen regions and the autonomous territory of Mount Athos are distinguished in the legend. Kastellorizo appears in an inset; the cities are an educational selection.

A4 landscape PDF · PNG 2 400 px · CC BY 4.0

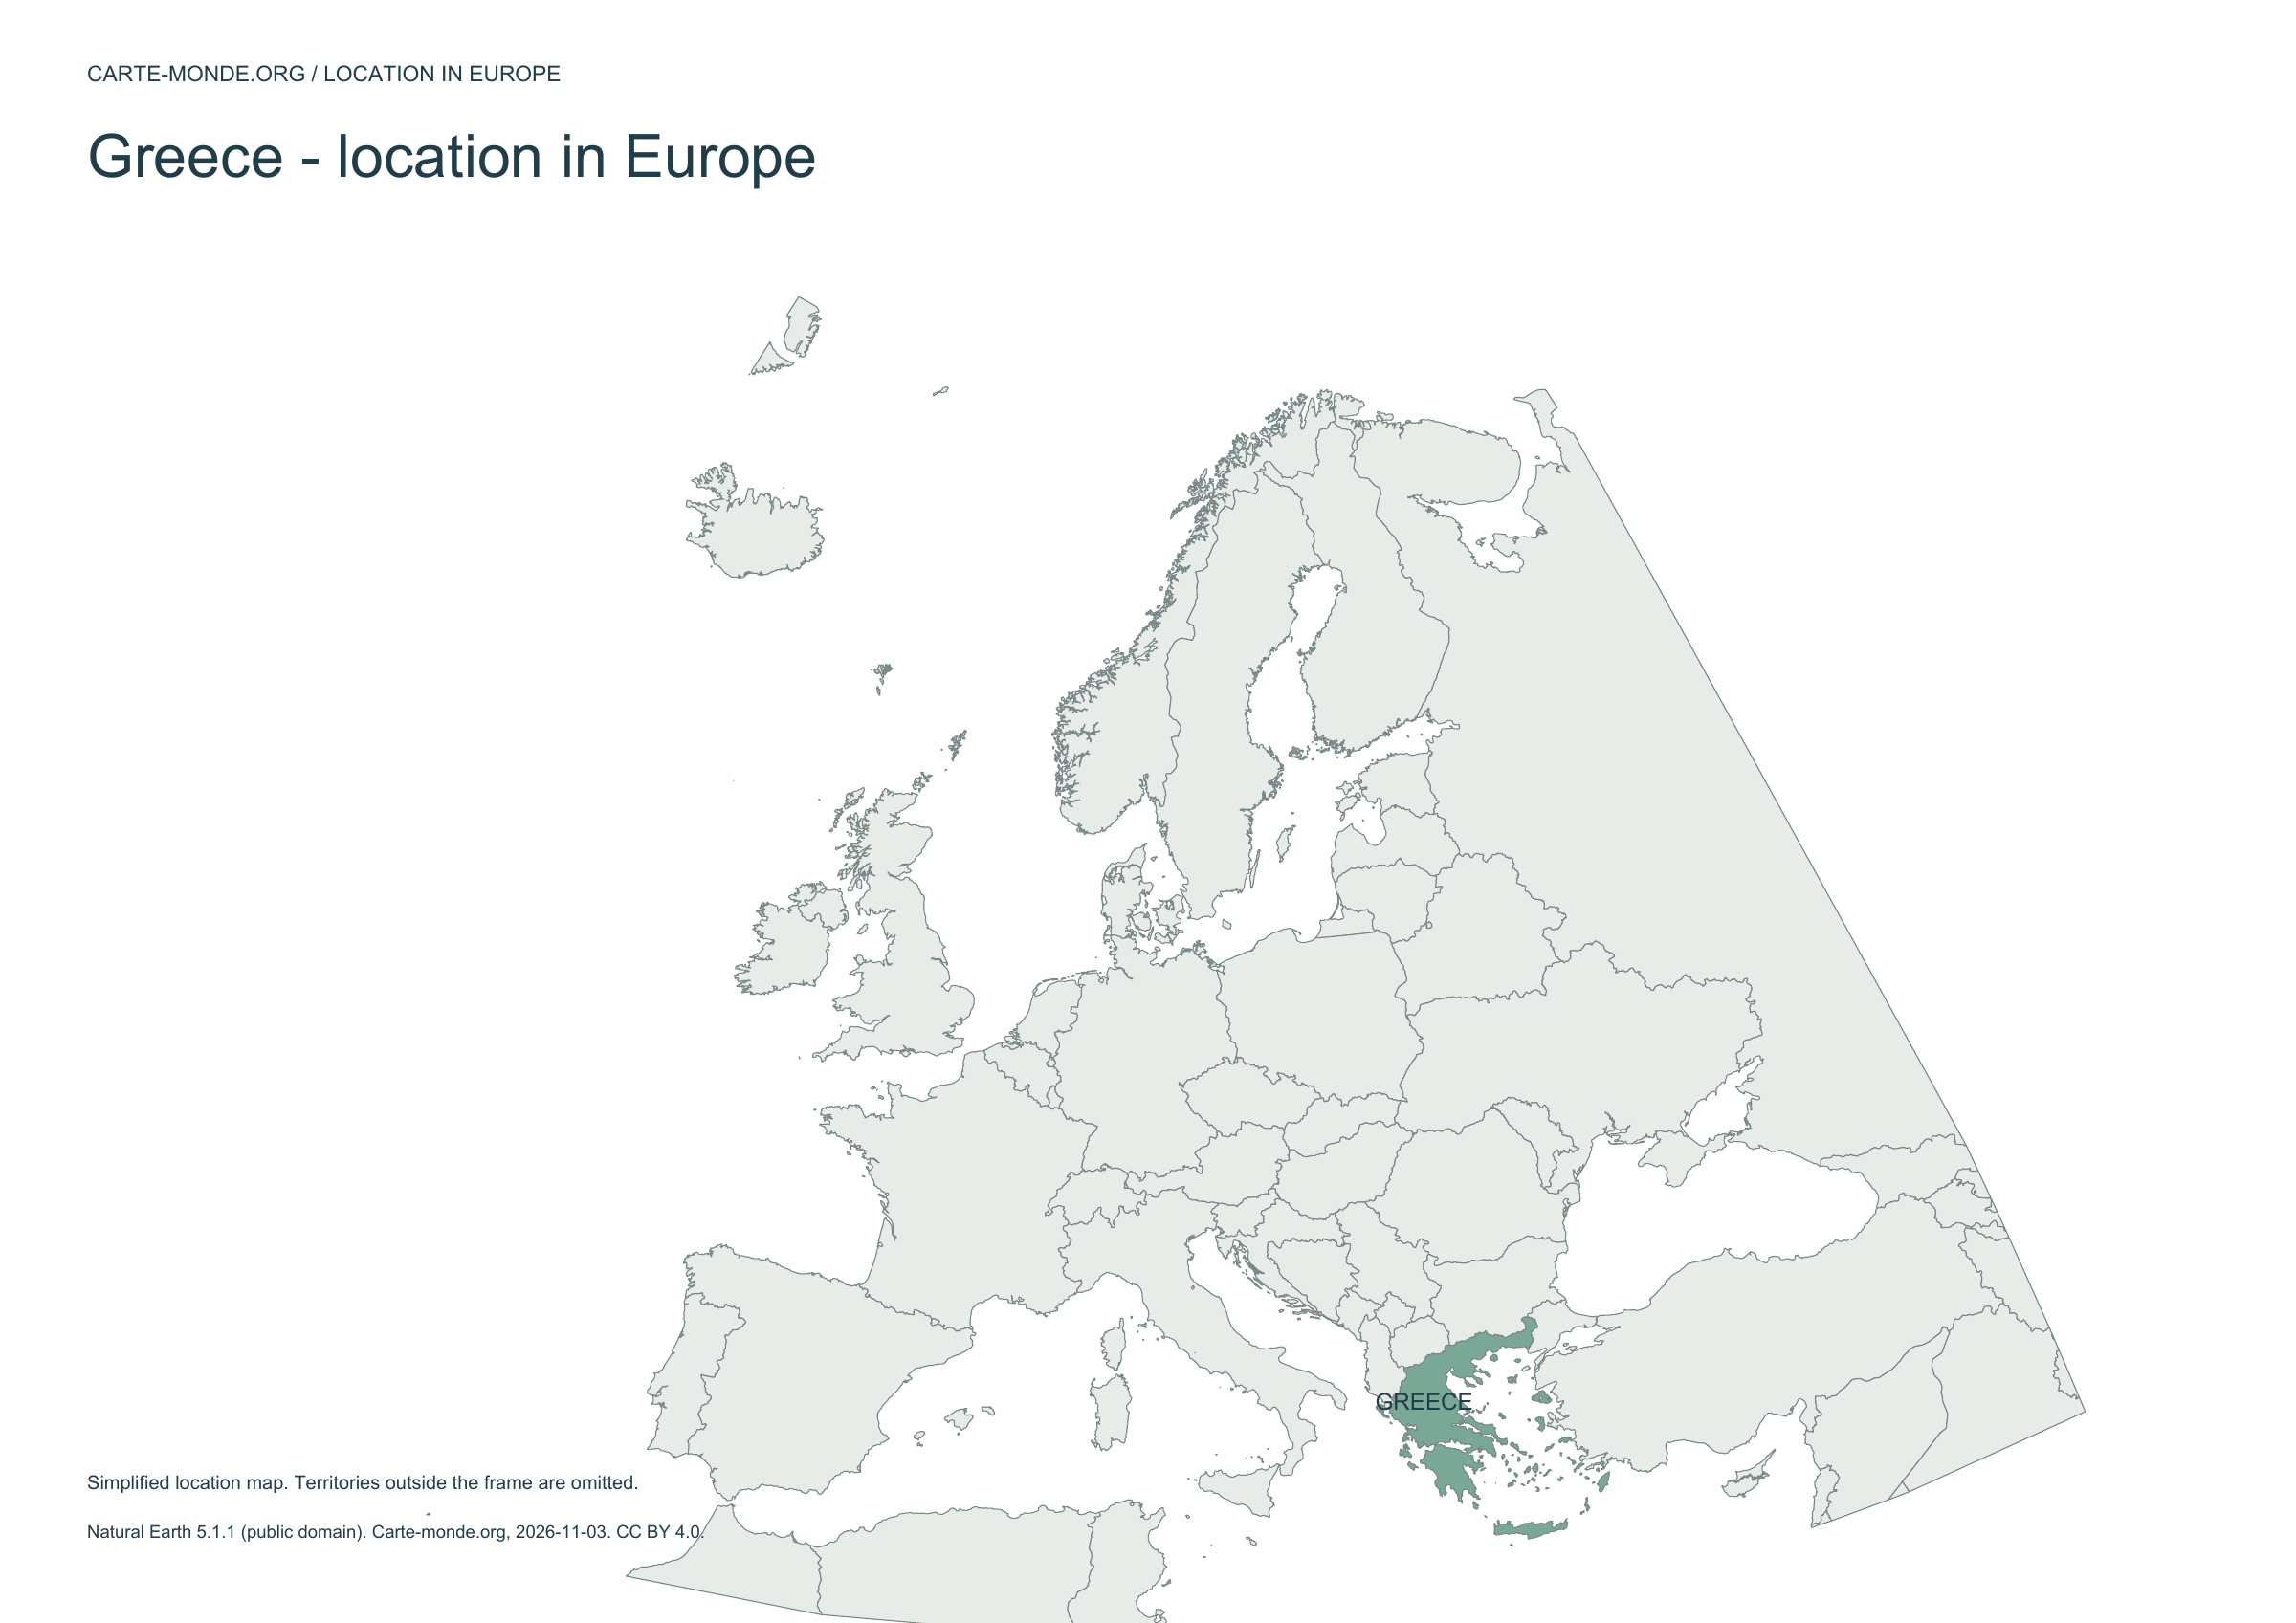
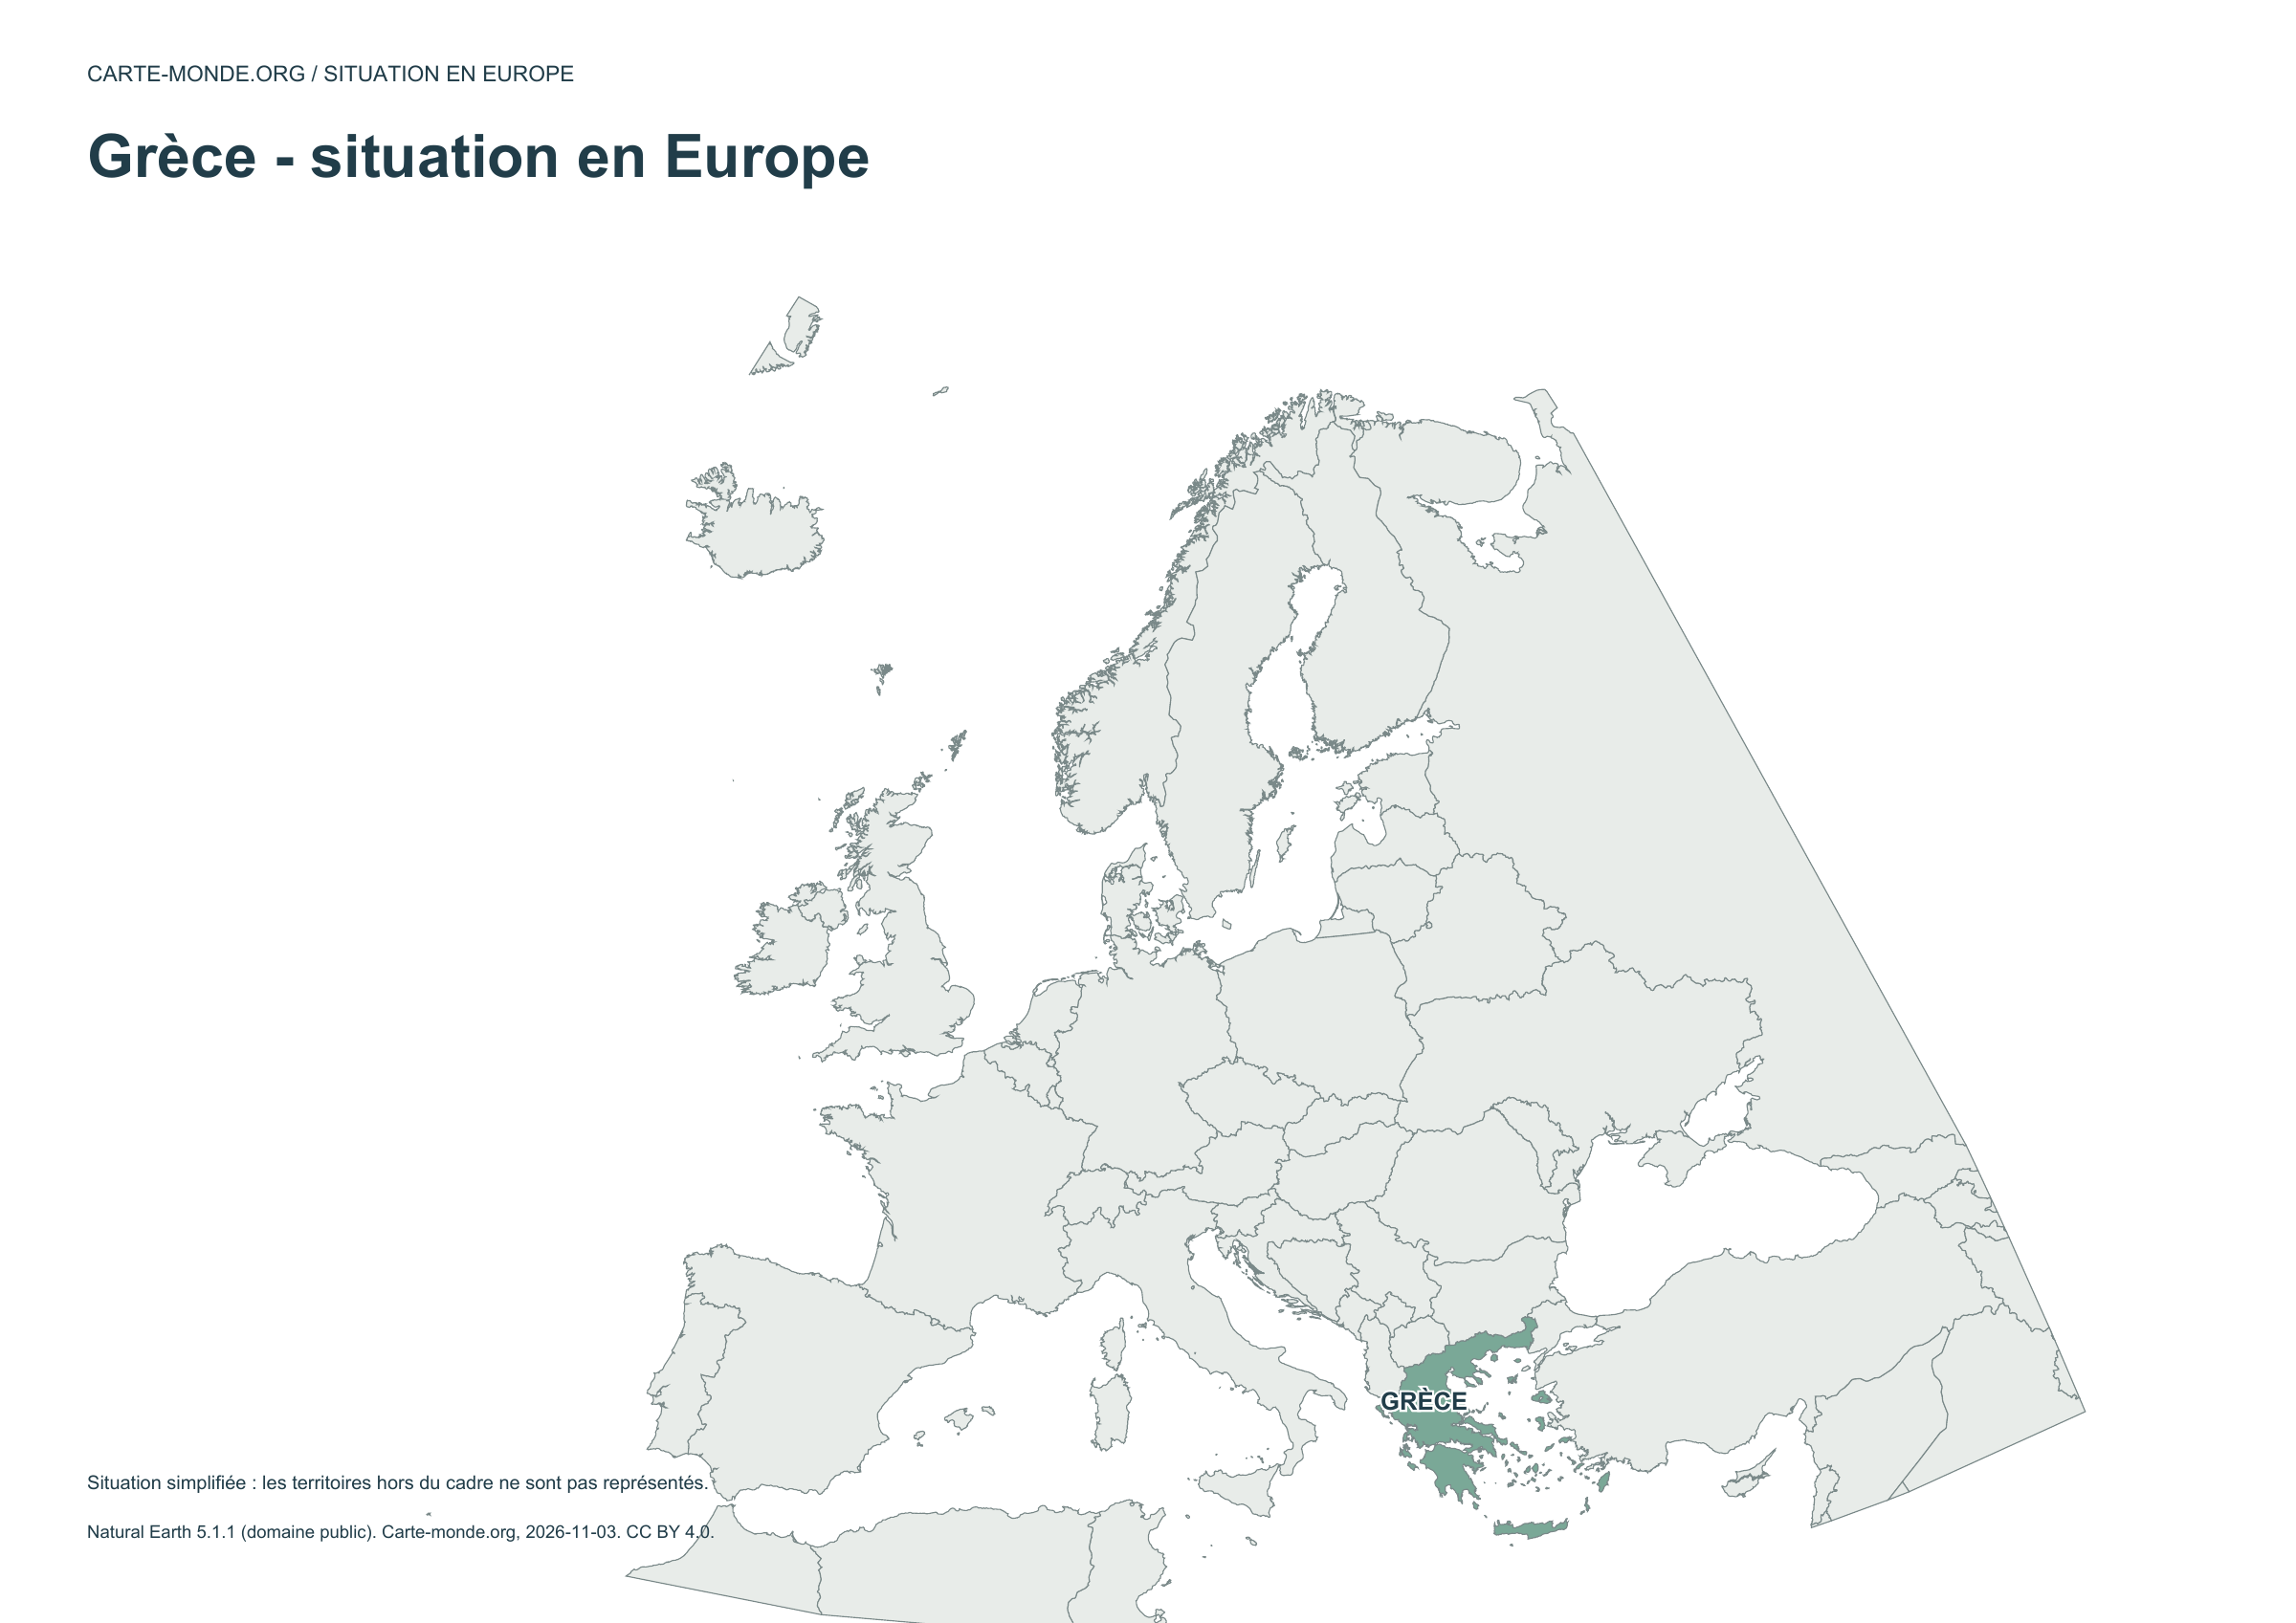
Location in Europe — Greece

Carte-monde.org · November 2026

Location in Europe

The country is highlighted within a simplified European frame; territories outside this frame are not shown.

A4 landscape PDF · PNG 2 400 px · CC BY 4.0

Two maps to understand the relief

Choose shaded relief for an overview, or elevation classes for school use.

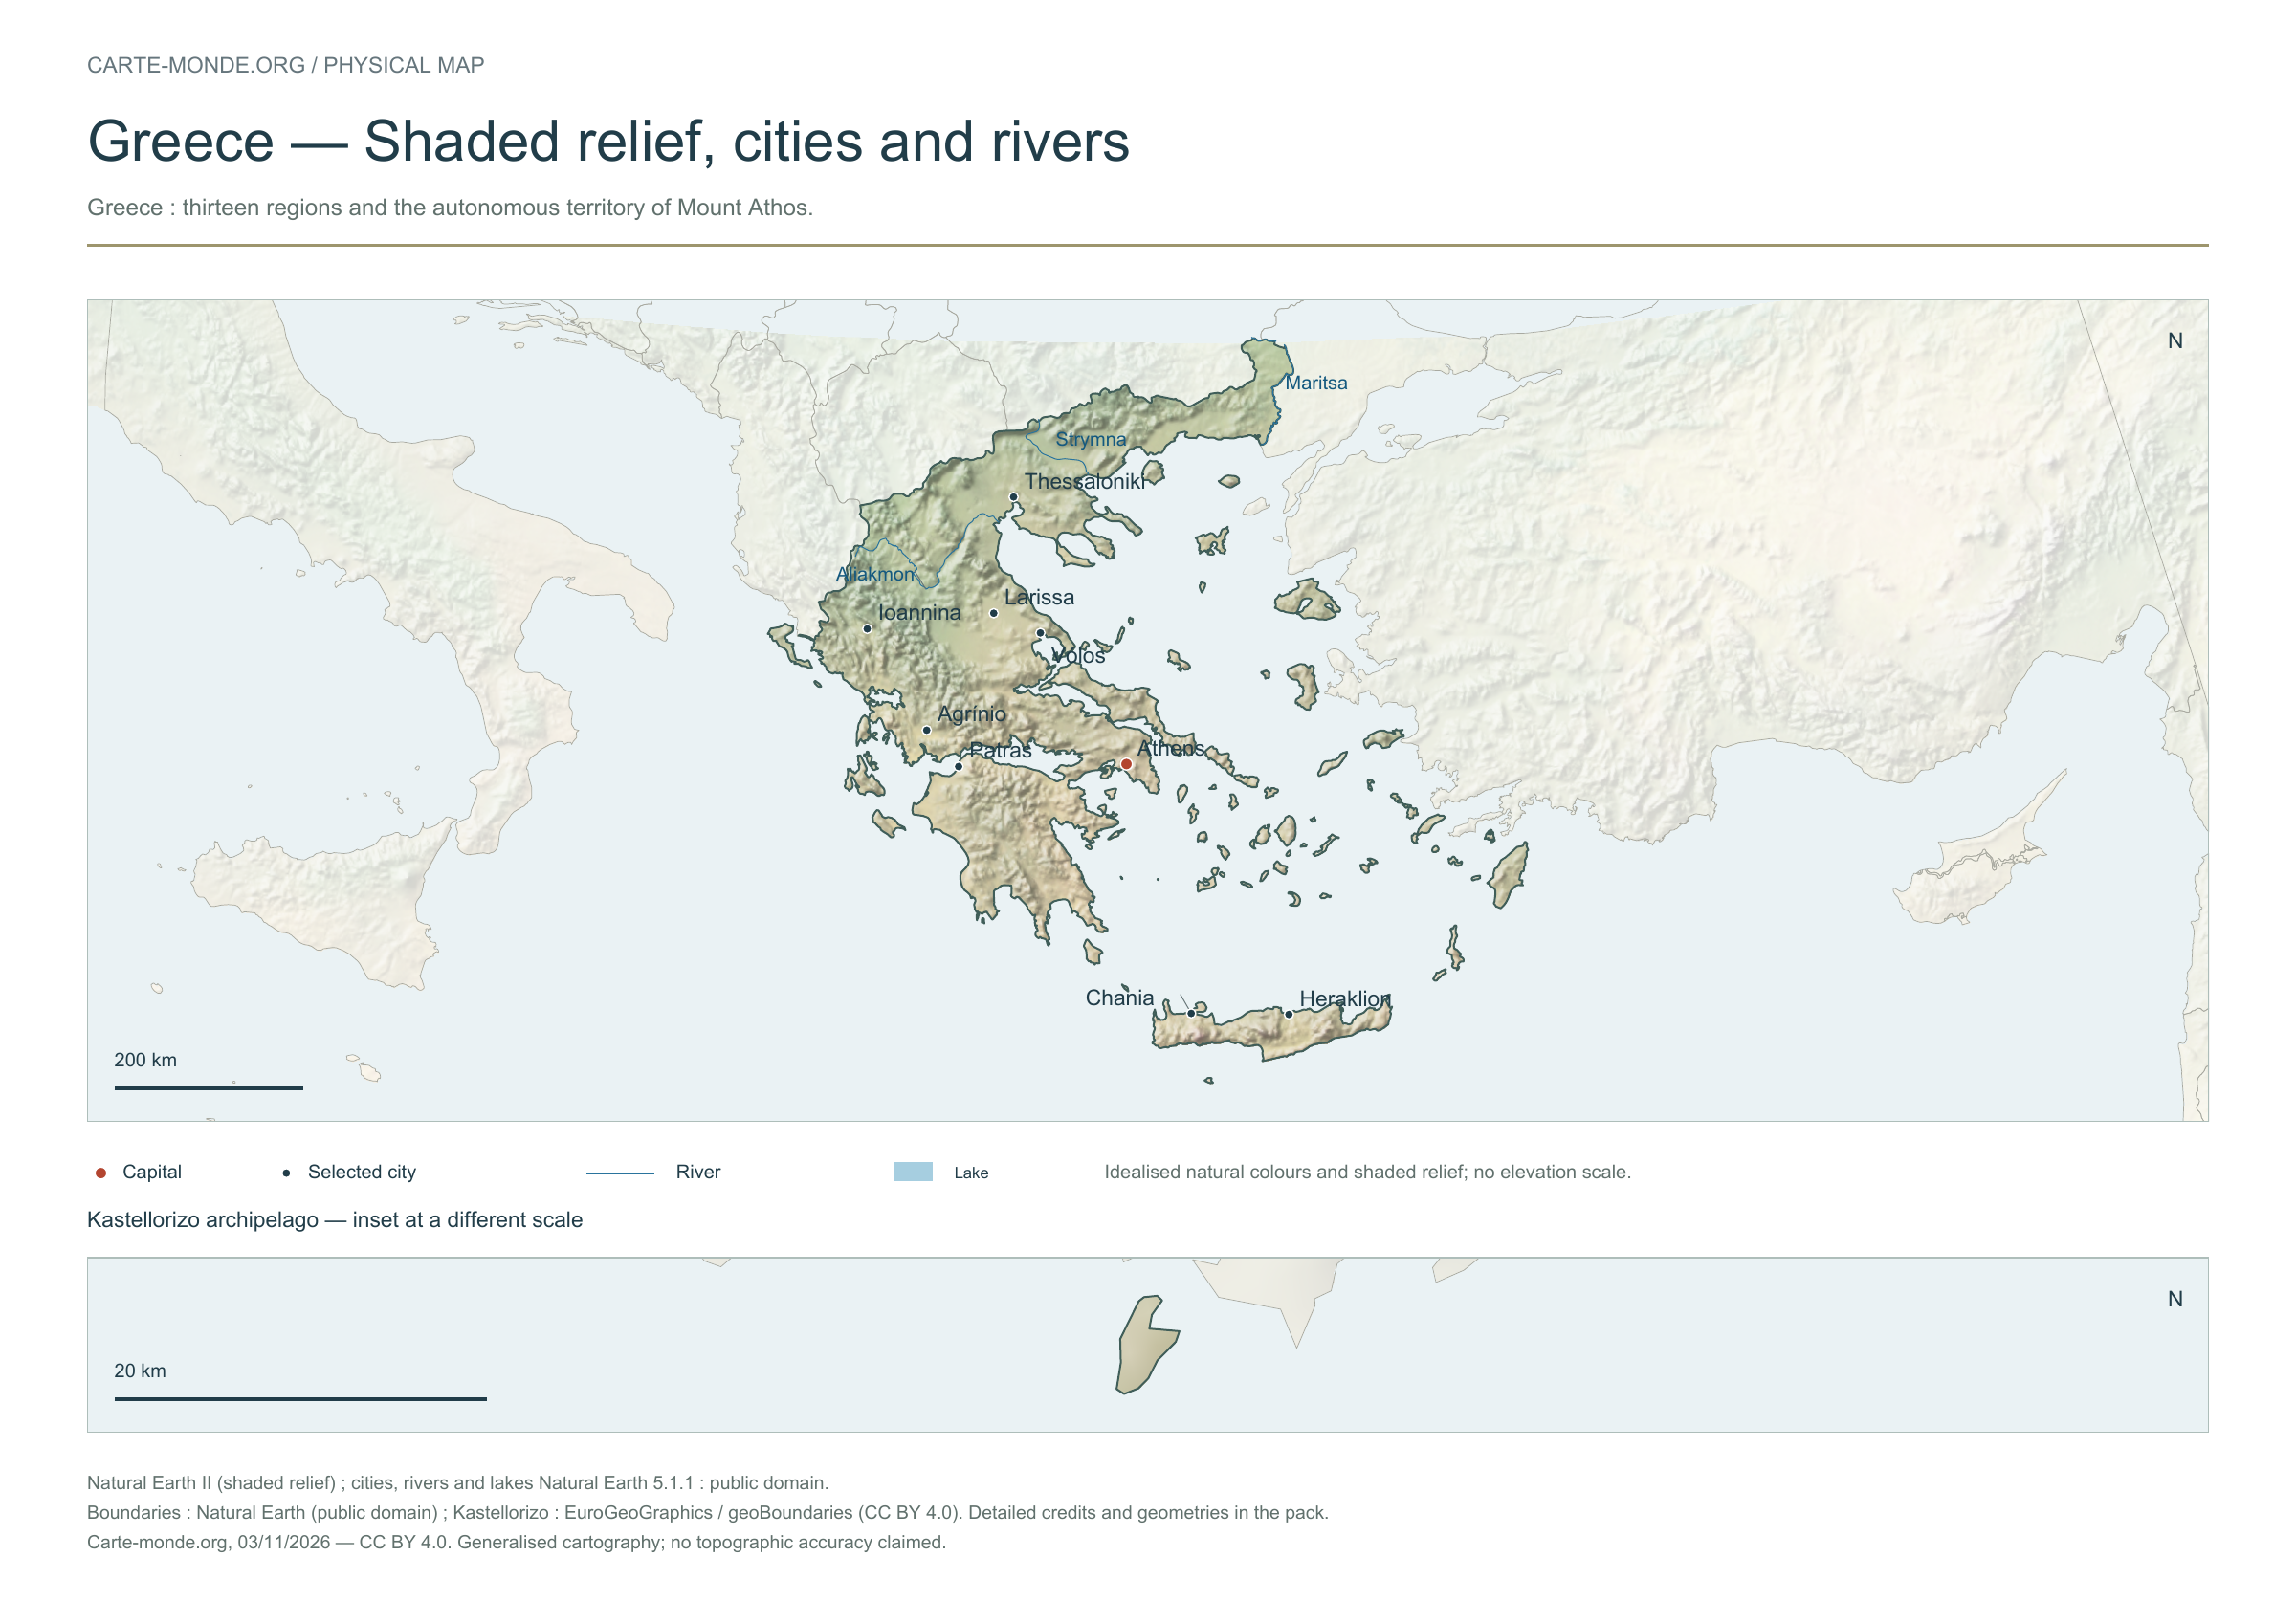
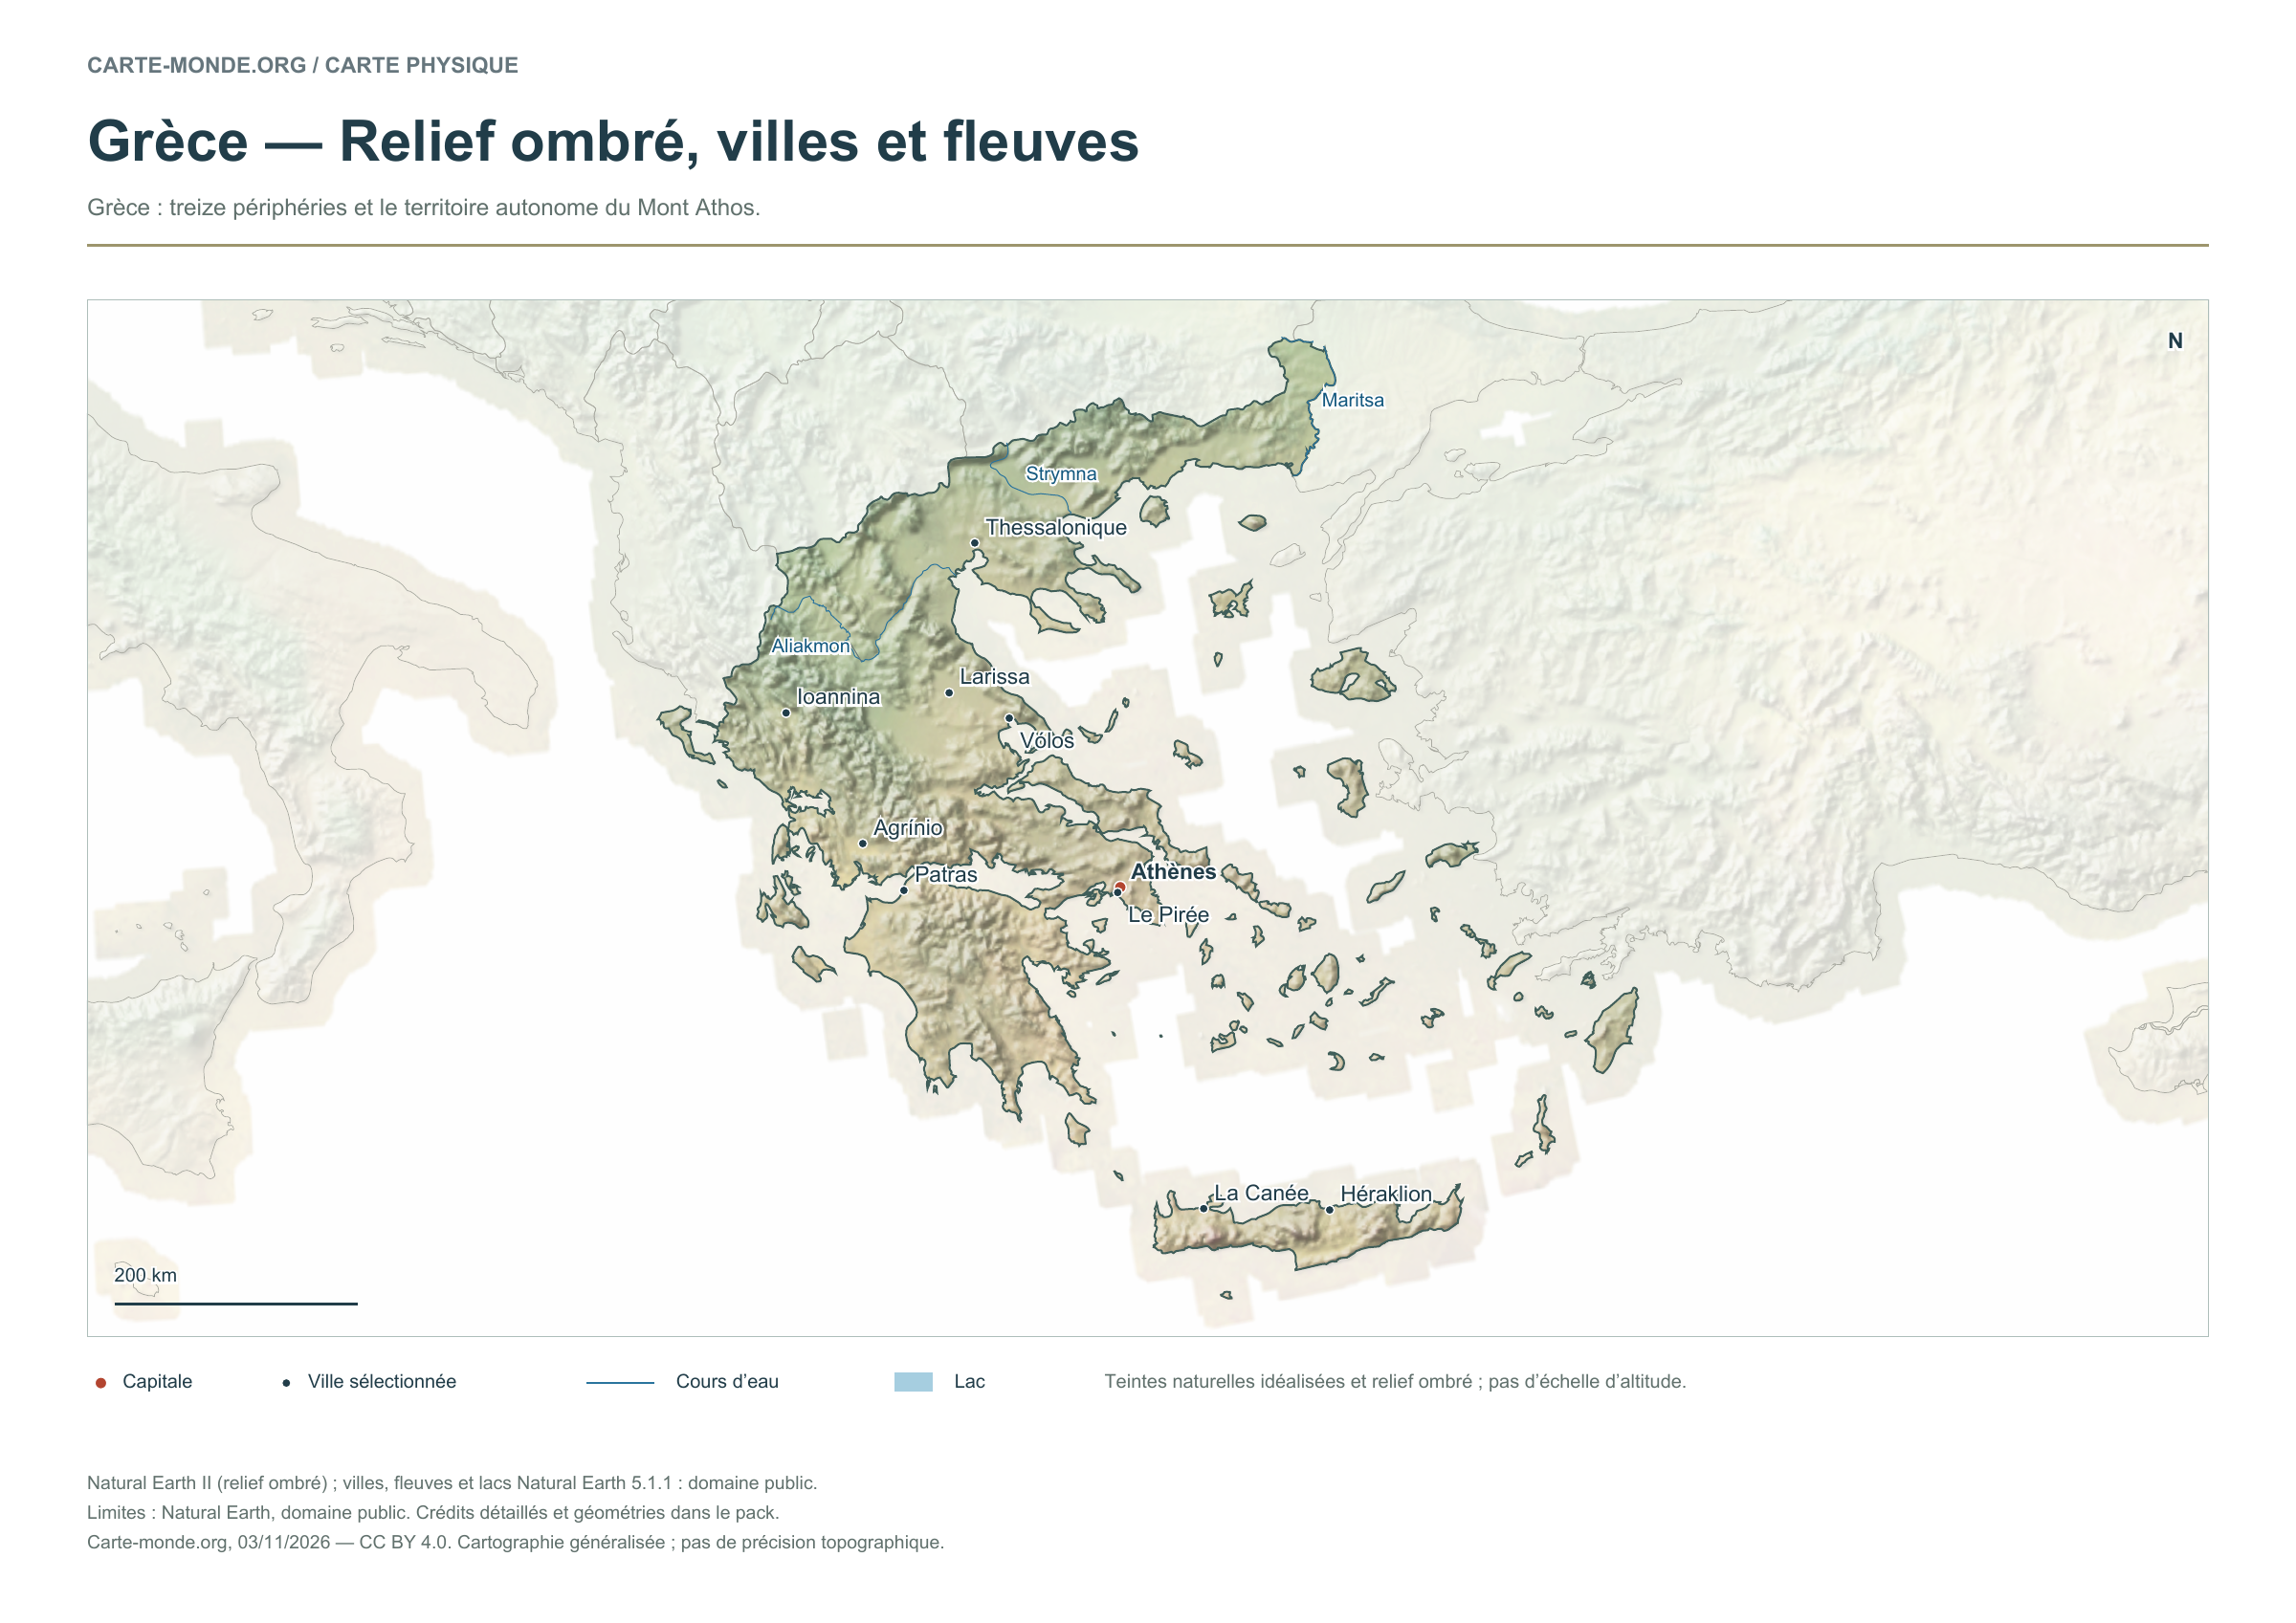
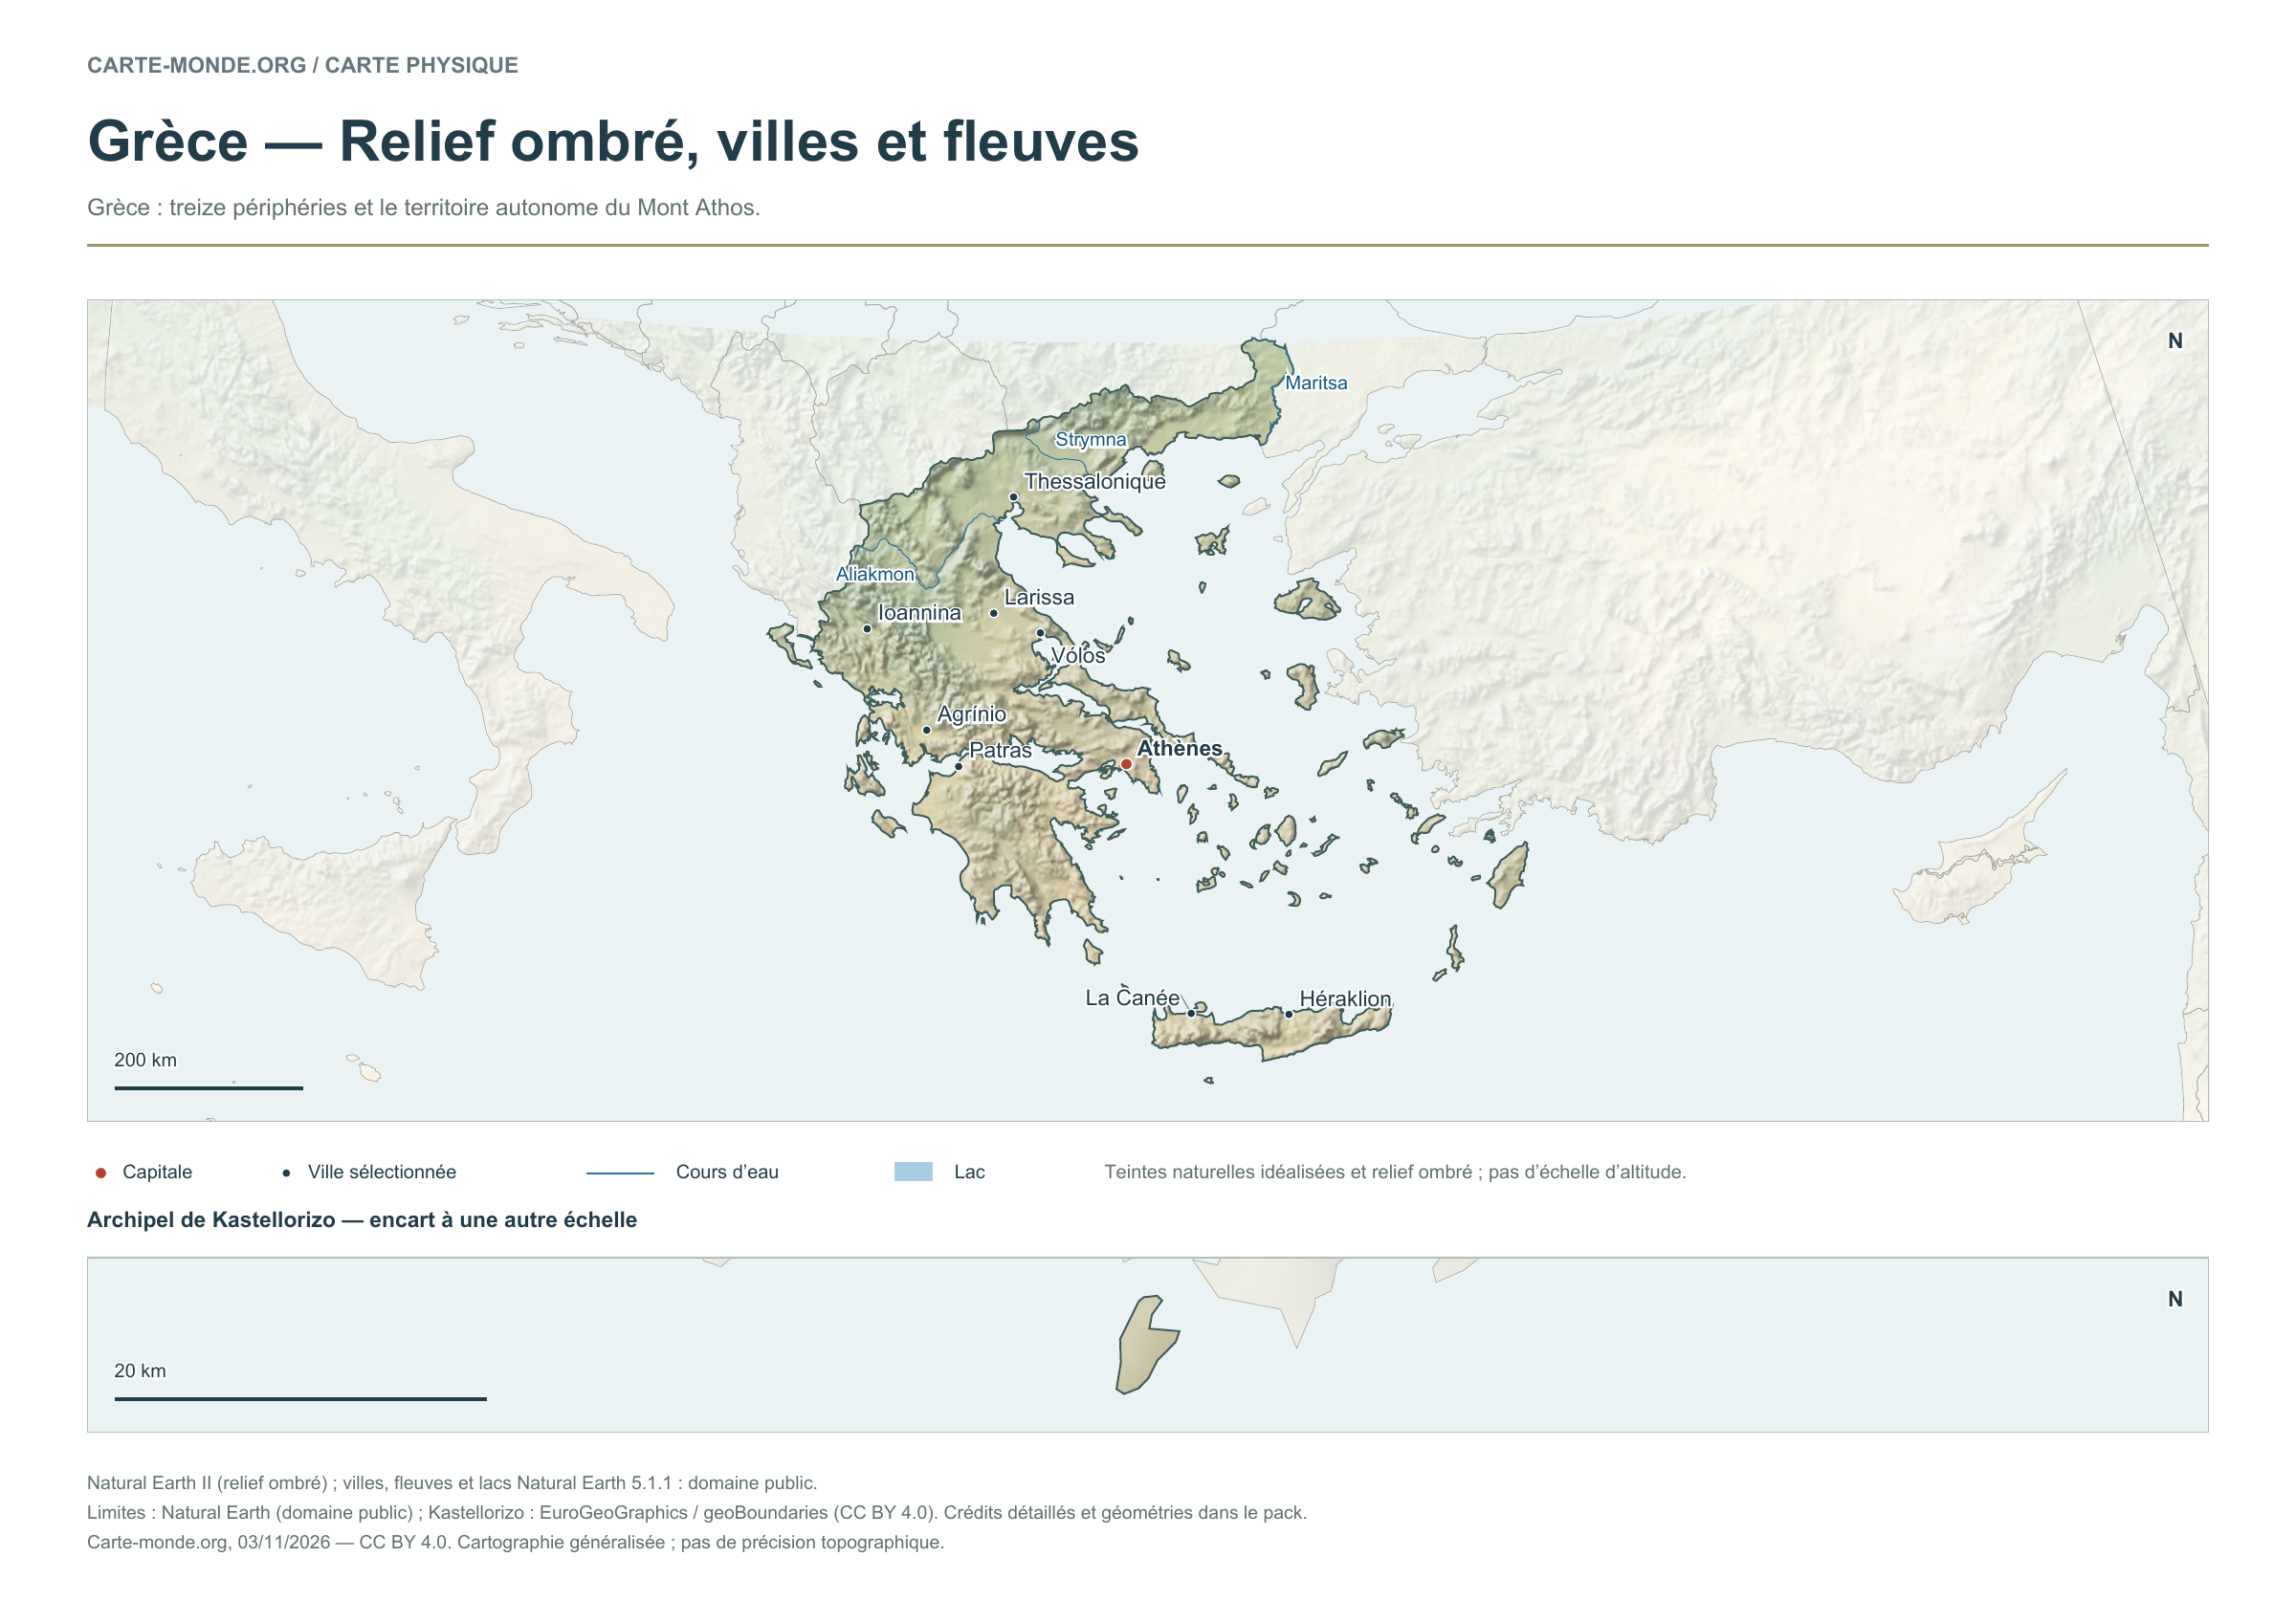
Greece — Shaded relief, cities and rivers

Carte-monde.org · November 2026

Shaded relief, cities and rivers

To identify major landforms, cities and the river network. The natural colours are not an elevation scale.

Raster base map, cities, rivers and lakes: Natural Earth, public domain. Other boundary credits and licences are retained in the pack. Cartographic work CC BY 4.0; ODbL-derived data retains its licence. No topographic accuracy is claimed.

Territory, data and selection of names

Greece: thirteen regions and the autonomous territory of Mount Athos.

Natural Earth II shaded relief base map, 9 selected cities. Named rivers: Aliakmon, Maritsa, Strymna.

The colours represent idealised natural cover; they do not correspond to elevation classes. This global background remains generalised, particularly for small states.

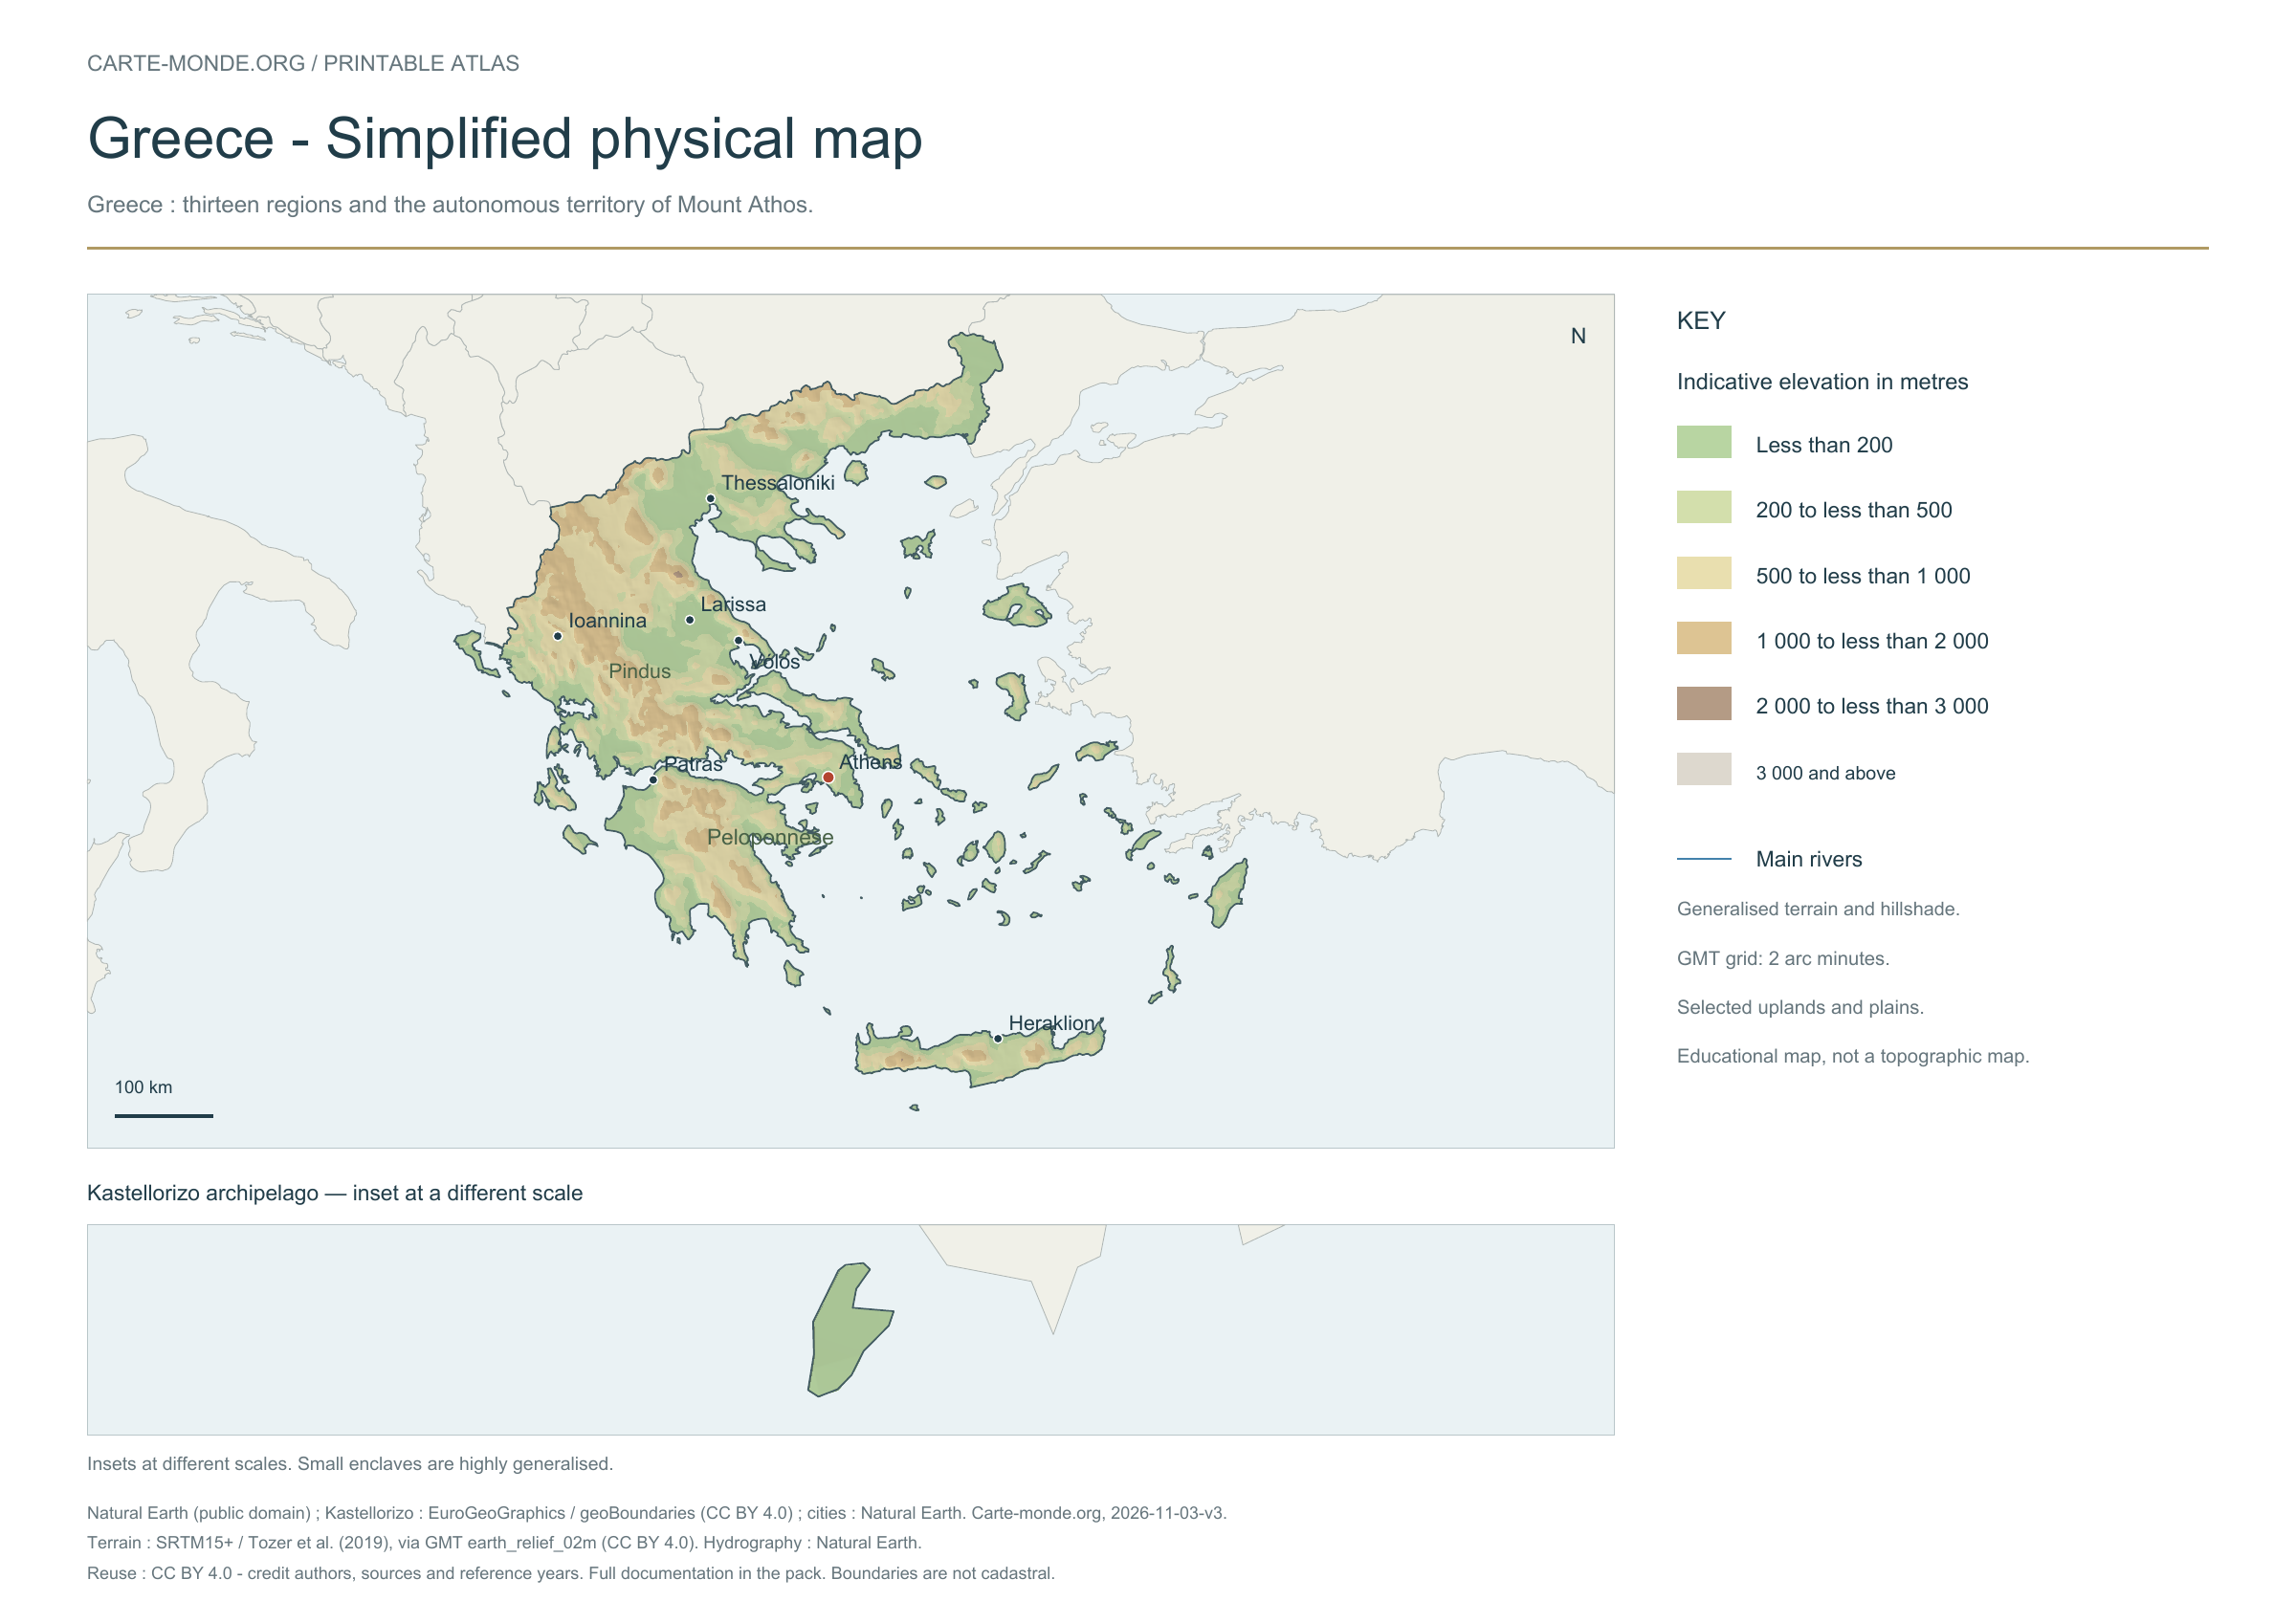
Kastellorizo is shown in an inset at a different scale.

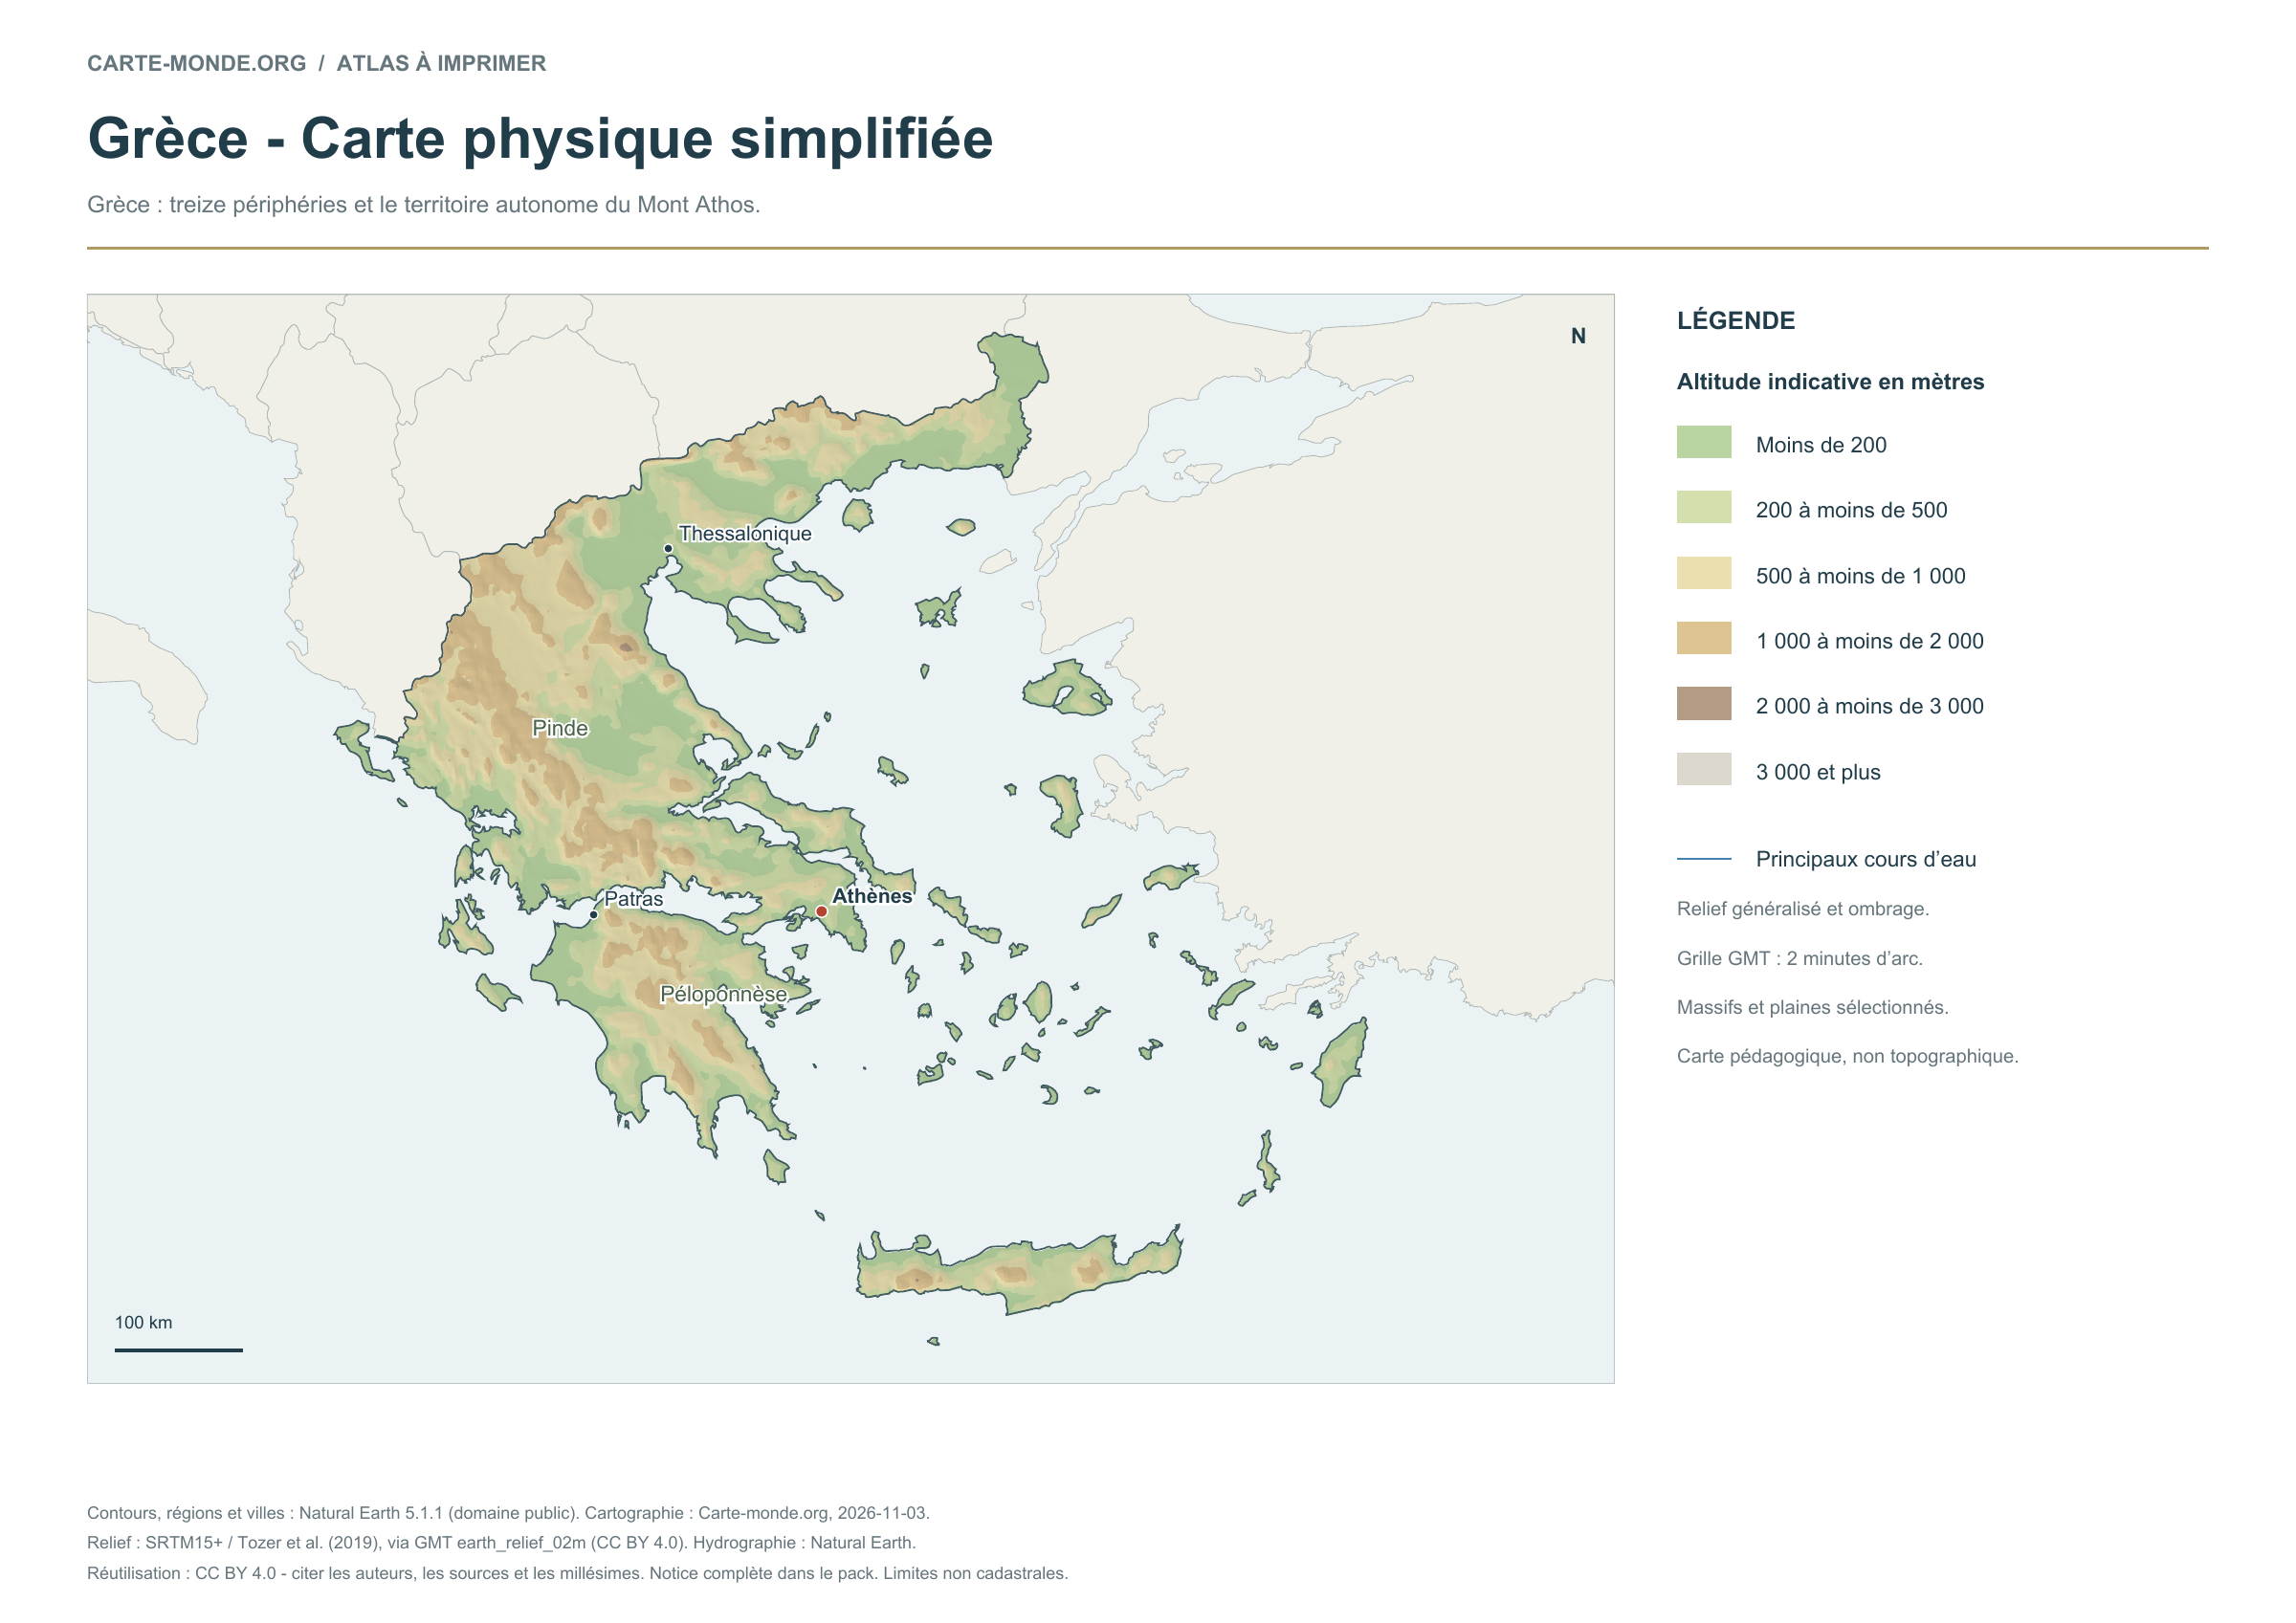
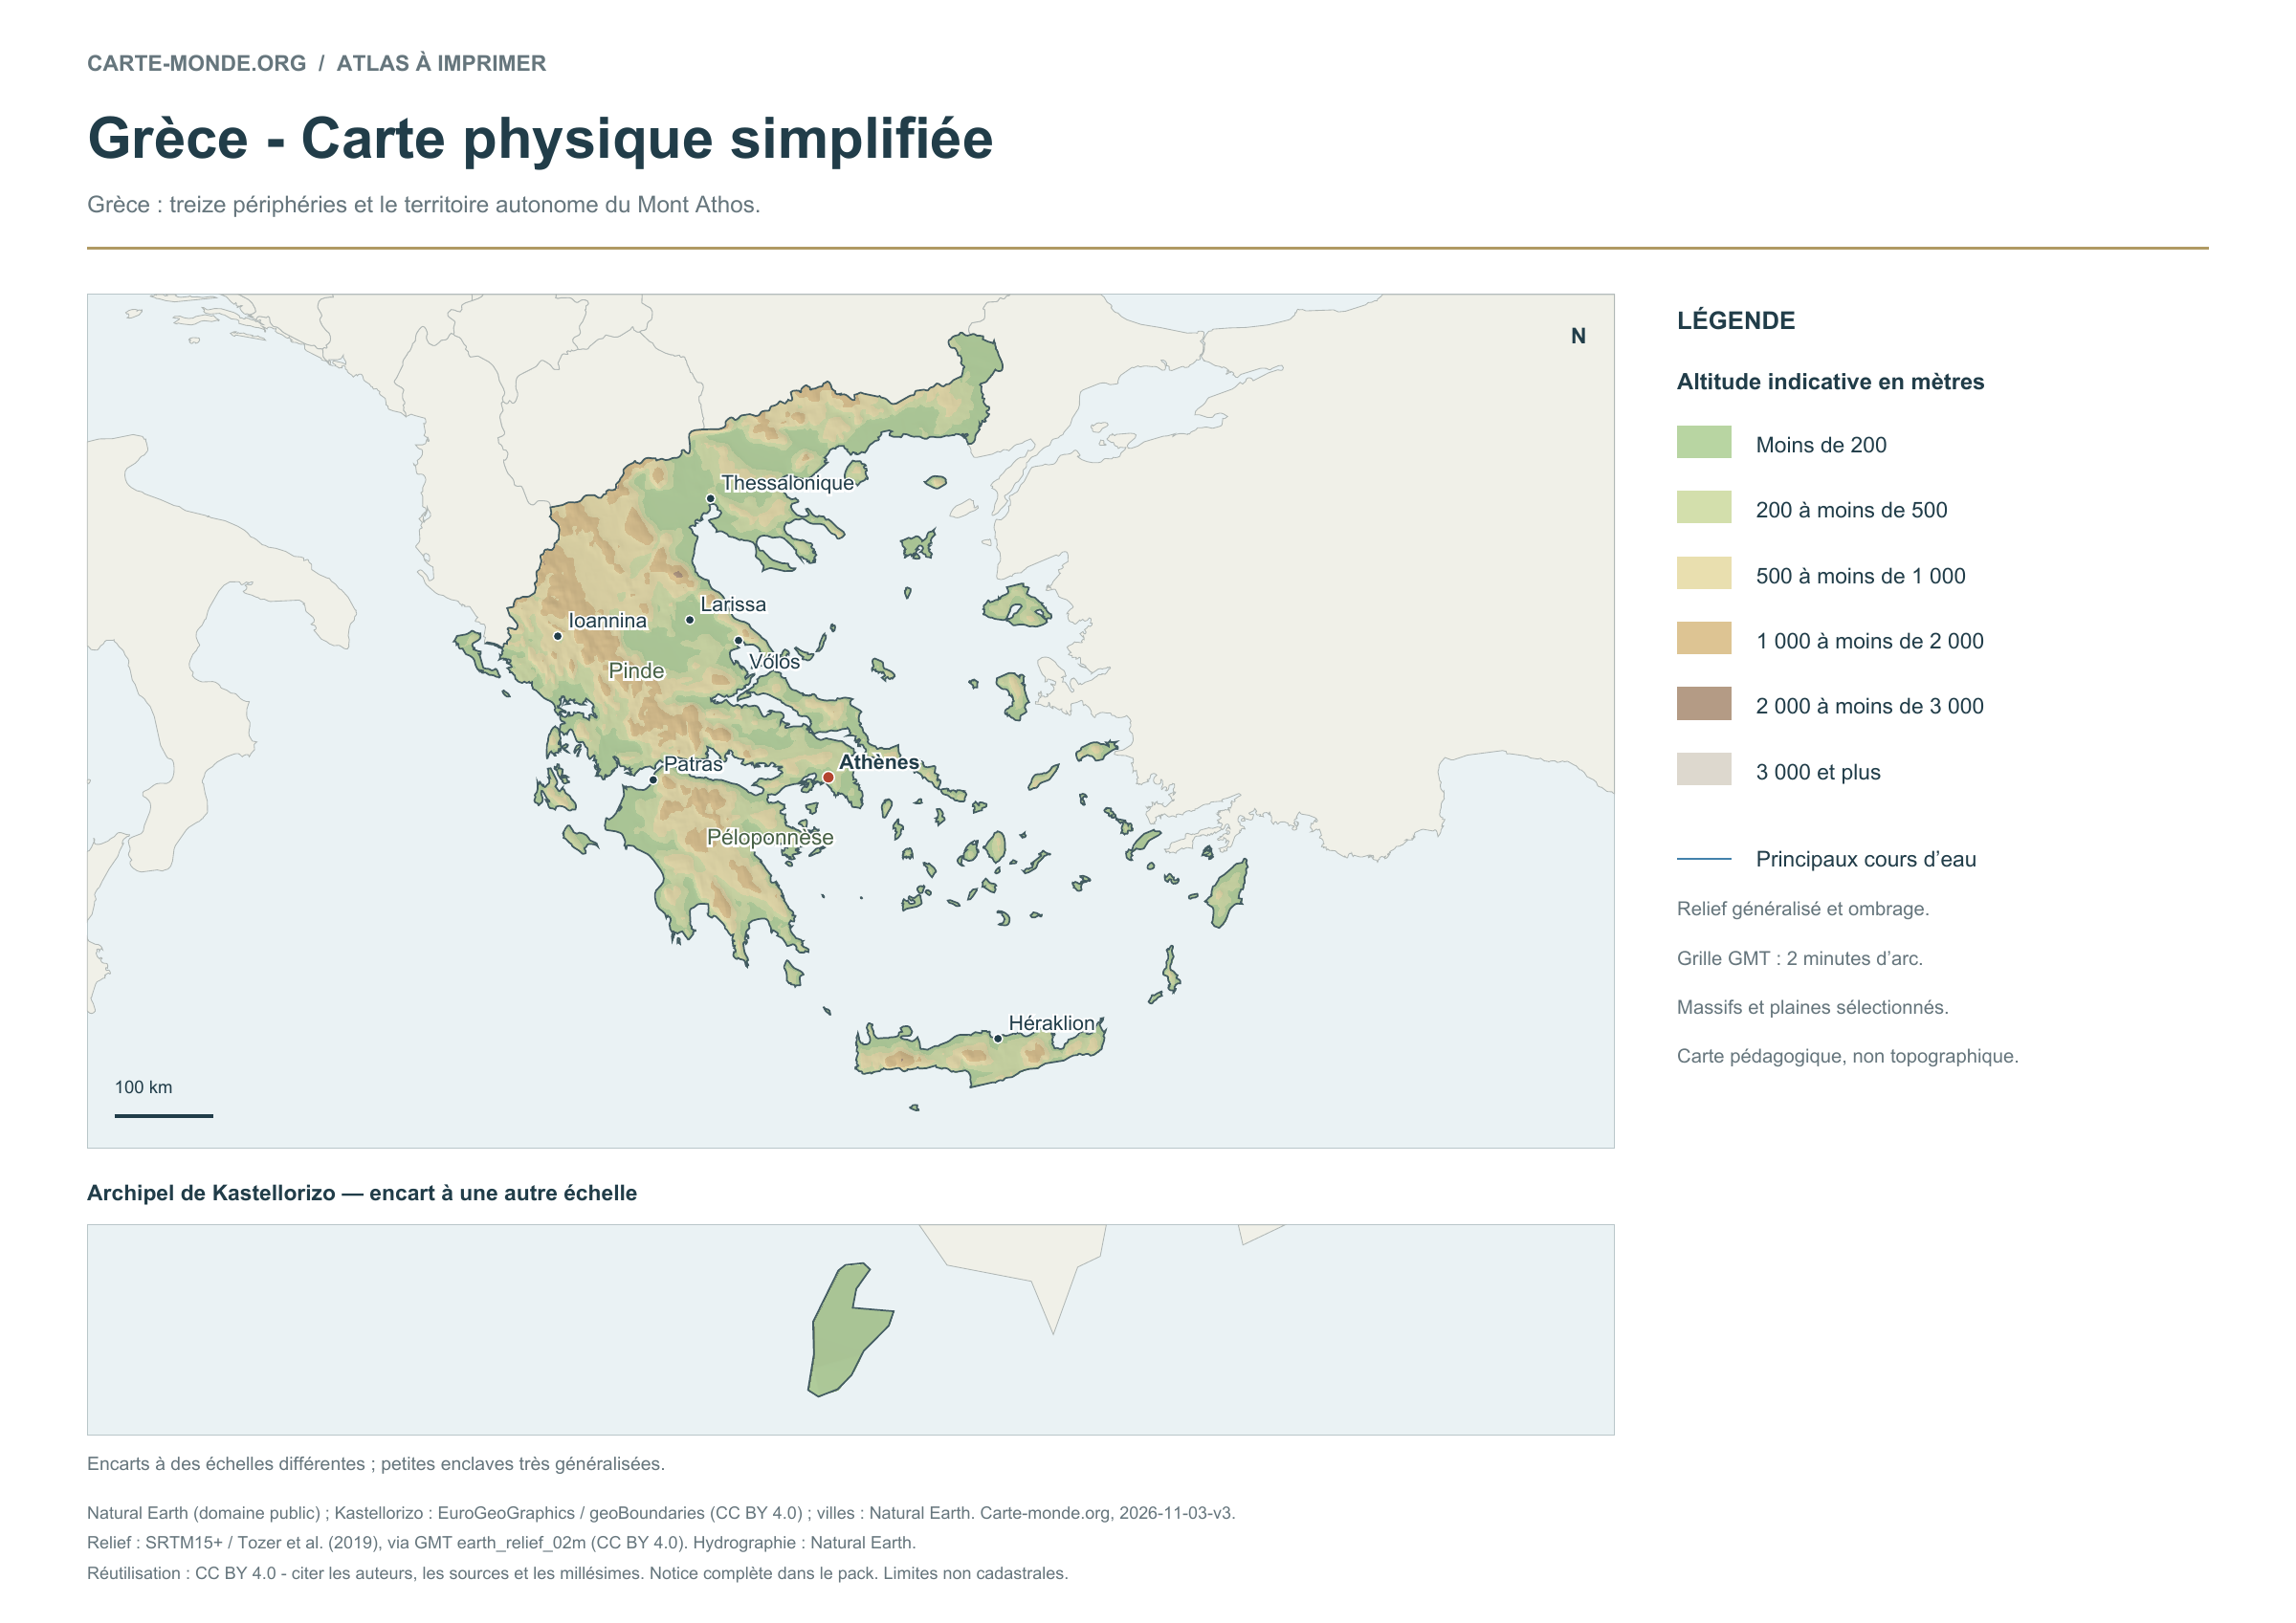
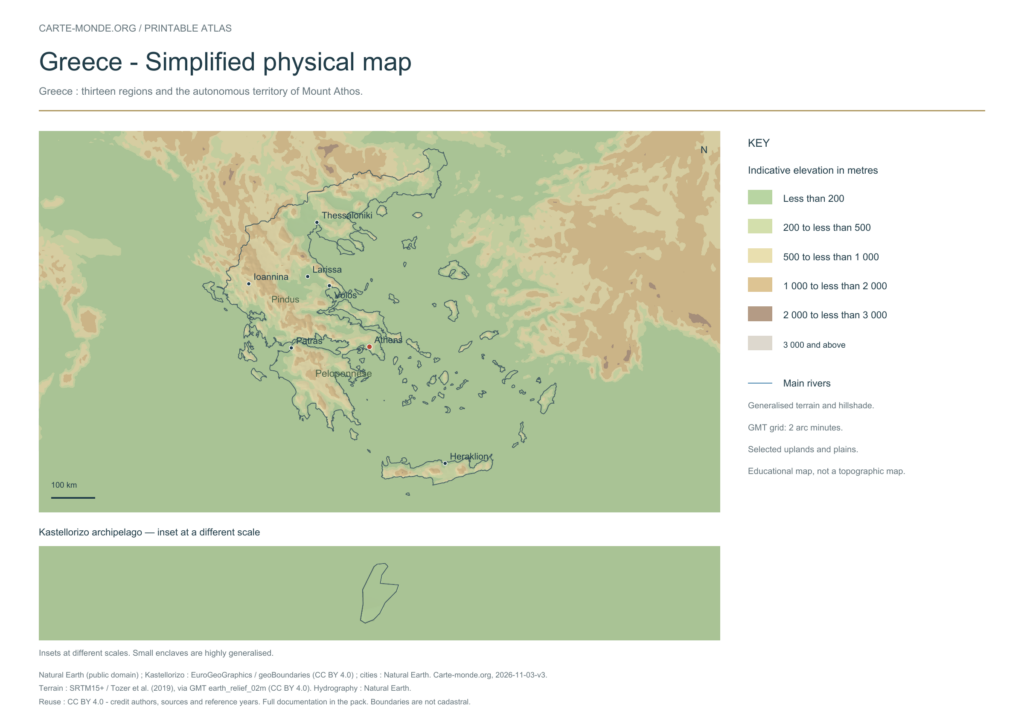
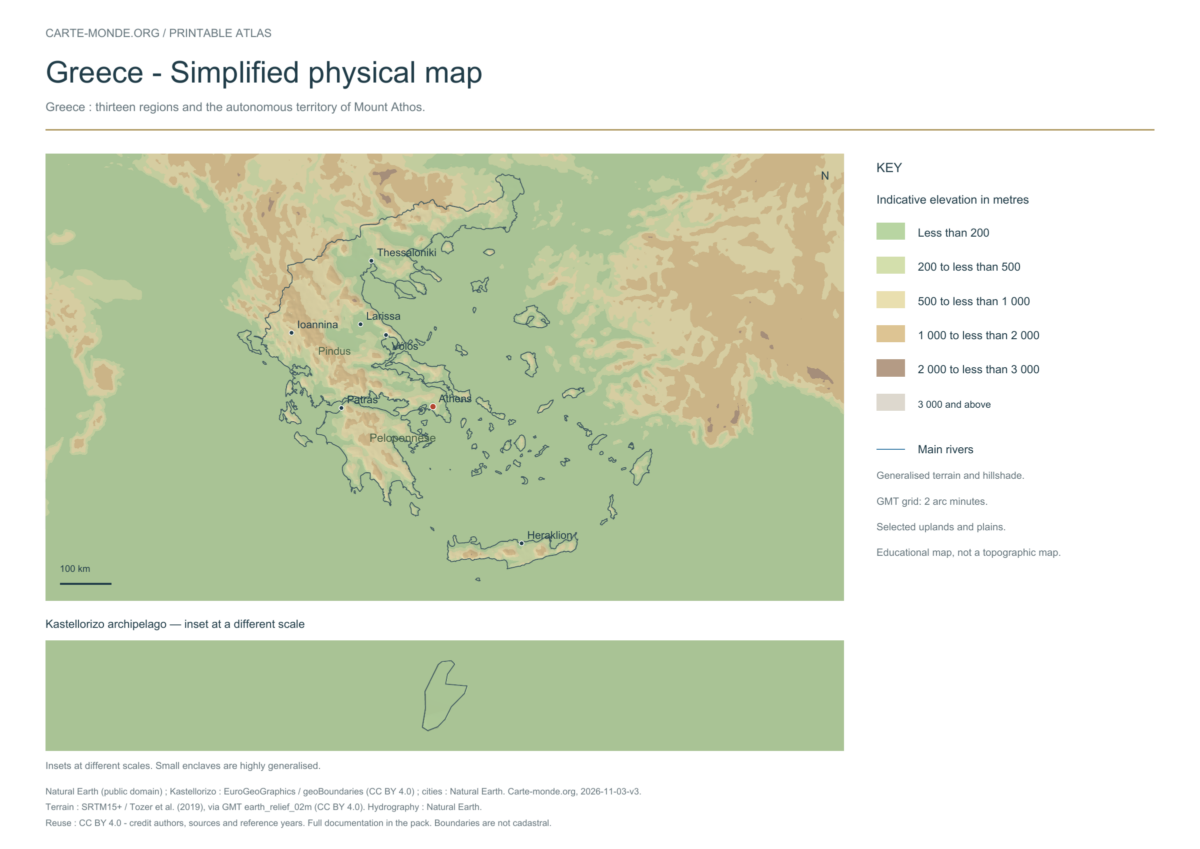
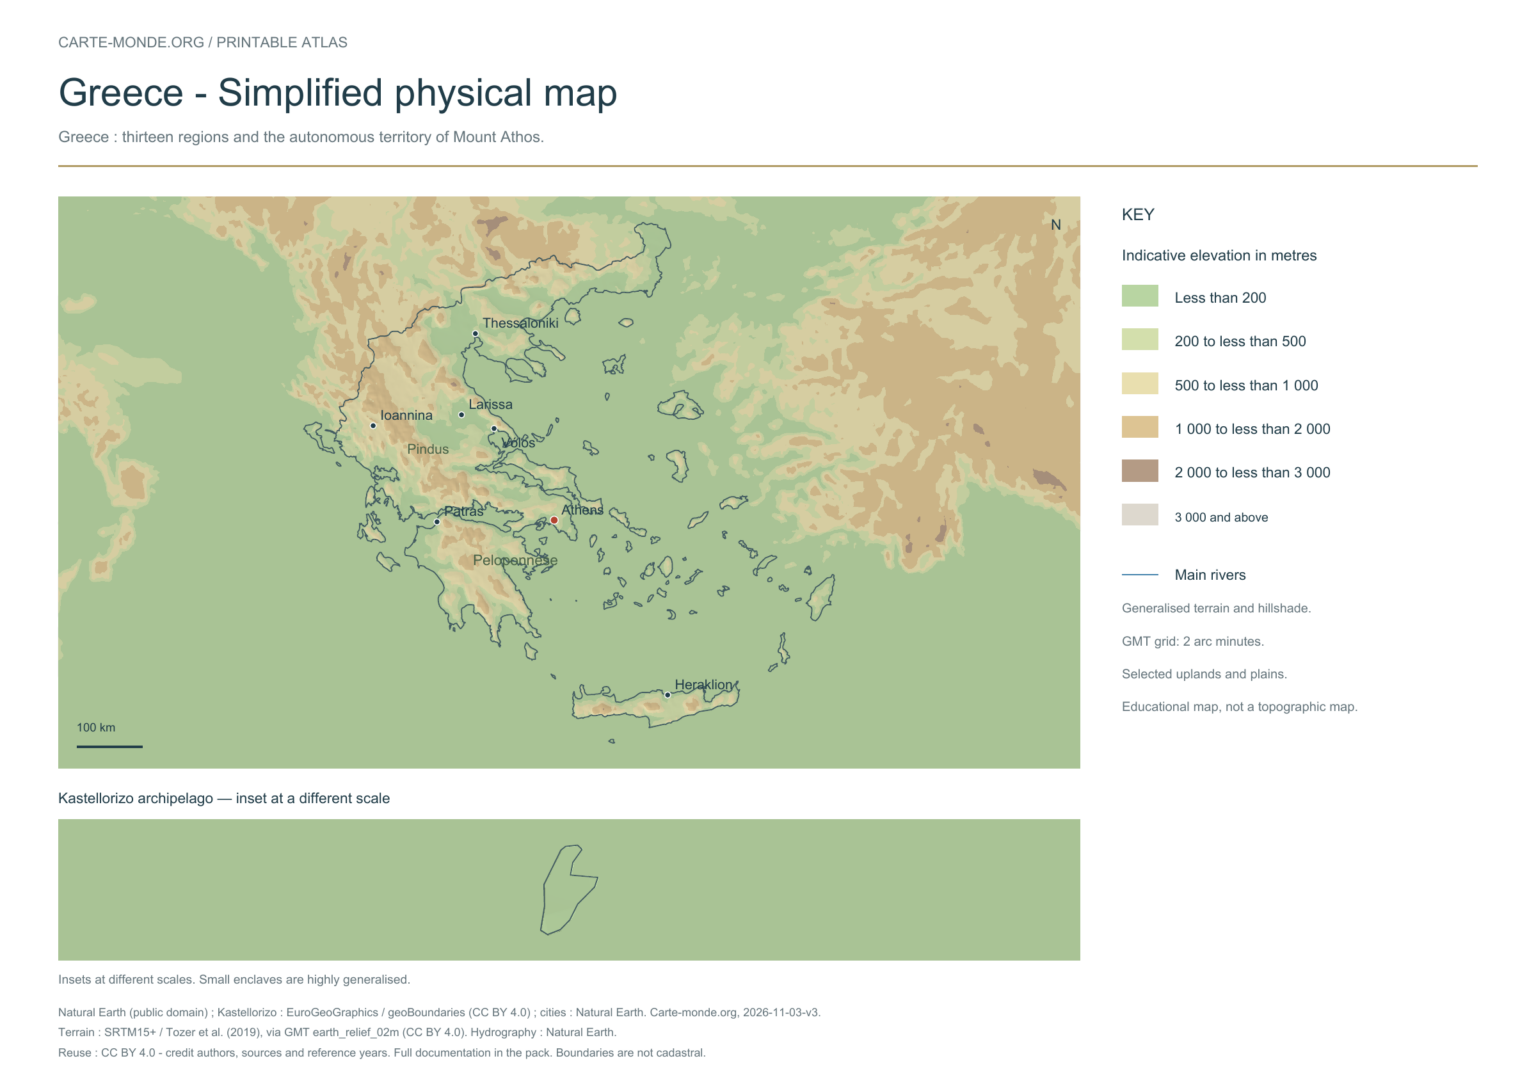
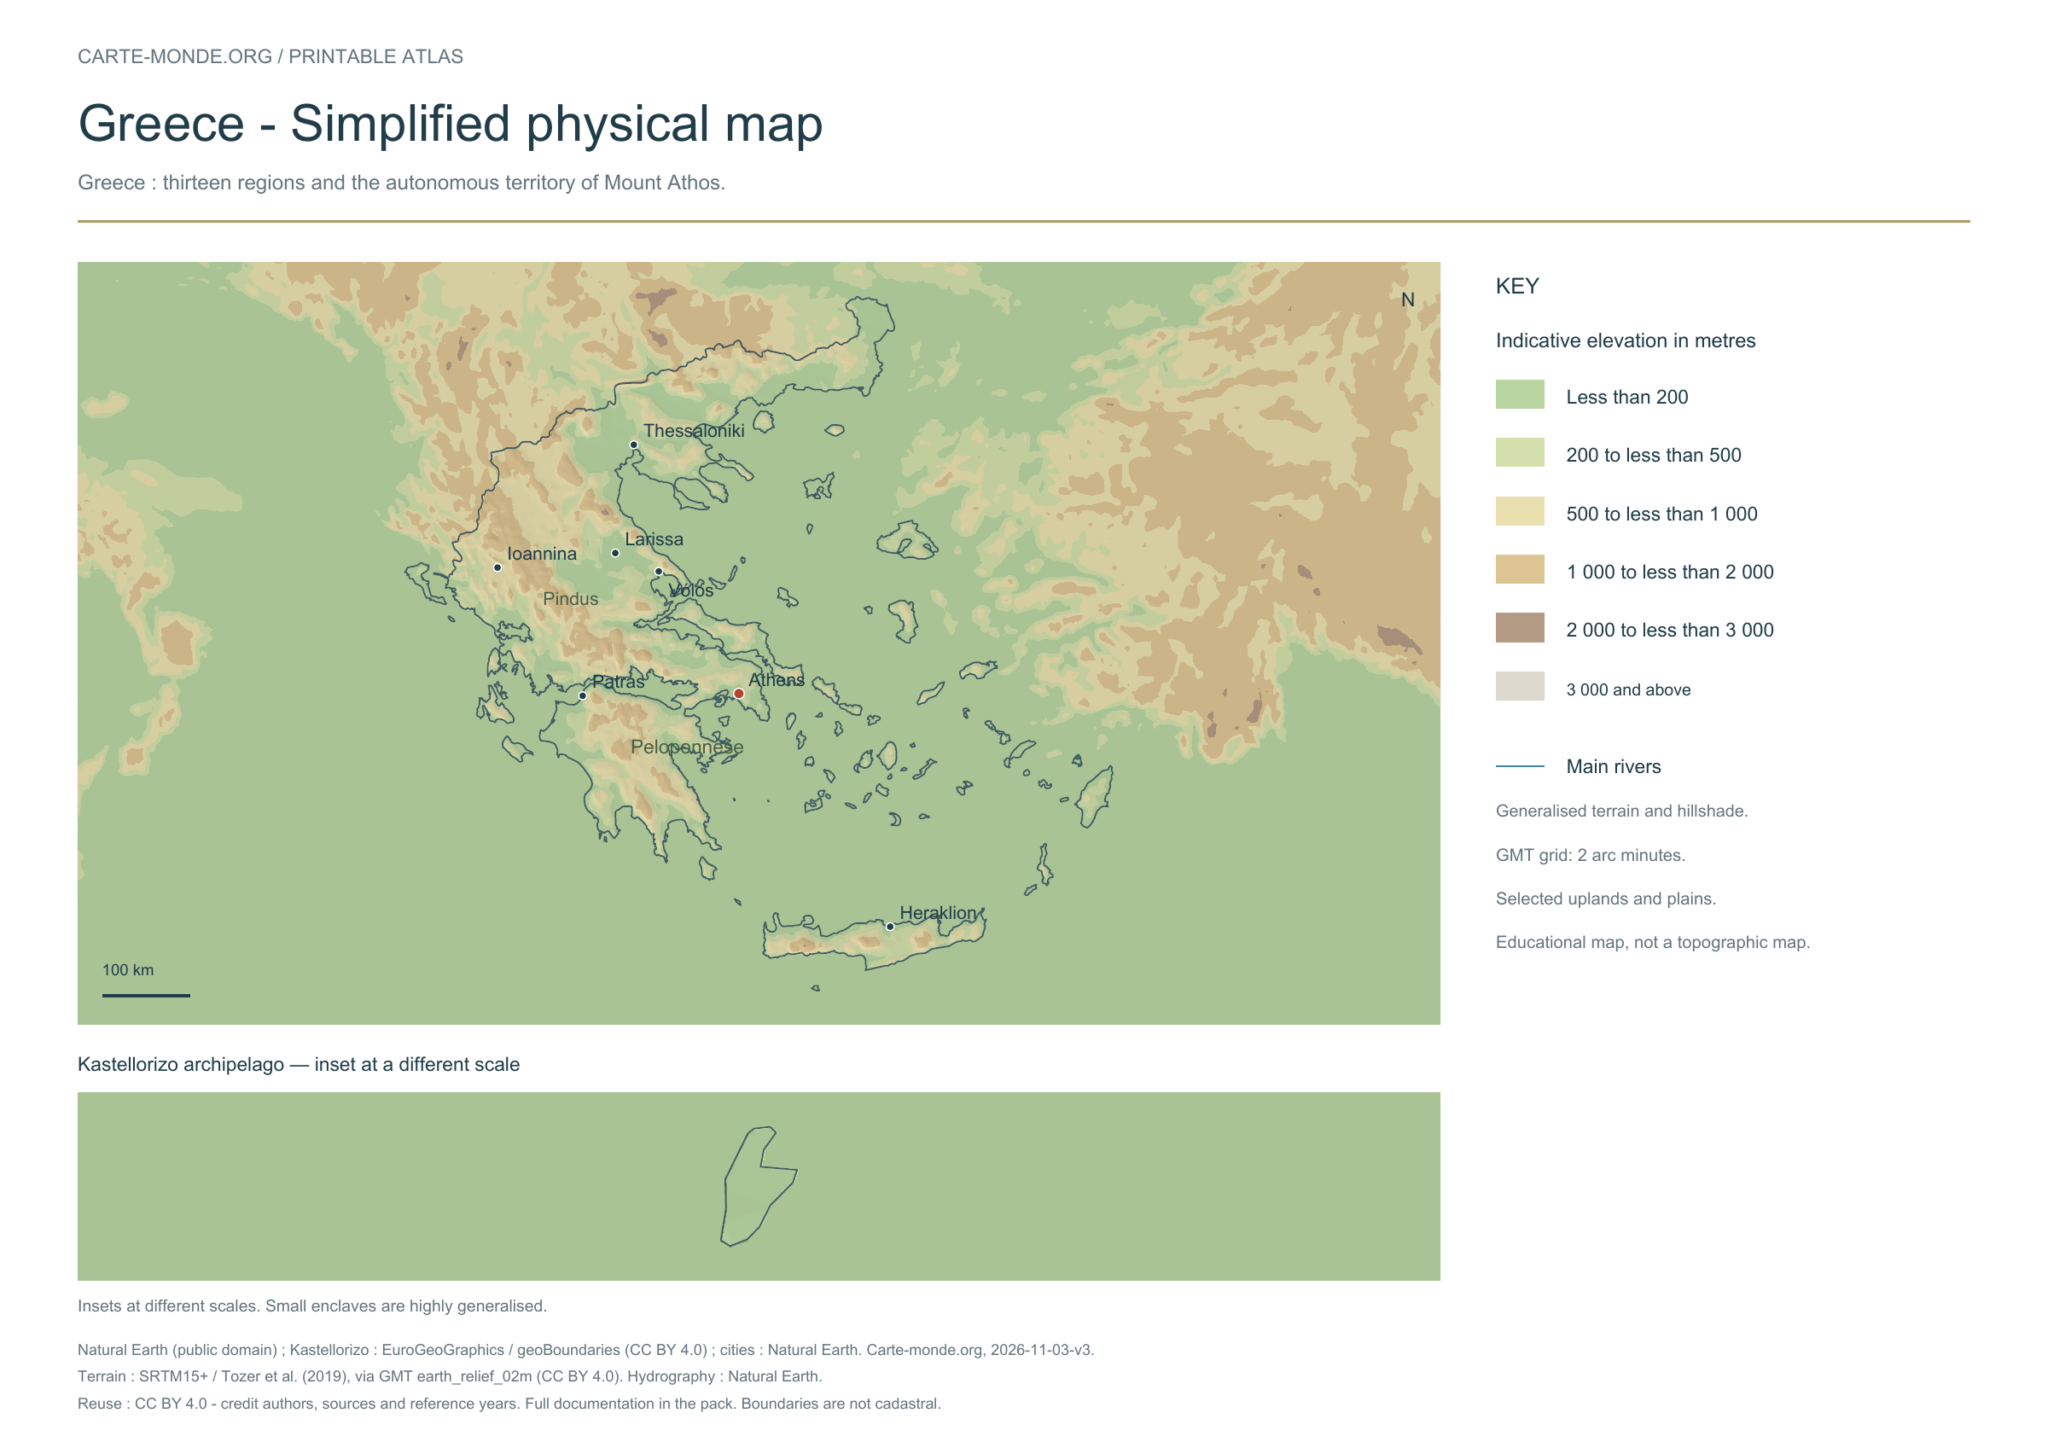
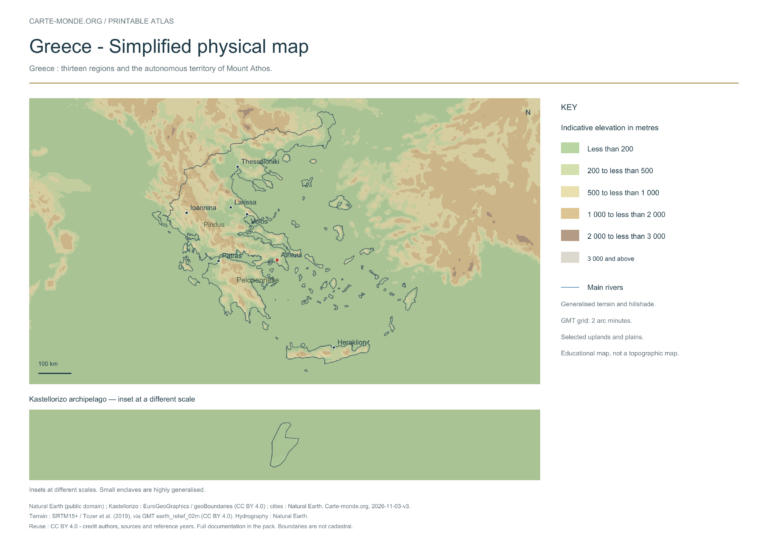
Simplified physical map — Greece

Carte-monde.org · November 2026

Simplified elevations

Smoothed relief, elevation colours, main mountain ranges, plains and watercourses. Educational map at national scale.

A4 landscape PDF · PNG 2 400 px · CC BY 4.0

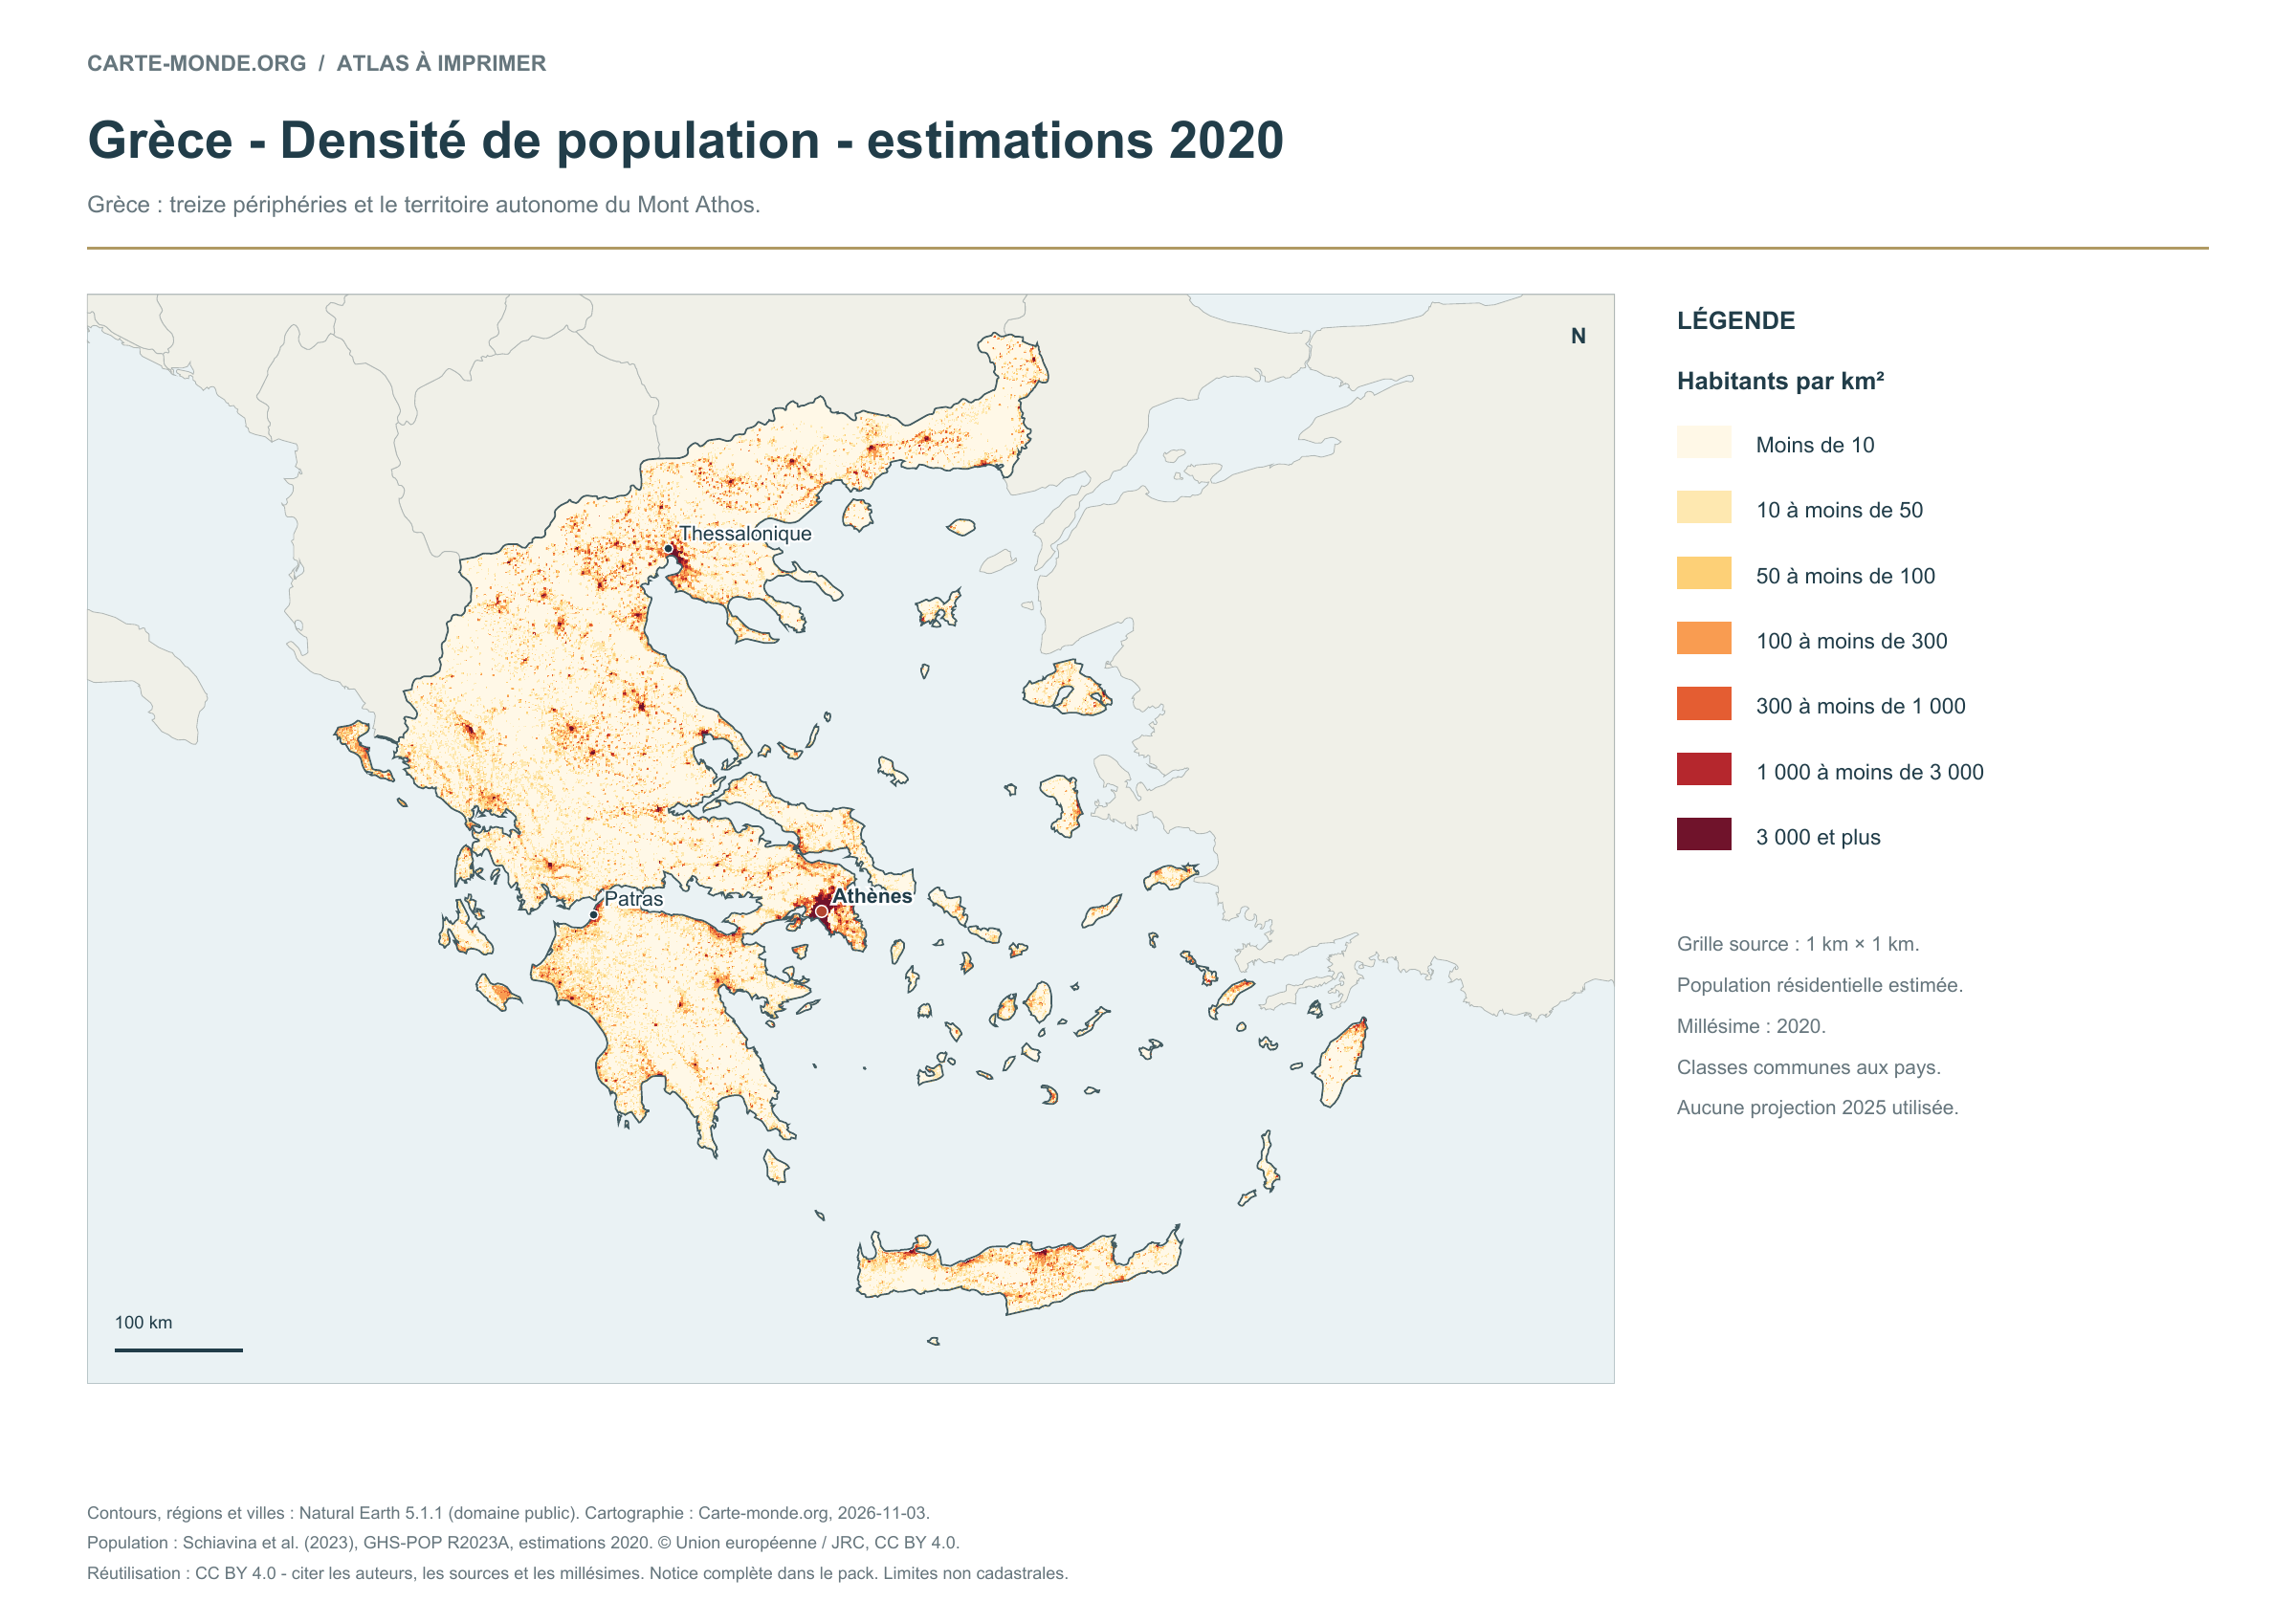
Population density: 2020 estimates

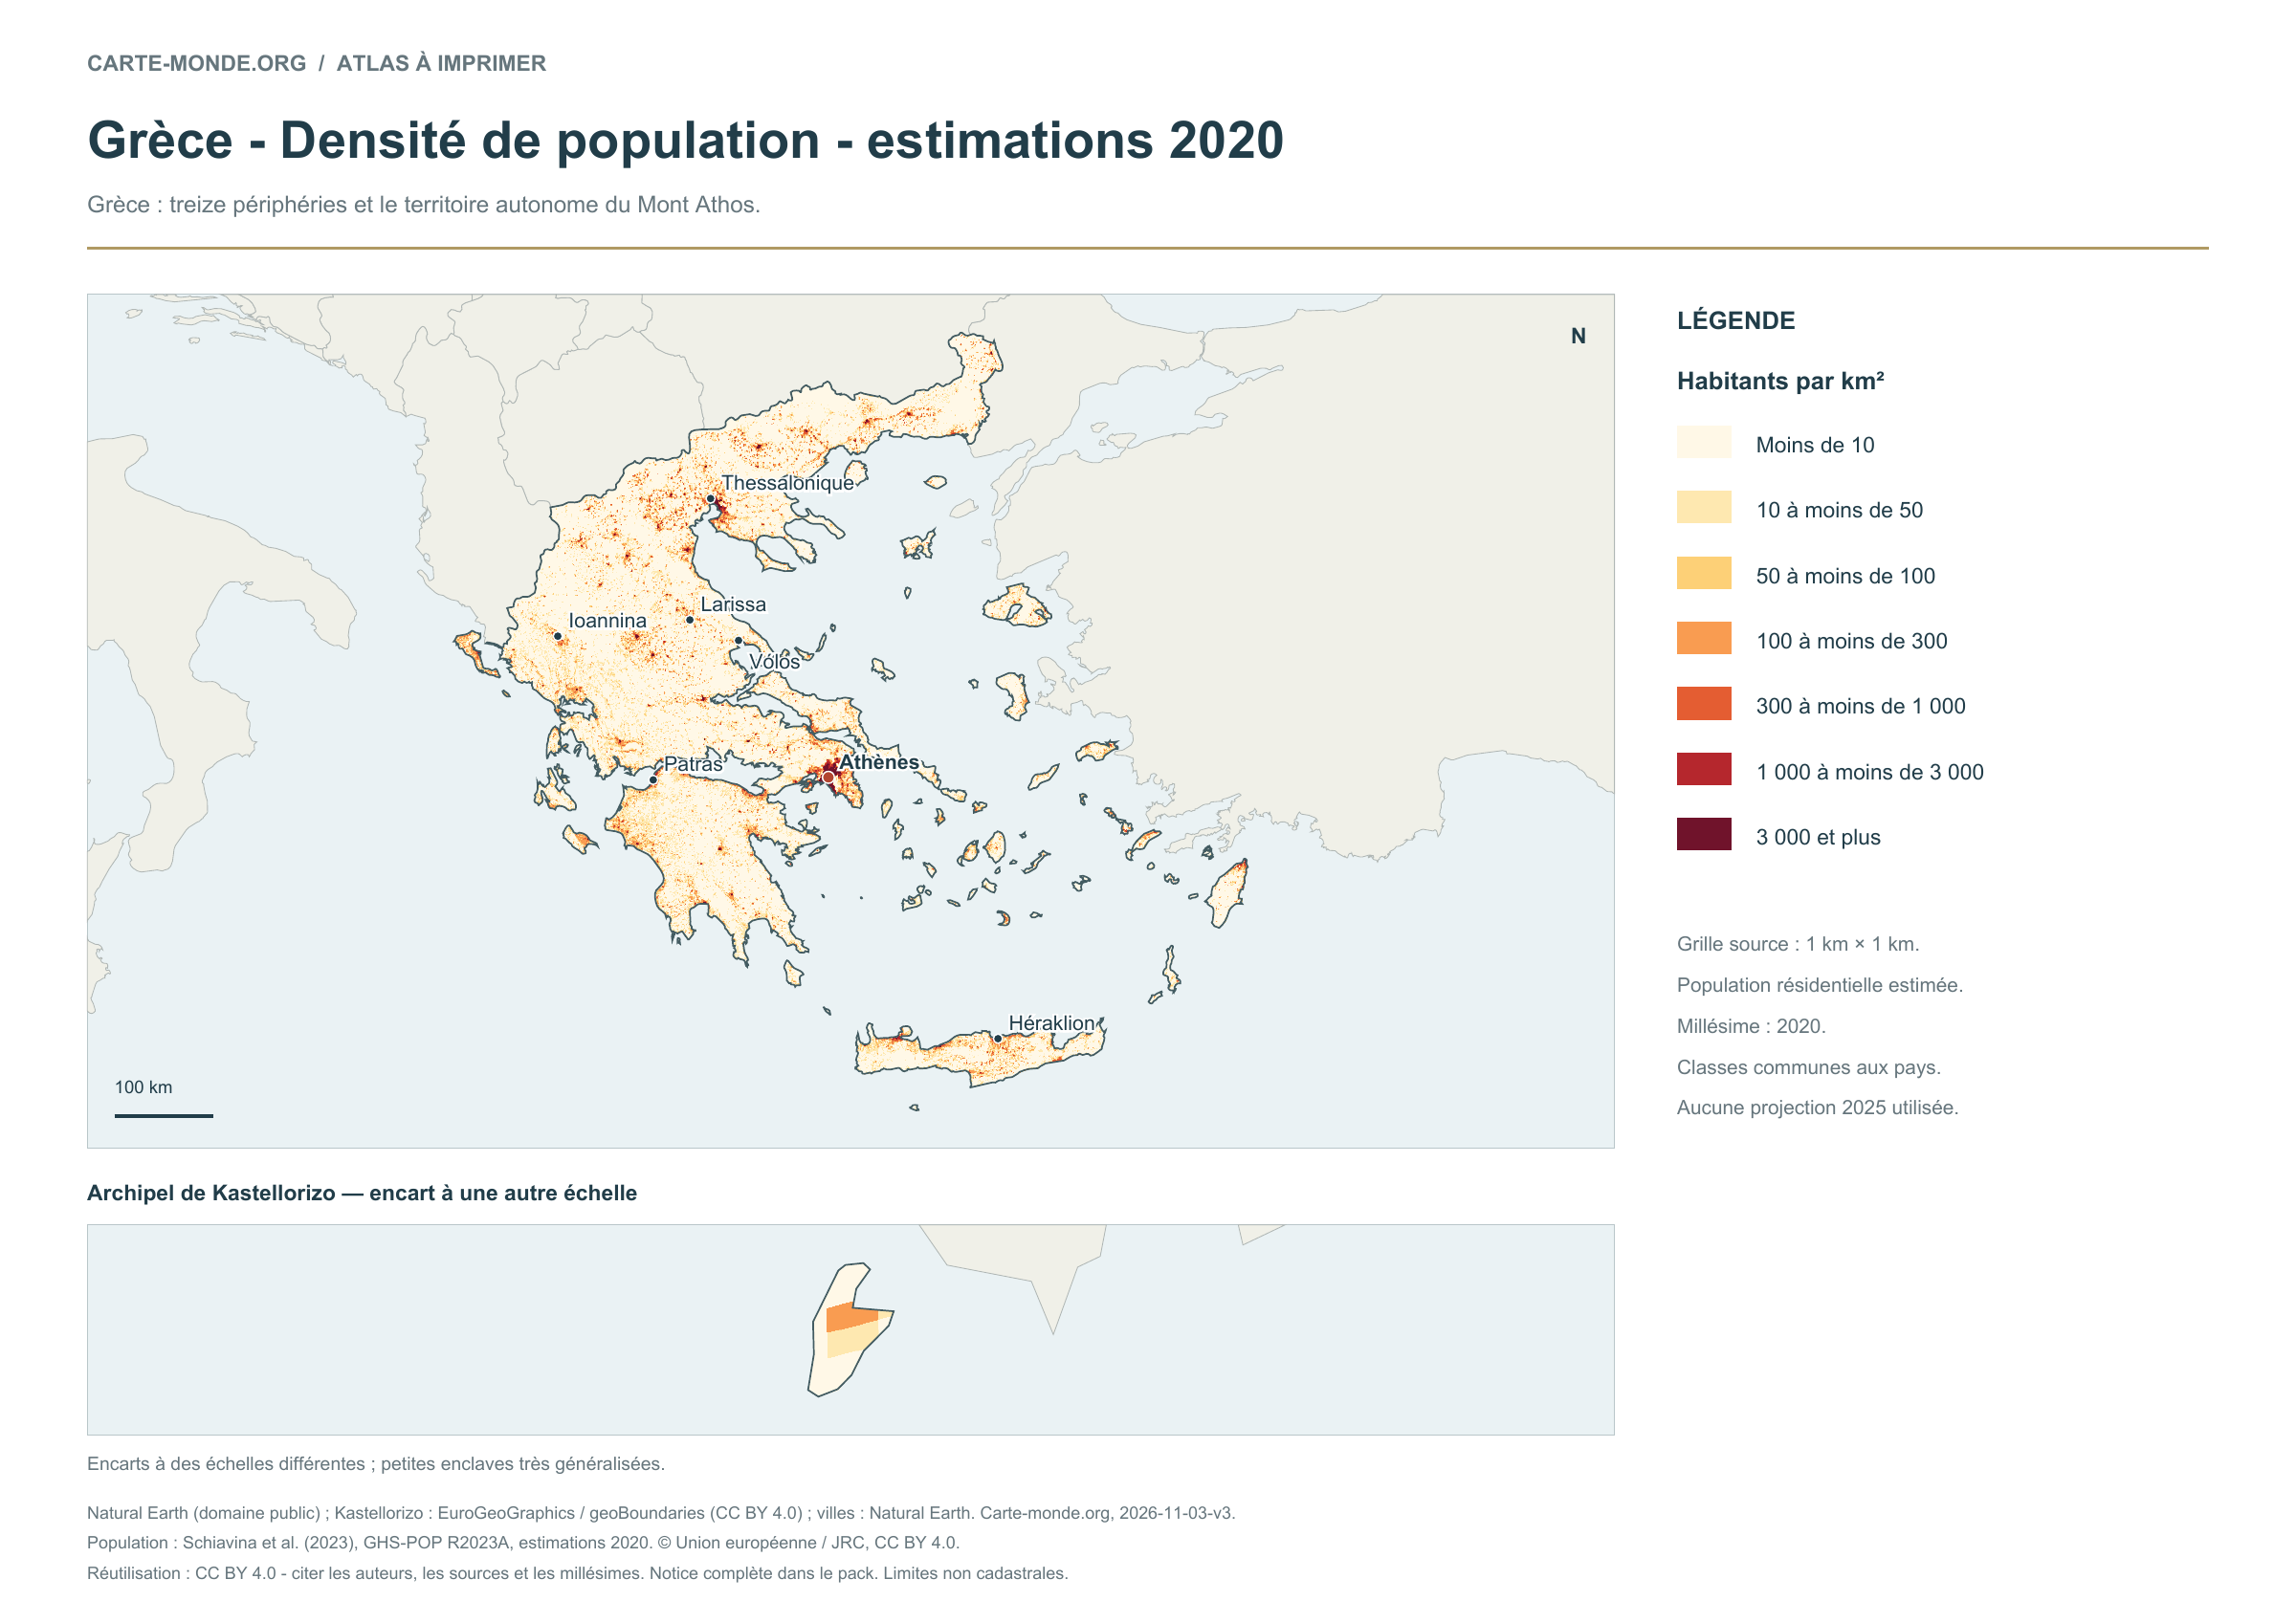
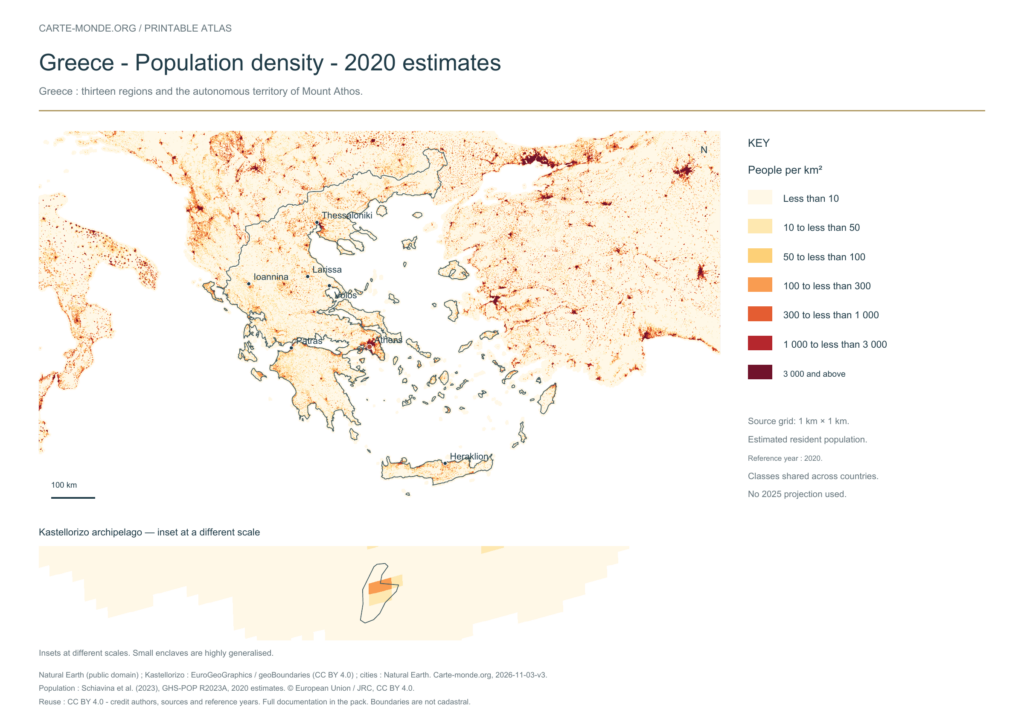
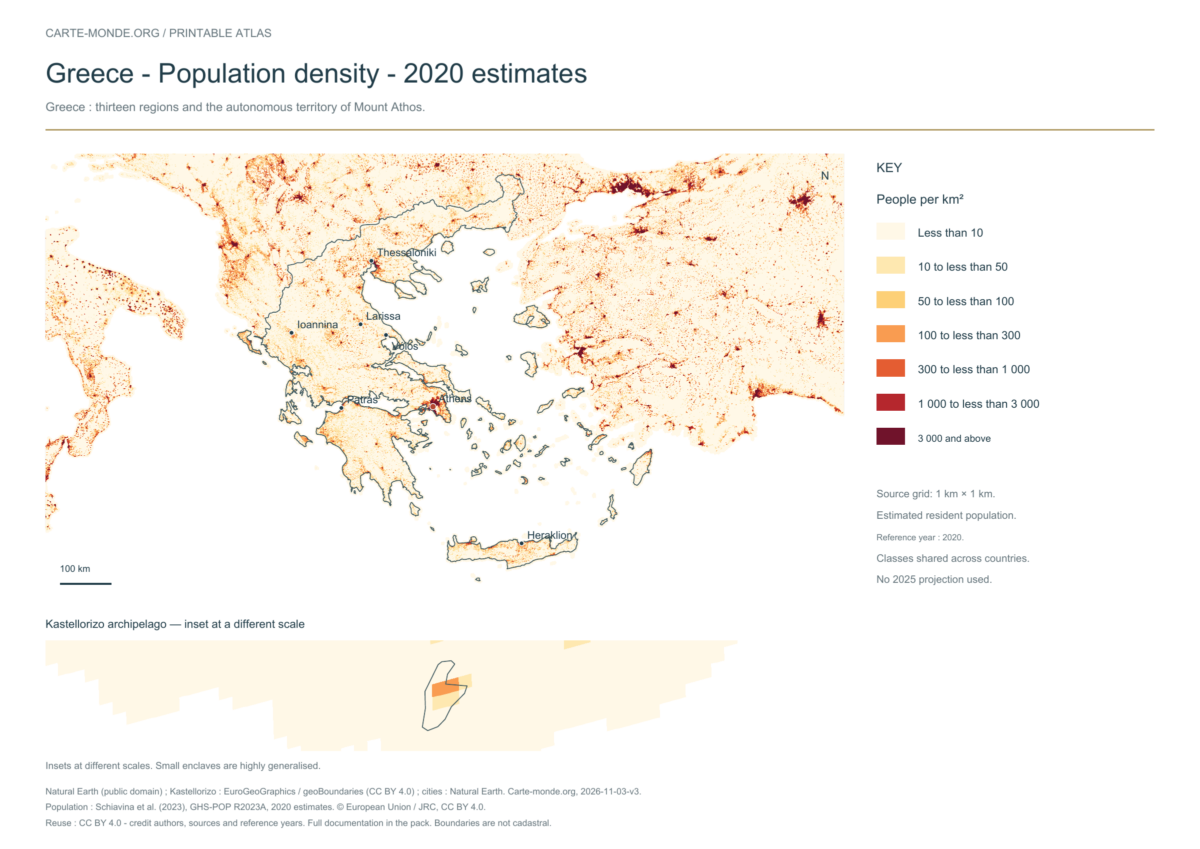
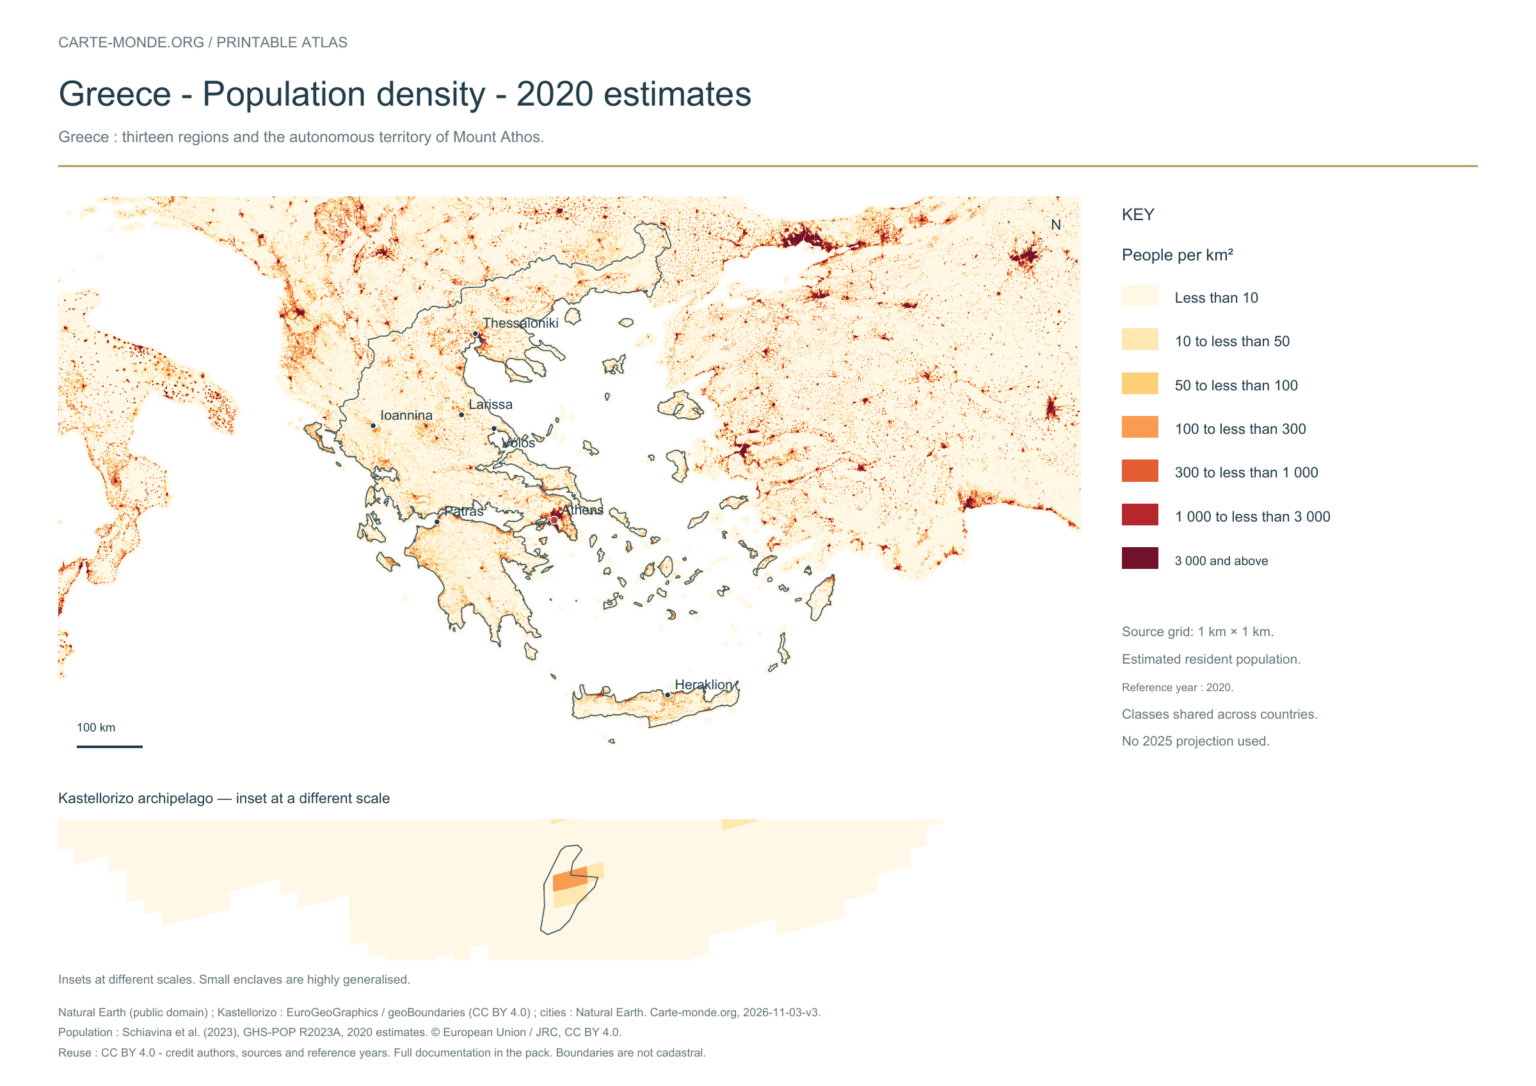
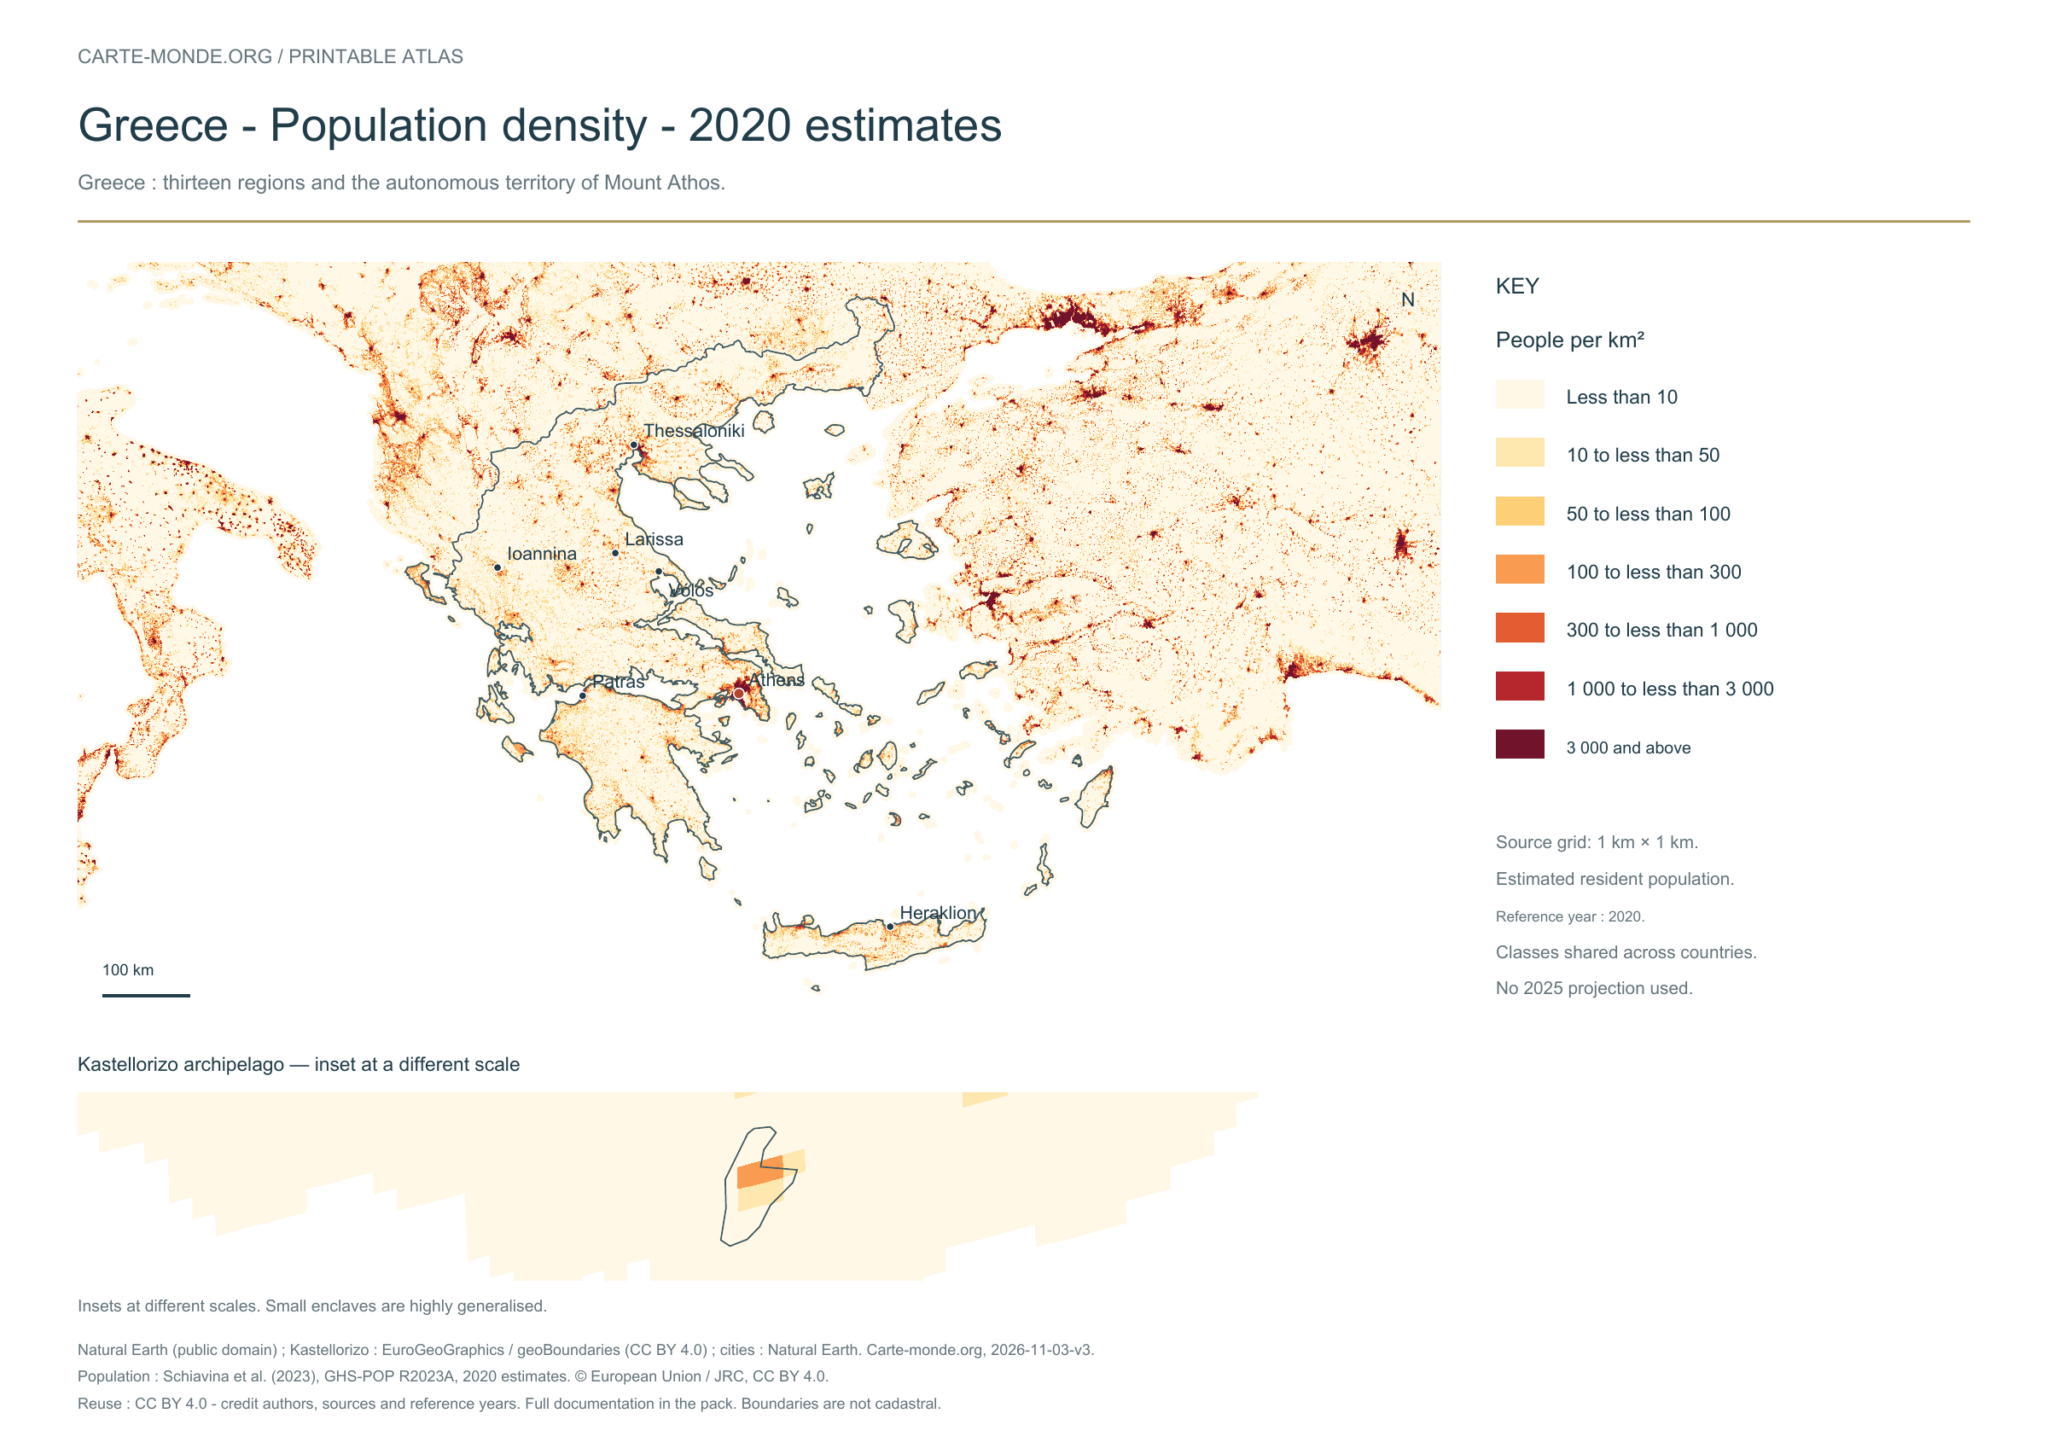
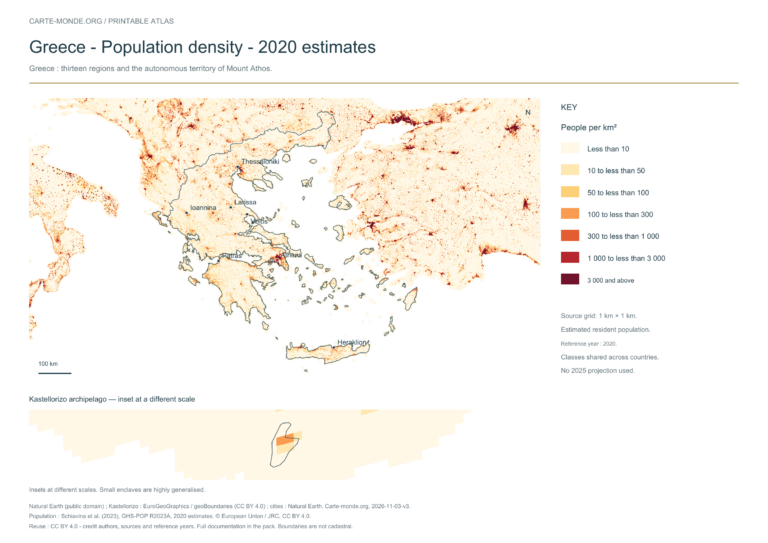
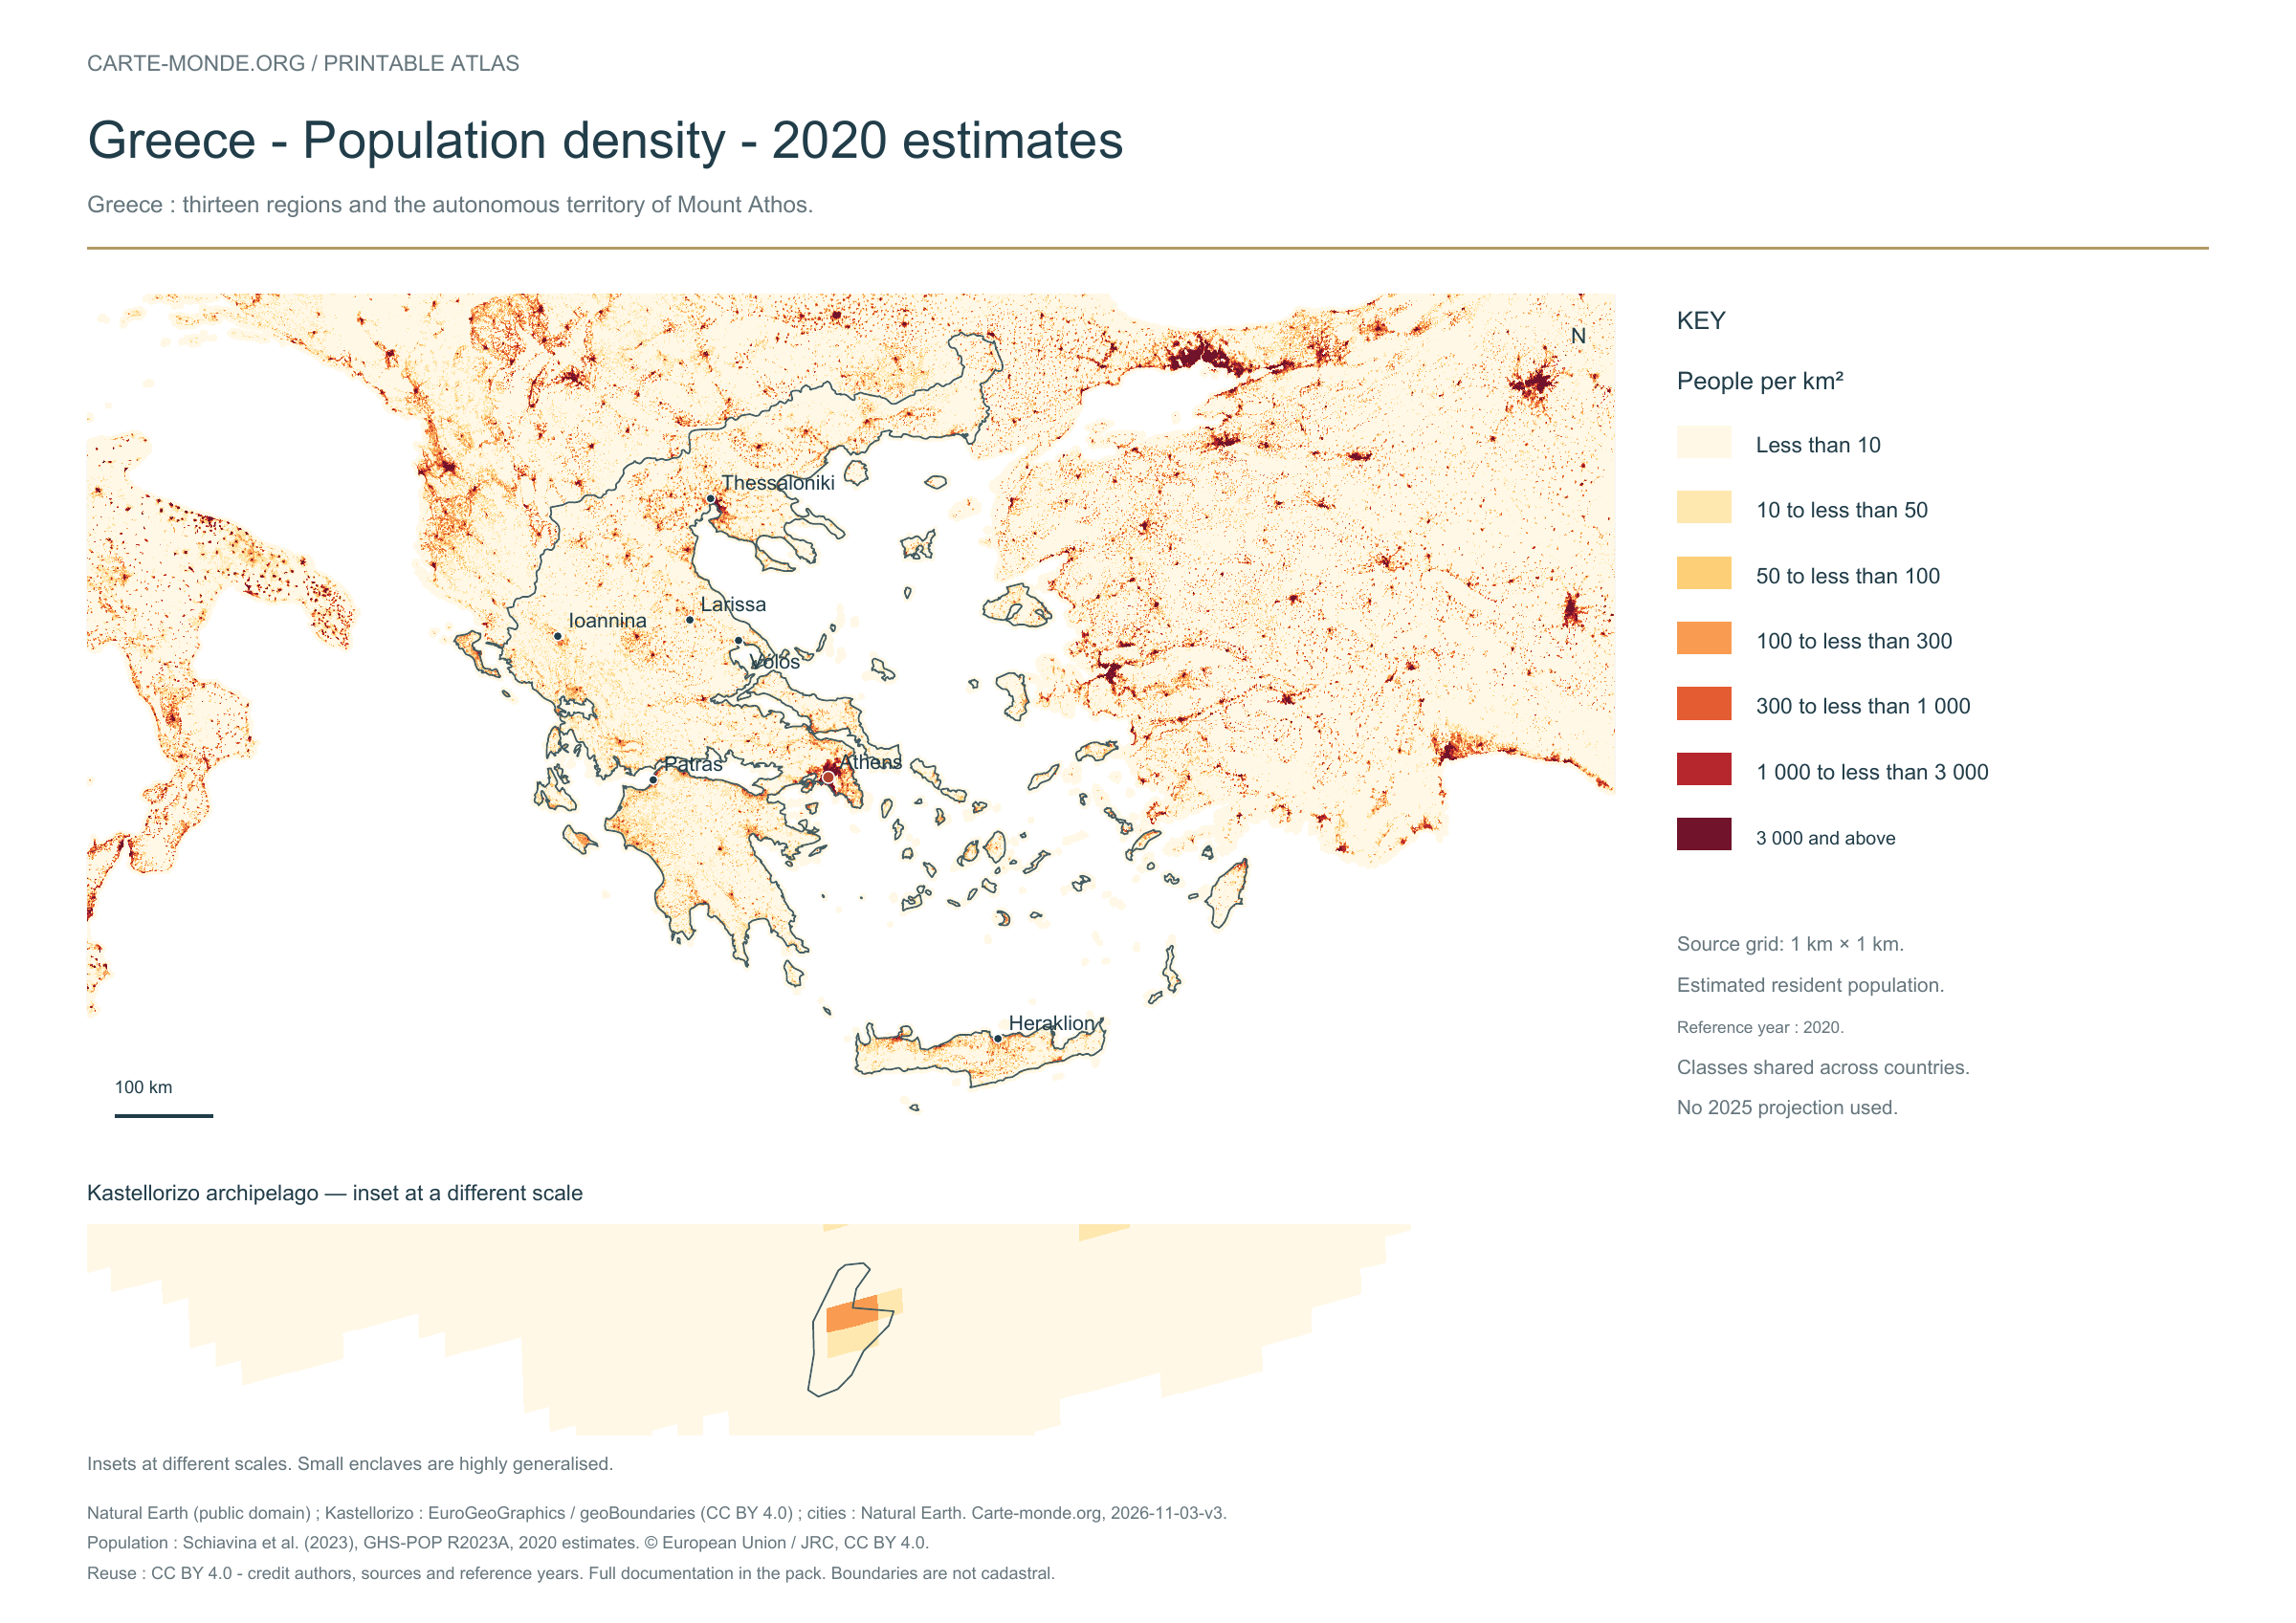
Population density — 2020 estimates — Greece

Carte-monde.org · November 2026

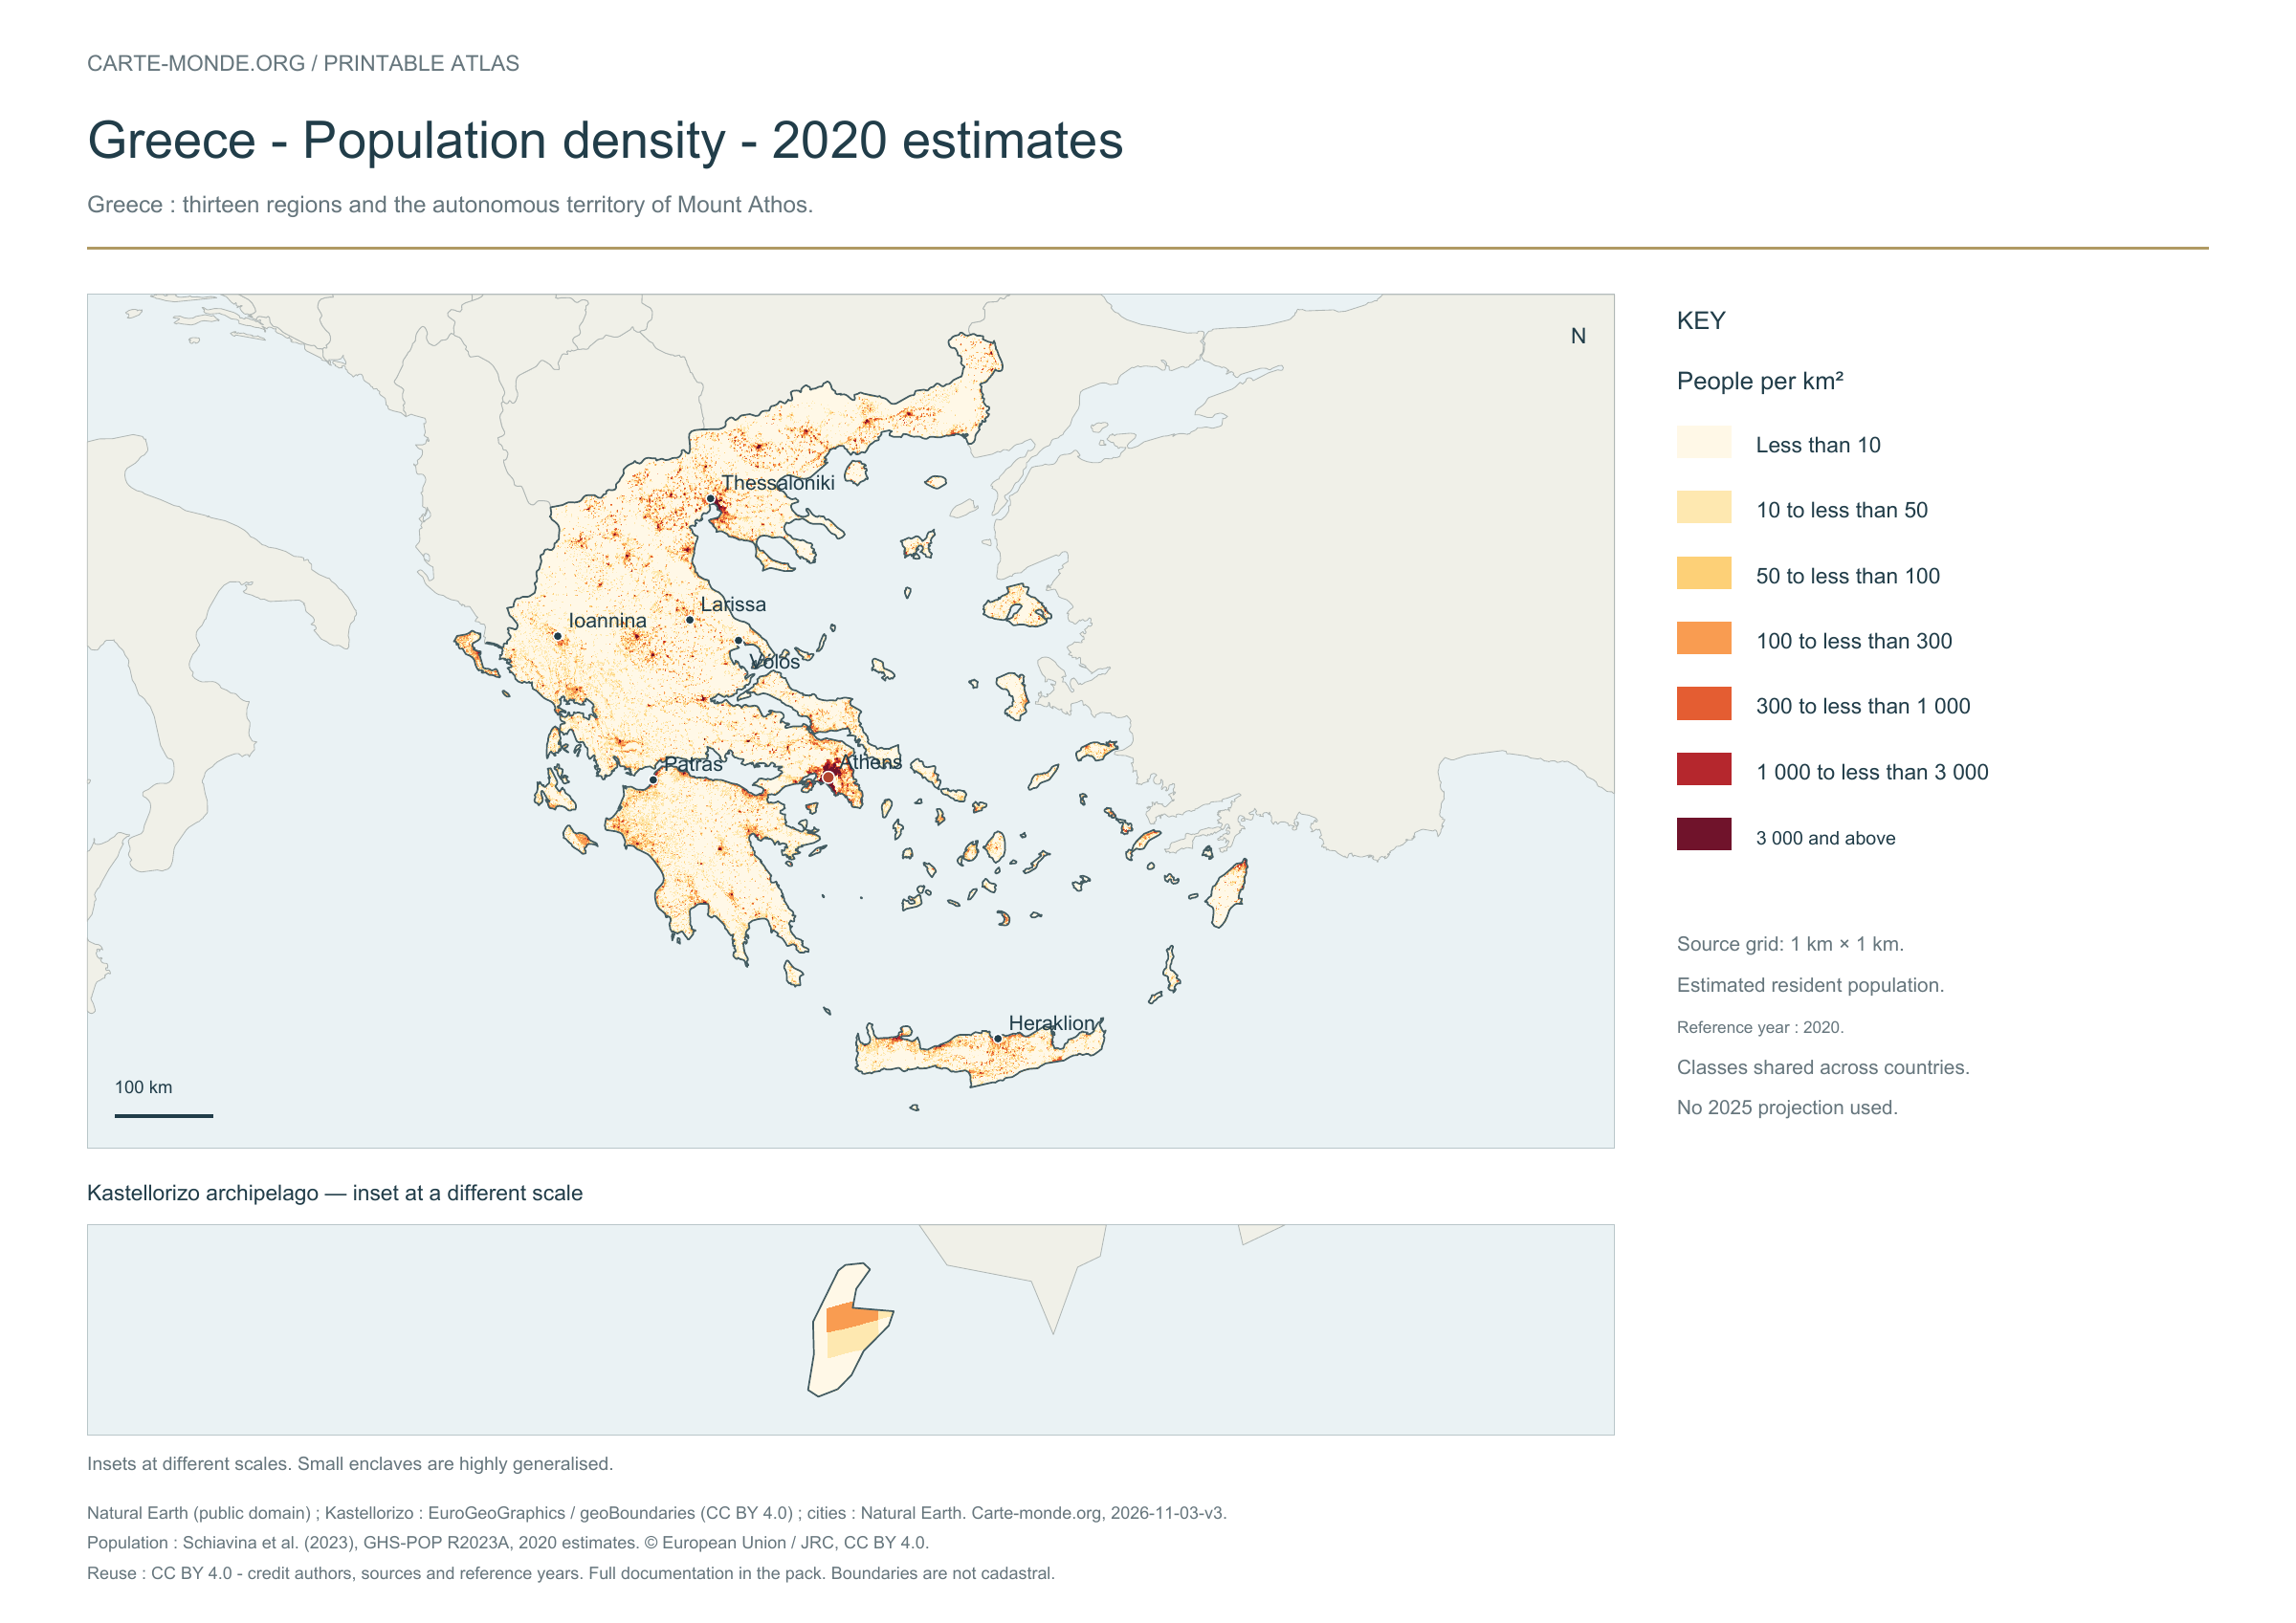
Population density — 2020 estimates

Estimated residential population in 2020, on a source grid of 1 km². Inhabitants/km² classes are shared across countries; no 2025 projection.

A4 landscape PDF · PNG 2 400 px · CC BY 4.0

The data represents estimated residential population in 2020, on a 1 km² source grid. The document’s creation date does not change this reference year.

The five in-house maps in one pack

Regions and cities, location in Europe, simplified elevations, 2020 population density and shaded relief: five A4 PDFs, their PNGs and SVGs, with sources and licences.

Download the five maps — ZIP
Previous edition packs

The four maps in one pack

Four A4 PDFs, their PNGs and SVGs, with full notes. Terrain and density use an embedded image background; text and linework remain vector-based.

Download the Greece pack — ZIP

Additional reference maps — CIA collection

Older documents in English provided by the University of Texas’s Perry–Castañeda collection. The links open the collection page where you can choose the indicated map. The dates below refer to the documents: these references do not necessarily describe the current situation.

Author: Central Intelligence Agency, except where otherwise stated on the document. Source: University of Texas Libraries. The collection states that most of its maps are in the public domain; retain these credits and check exceptions: reuse terms.

External references: no new file from this collection has been hosted on this site for this batch.

Find the old maps of Greece

Previously published maps remain accessible at their original URLs, with the collection’s text and credits.

Open the old maps of Greece

Choose and print a map

Regions and cities show how the territory is organized; the location map places the country; terrain shows the main natural regions; density shows population distribution. Print the in-house PDFs in A4 landscape with “Fit to page”. Insets have their own scales.

For exercises: six blank base maps of Greece.

Sources, reference years and reuse

Outlines, regions, cities and hydrography: Natural Earth 5.1.1, public domain. Generalized boundaries at 1:10 million, not cadastral; edition year 2026 does not mean that all geometries have been updated.

Relief: SRTM15+ / Tozer et al. (2019), reference publication, via GMT earth_relief_02m derived from SRTM15+V2.7. Grid smoothed to two arc minutes, suitable for a national overview, without topographic precision.

Population: Schiavina et al. (2023), GHS-POP R2023A, 2020 residential estimates, © European Union / JRC, CC BY 4.0. The 1 km² Mollweide cells are expressed in inhabitants/km². Methodology: Pesaresi et al. (2024).

The four new maps: created by Carte-monde.org, November 2026, under CC BY 4.0. Cite authors, sources and reference years, and indicate adaptations. Additional and older maps retain their own rights.

Island supplement for Kastellorizo: EuroGeoGraphics, Regional IM Working Group – Europe / geoBoundaries GRC ADM2, reference year 2016, CC BY 4.0. The other boundaries still come from Natural Earth. The geometries and notes are included in the corrected pack.

Country maps · Other maps and archives

Previous versions: maps and files preserved

These files remain available at their original URLs. For corrected maps, use the main links above. Each edition retains its credits and date.

Raster base map, cities, rivers and lakes: Natural Earth, public domain. Other boundary credits and licences are retained in the pack. Cartographic work CC BY 4.0; ODbL-derived data retains its licence. No topographic accuracy is claimed.

Previous collection — original files preserved
Flag of Greece
Flag of Greece
Downloadable maps of Greece
Political map of Greece
Relief map of Greece
Original French files
Previous language edition

Maps of Hungary: regions, cities, relief and population

Flag of Hungary
Flag of Hungary

HUNGARY · PRINTABLE MAPS

Five printable maps of Hungary: regions and cities, location in Europe, two views of the relief and population. PDFs, images and sources are available below.

Our five maps have English labels. Maps from other publishers retain their original language.

Regions, cities and location in Europe

Hungary: 20 reference territorial units.

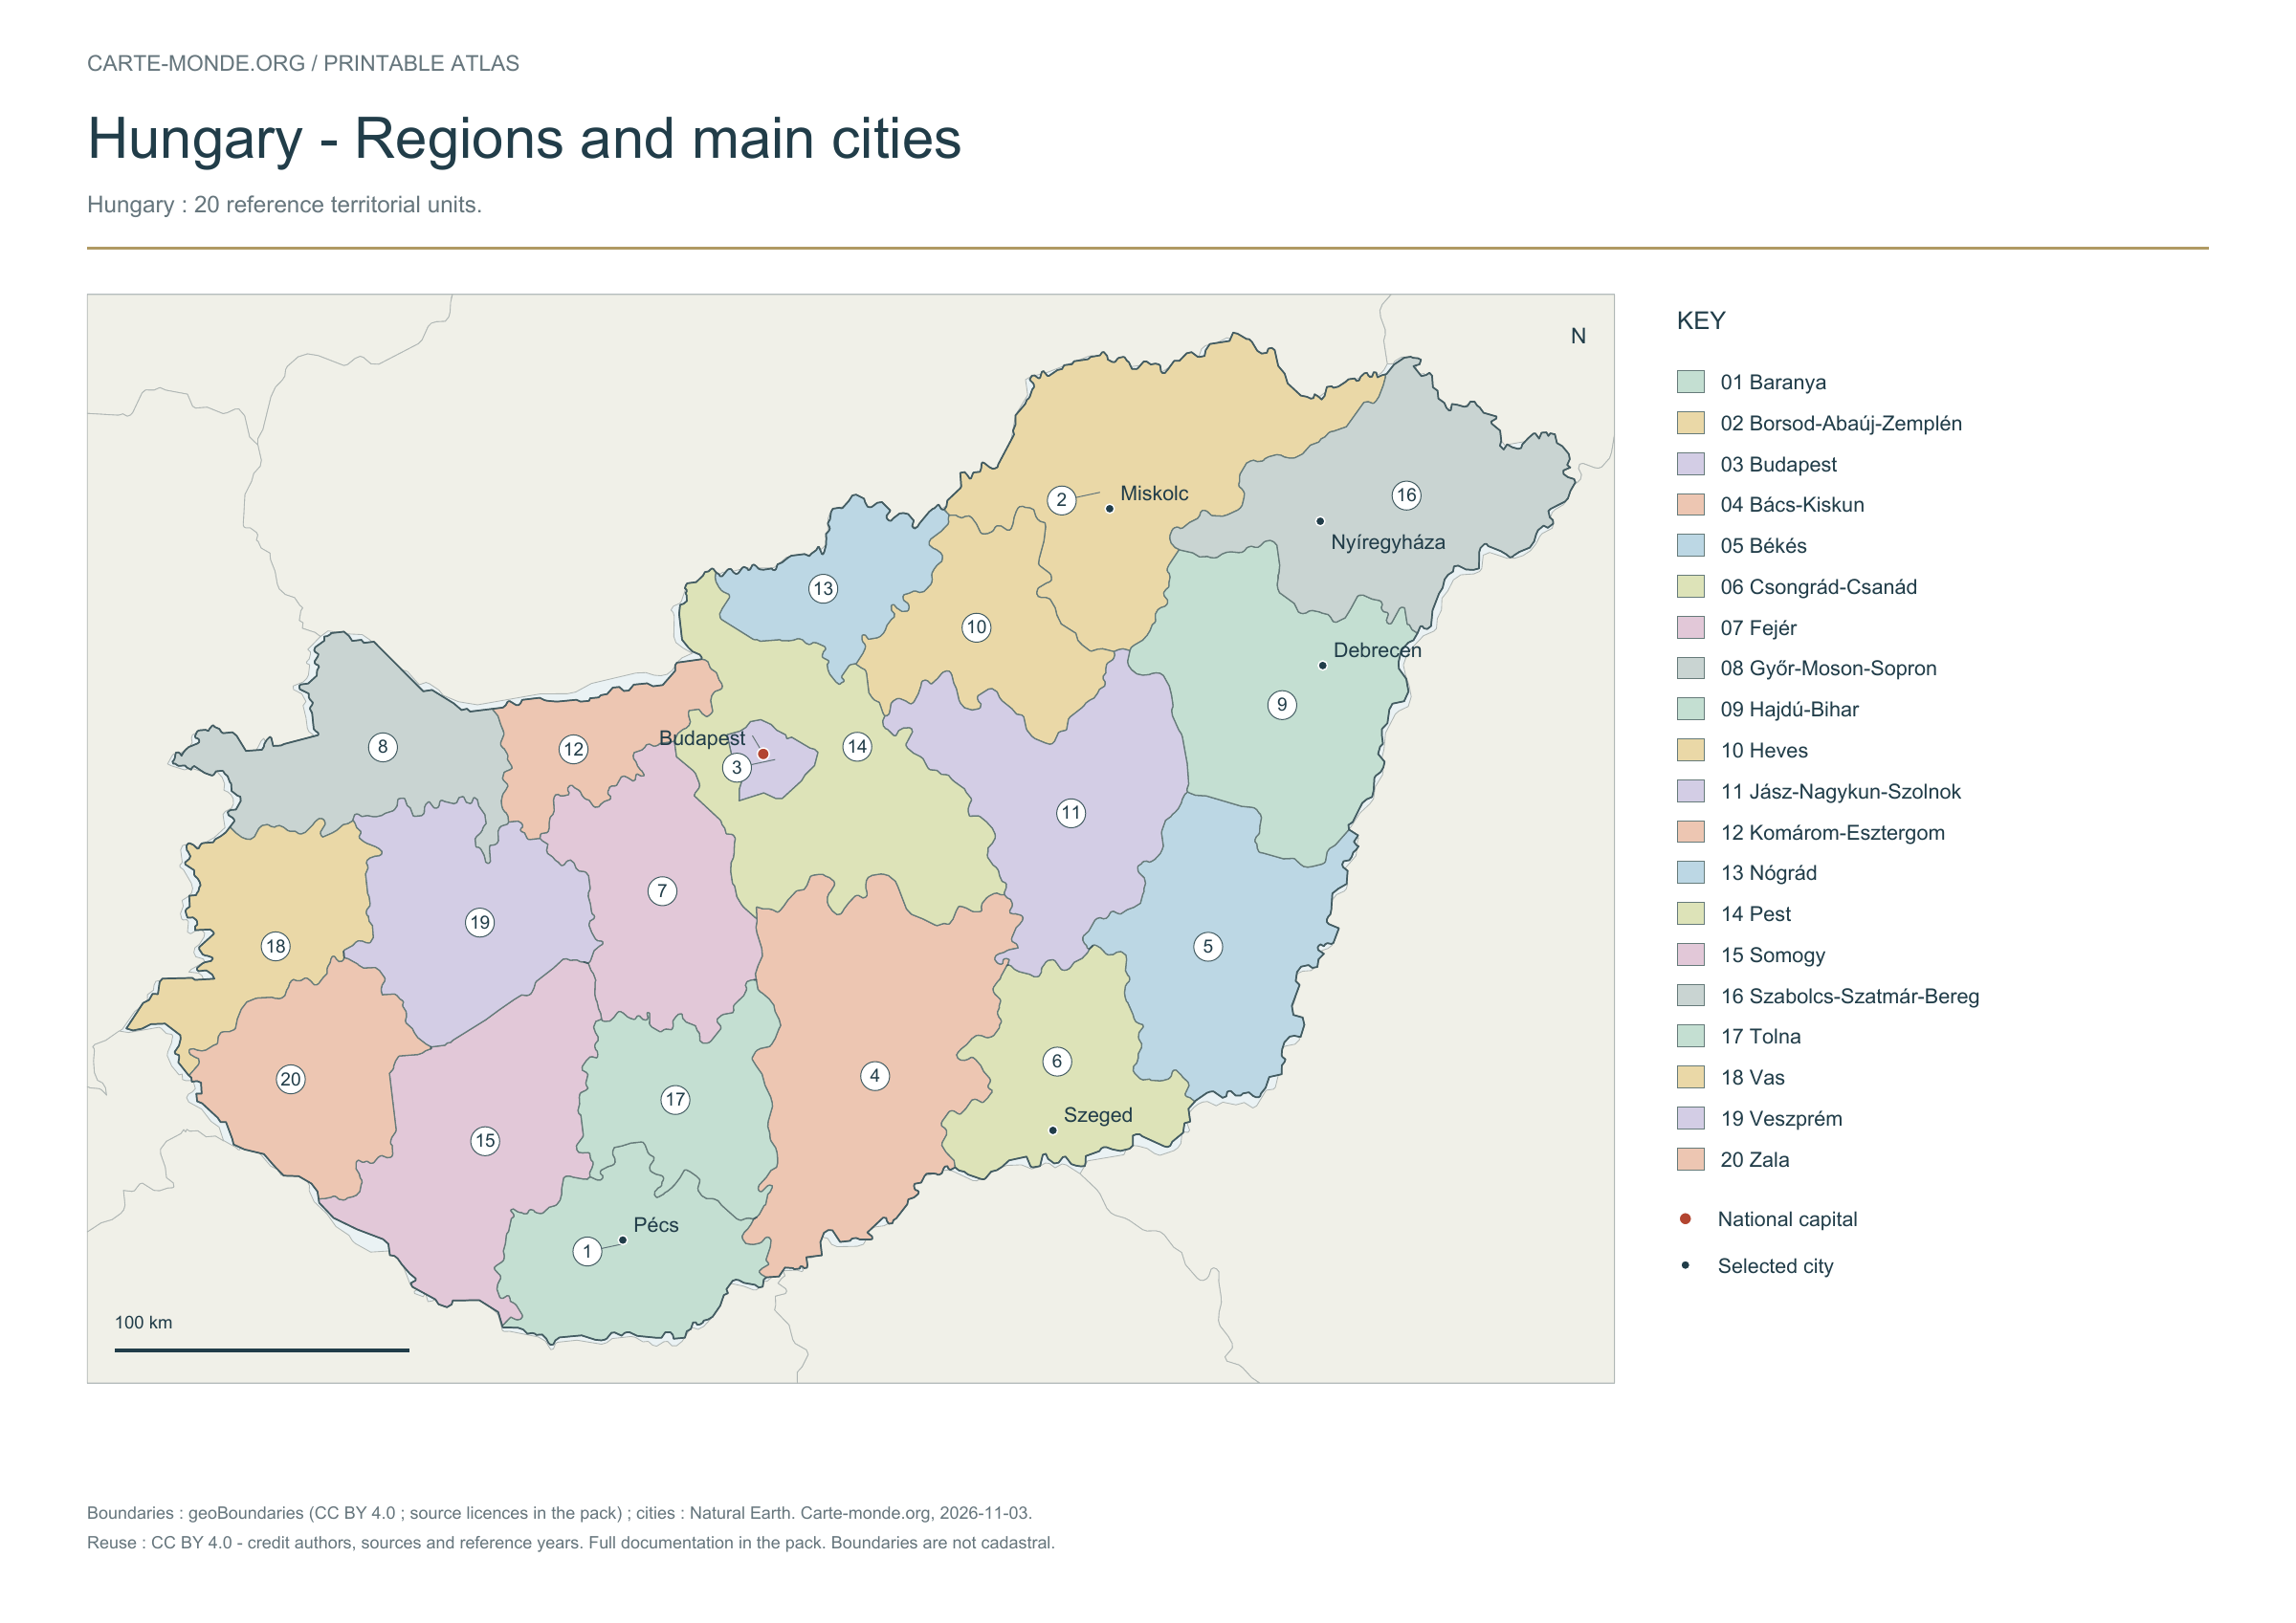
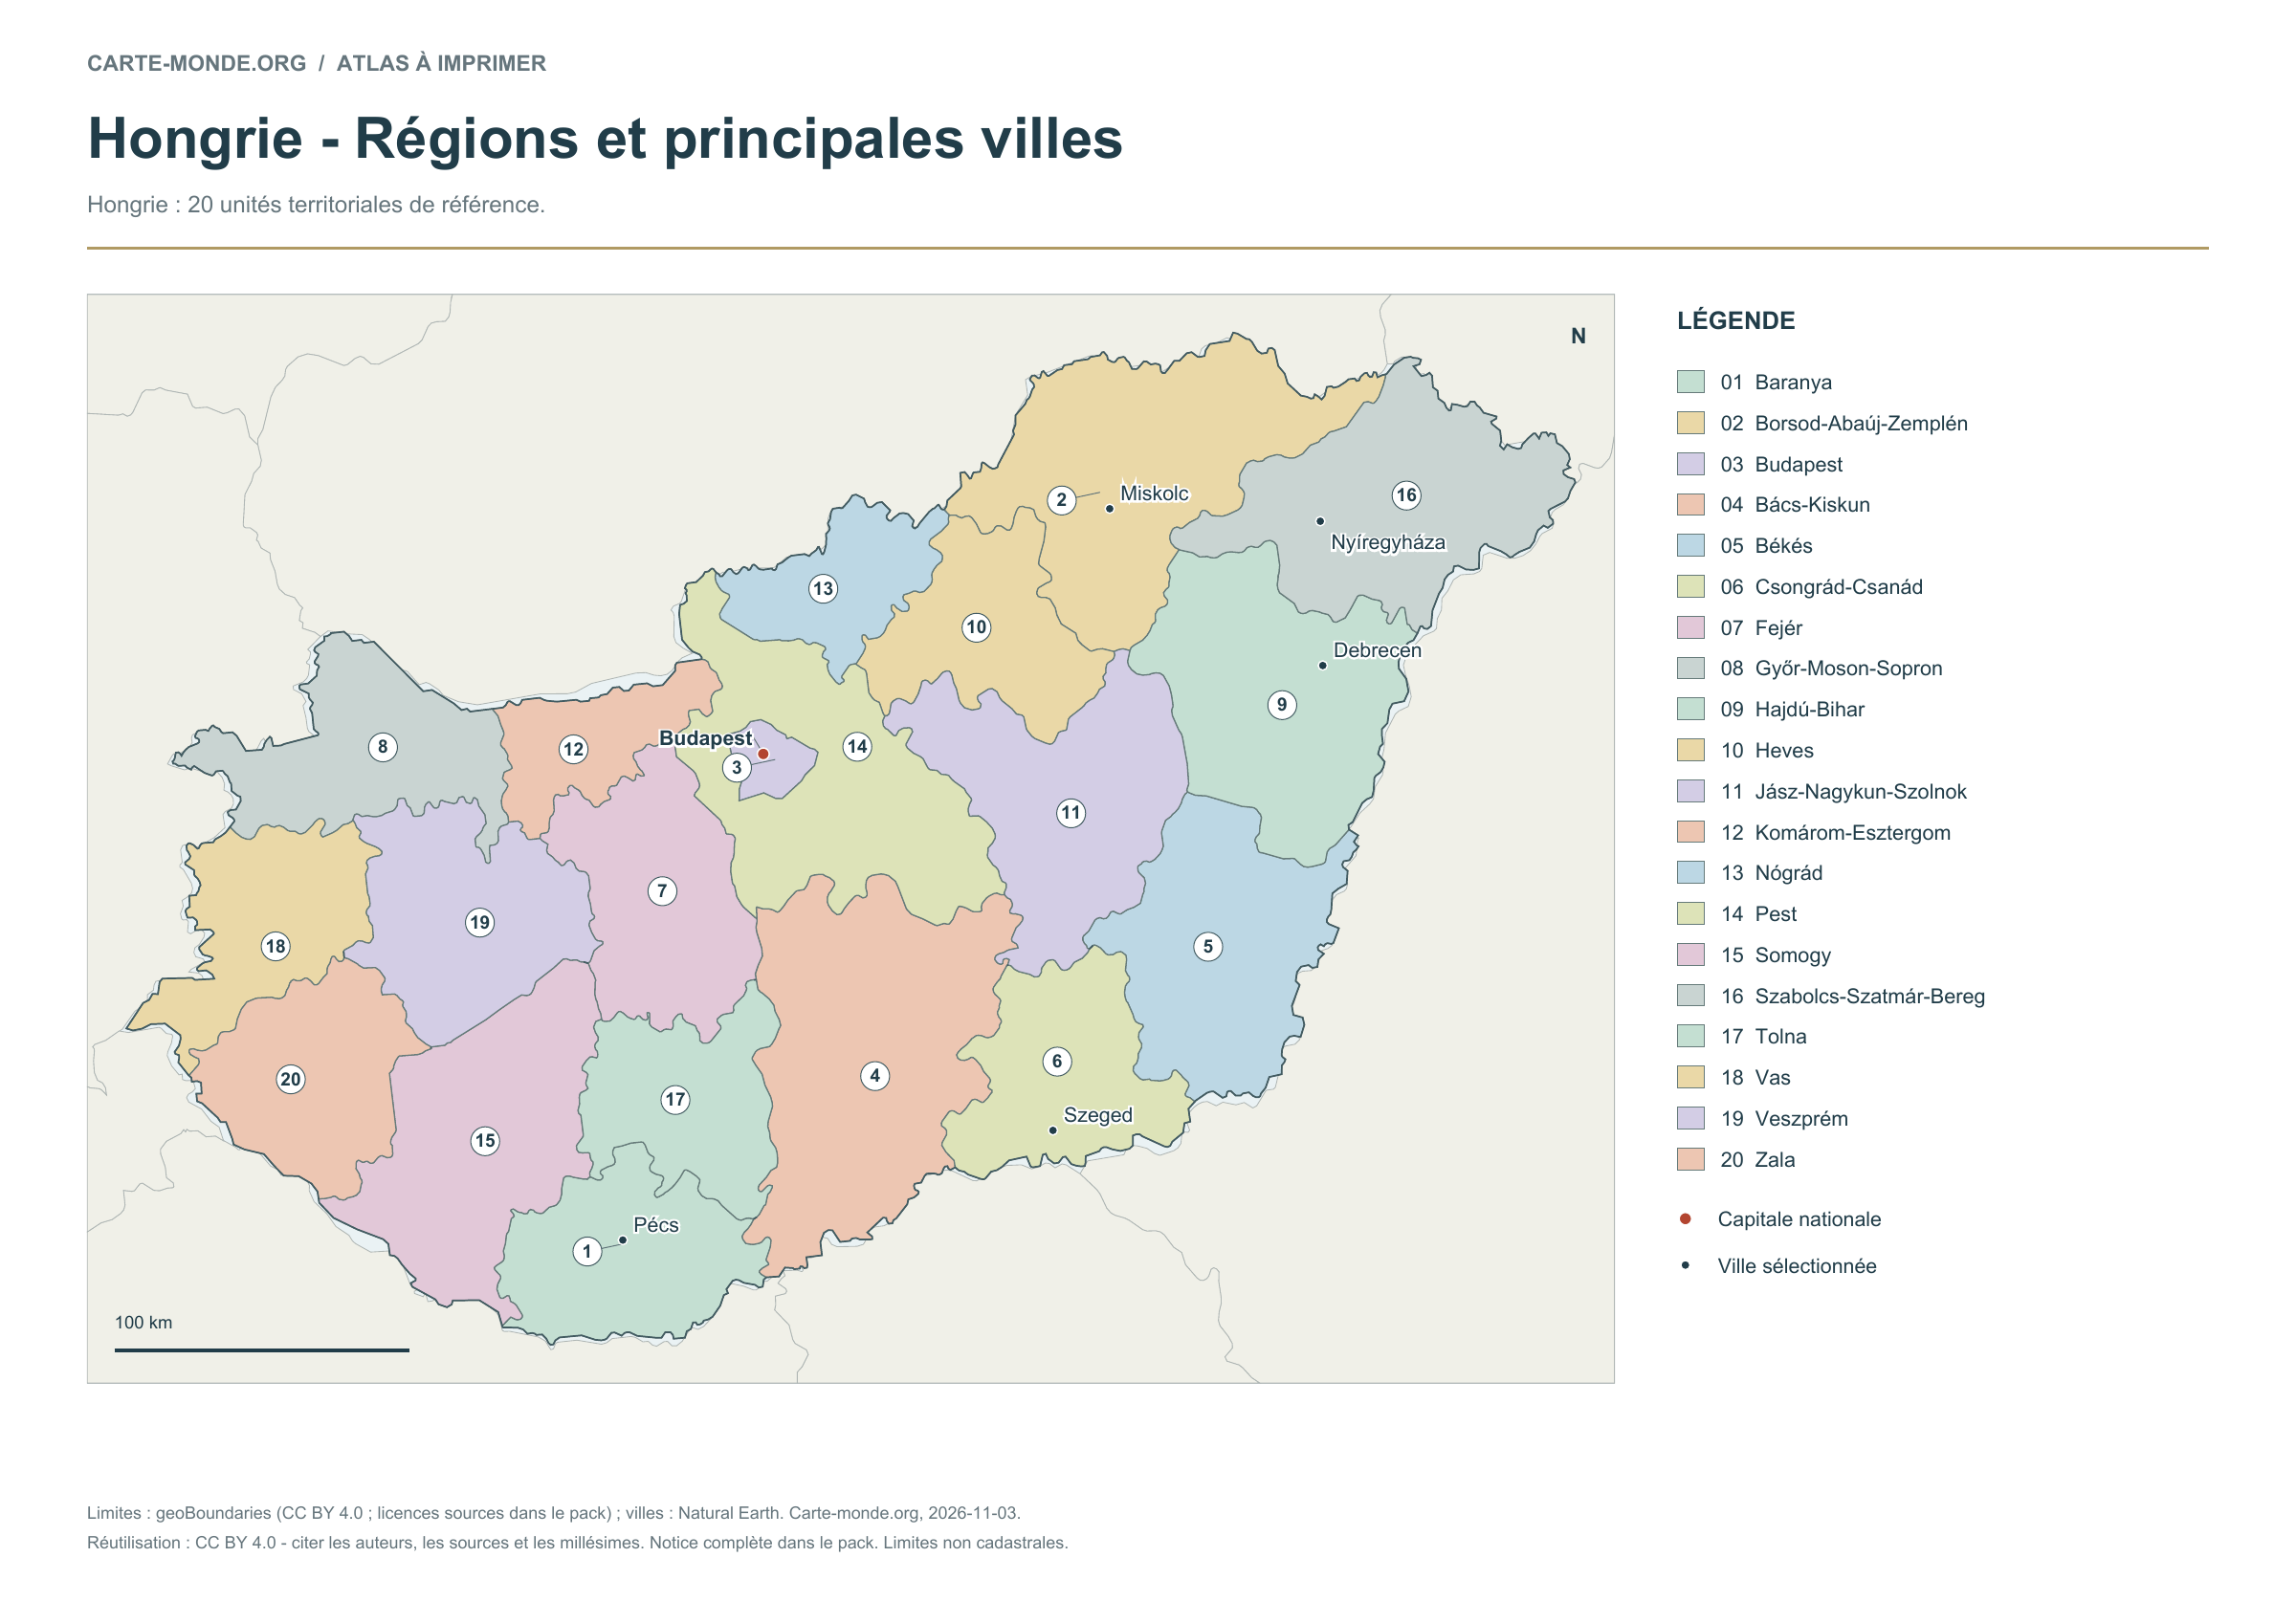
Regions and main cities — Hungary

Carte-monde.org · November 2026

Regions and main cities

The 20 reference territorial units are numbered and named in the key, with selected cities and the capital.

A4 landscape PDF · PNG 2 400 px · CC BY 4.0

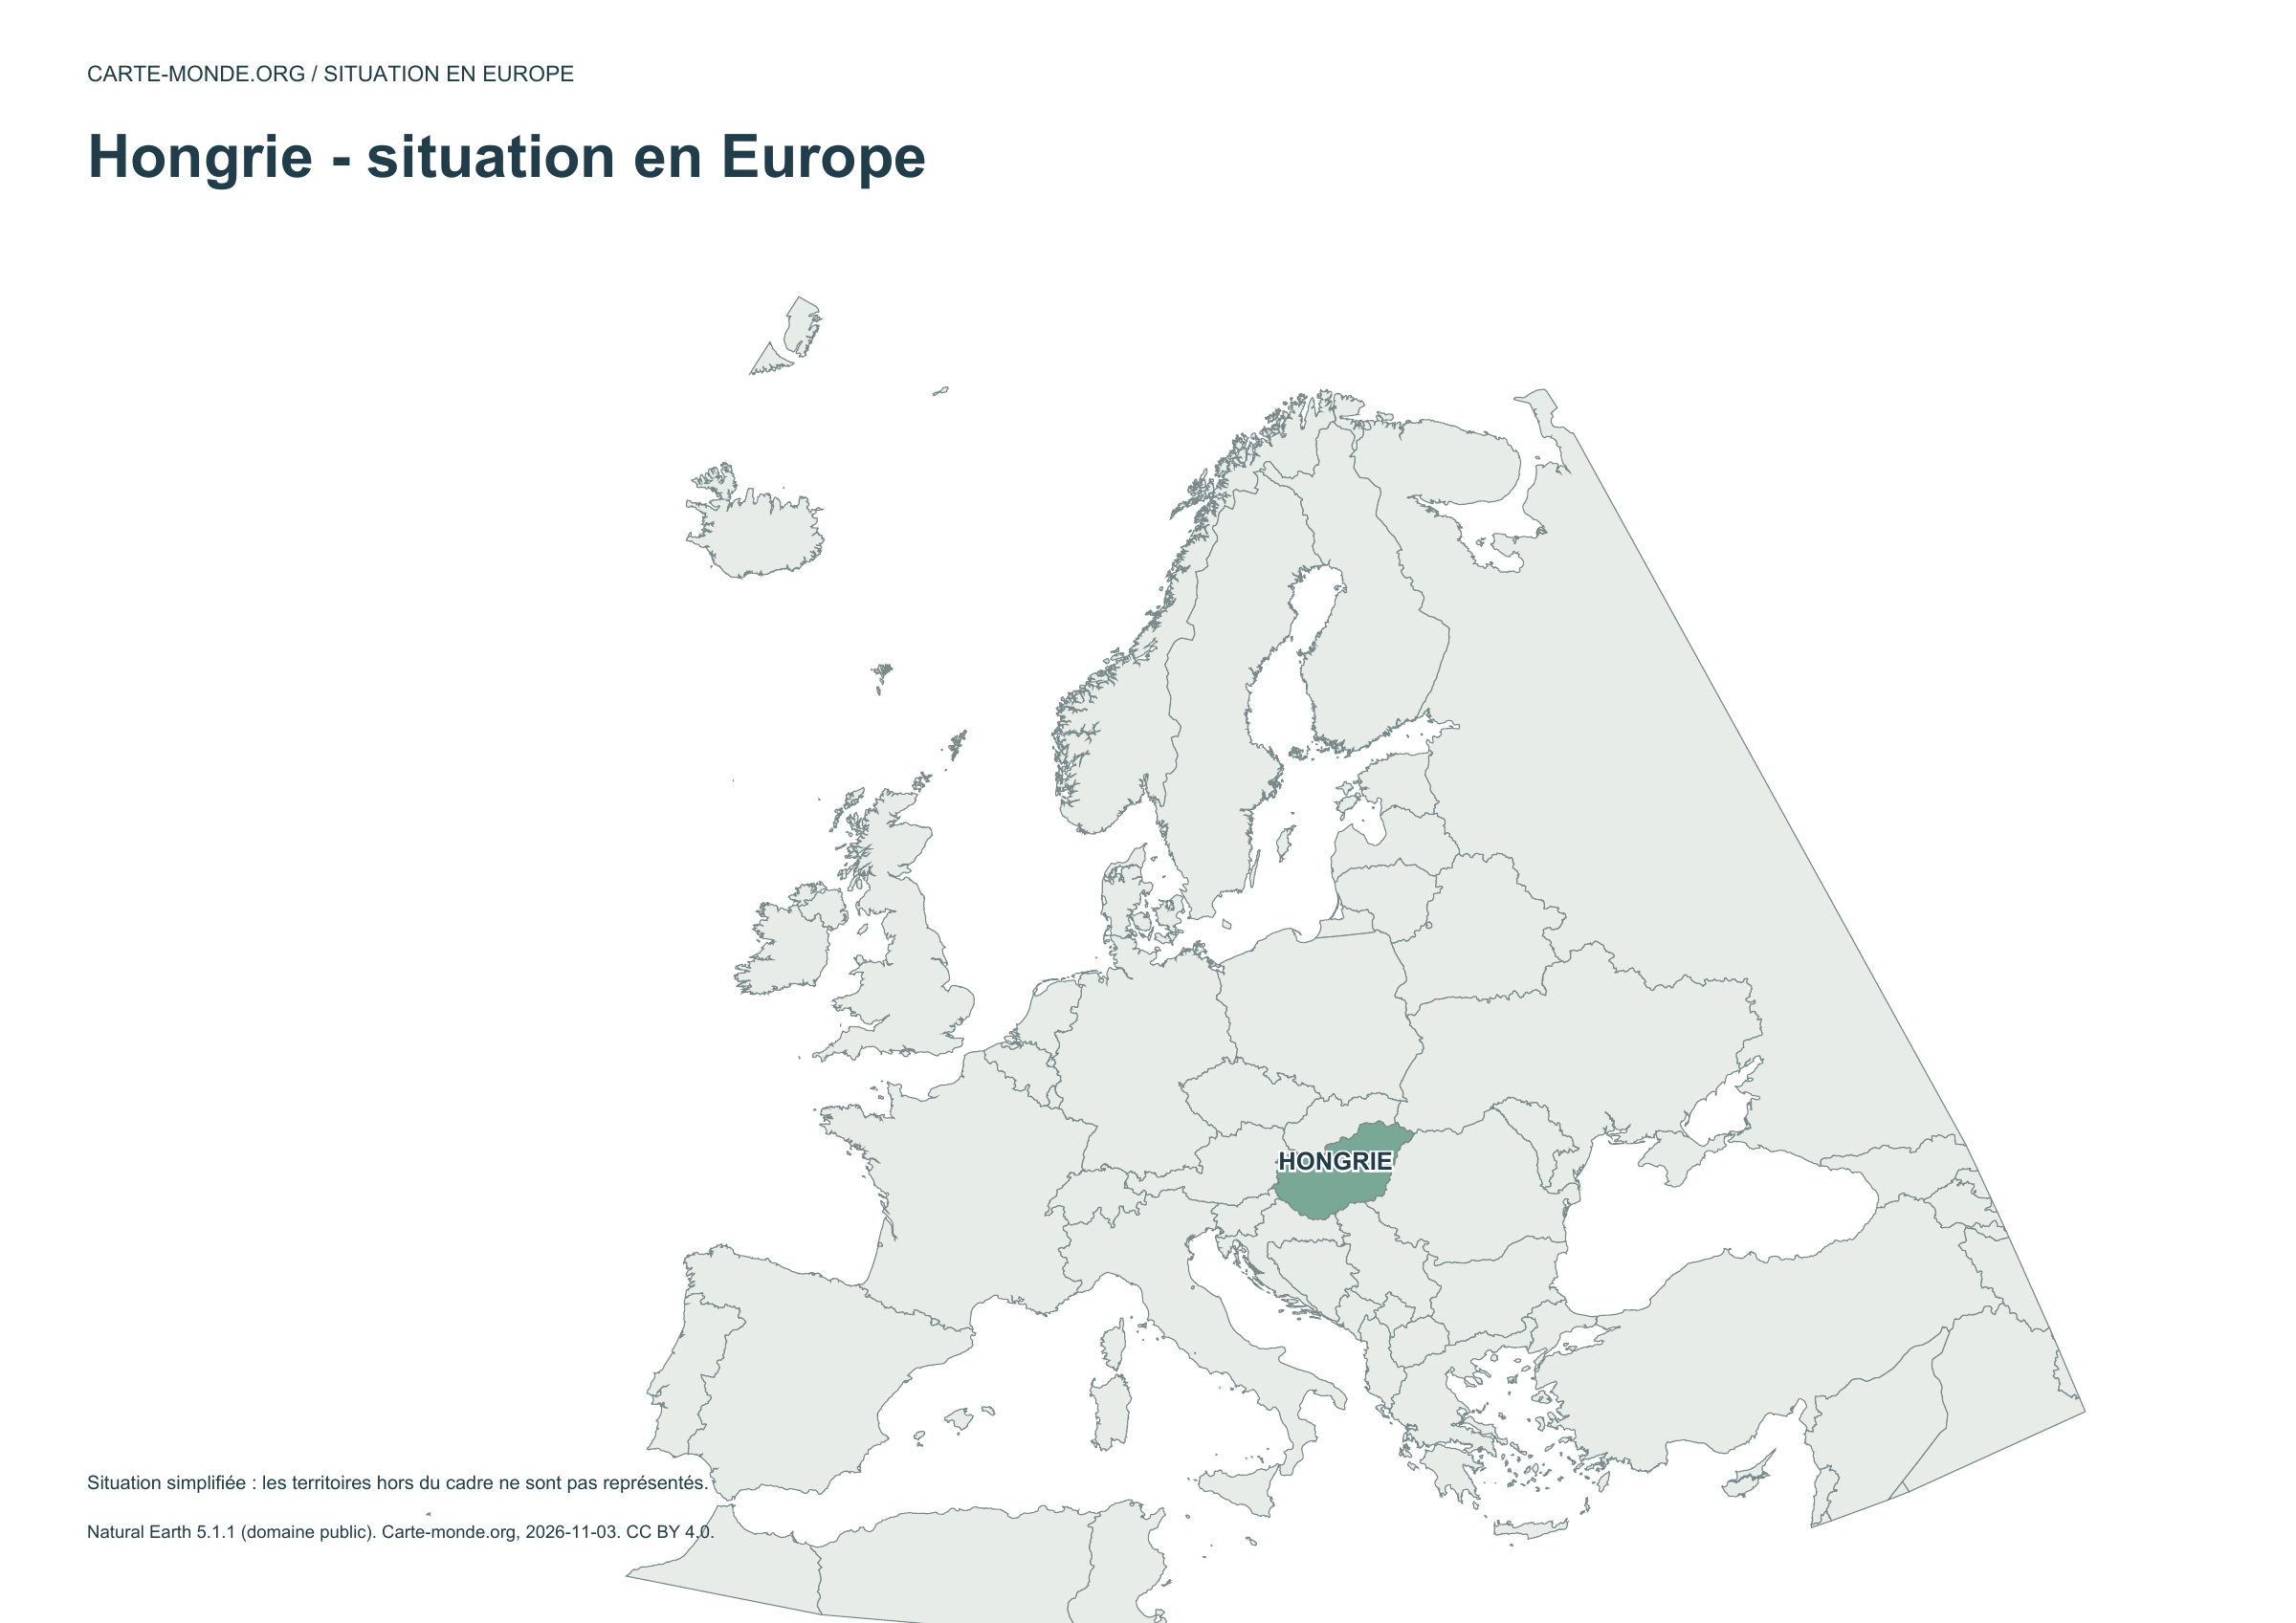
Location in Europe — Hungary

Carte-monde.org · November 2026

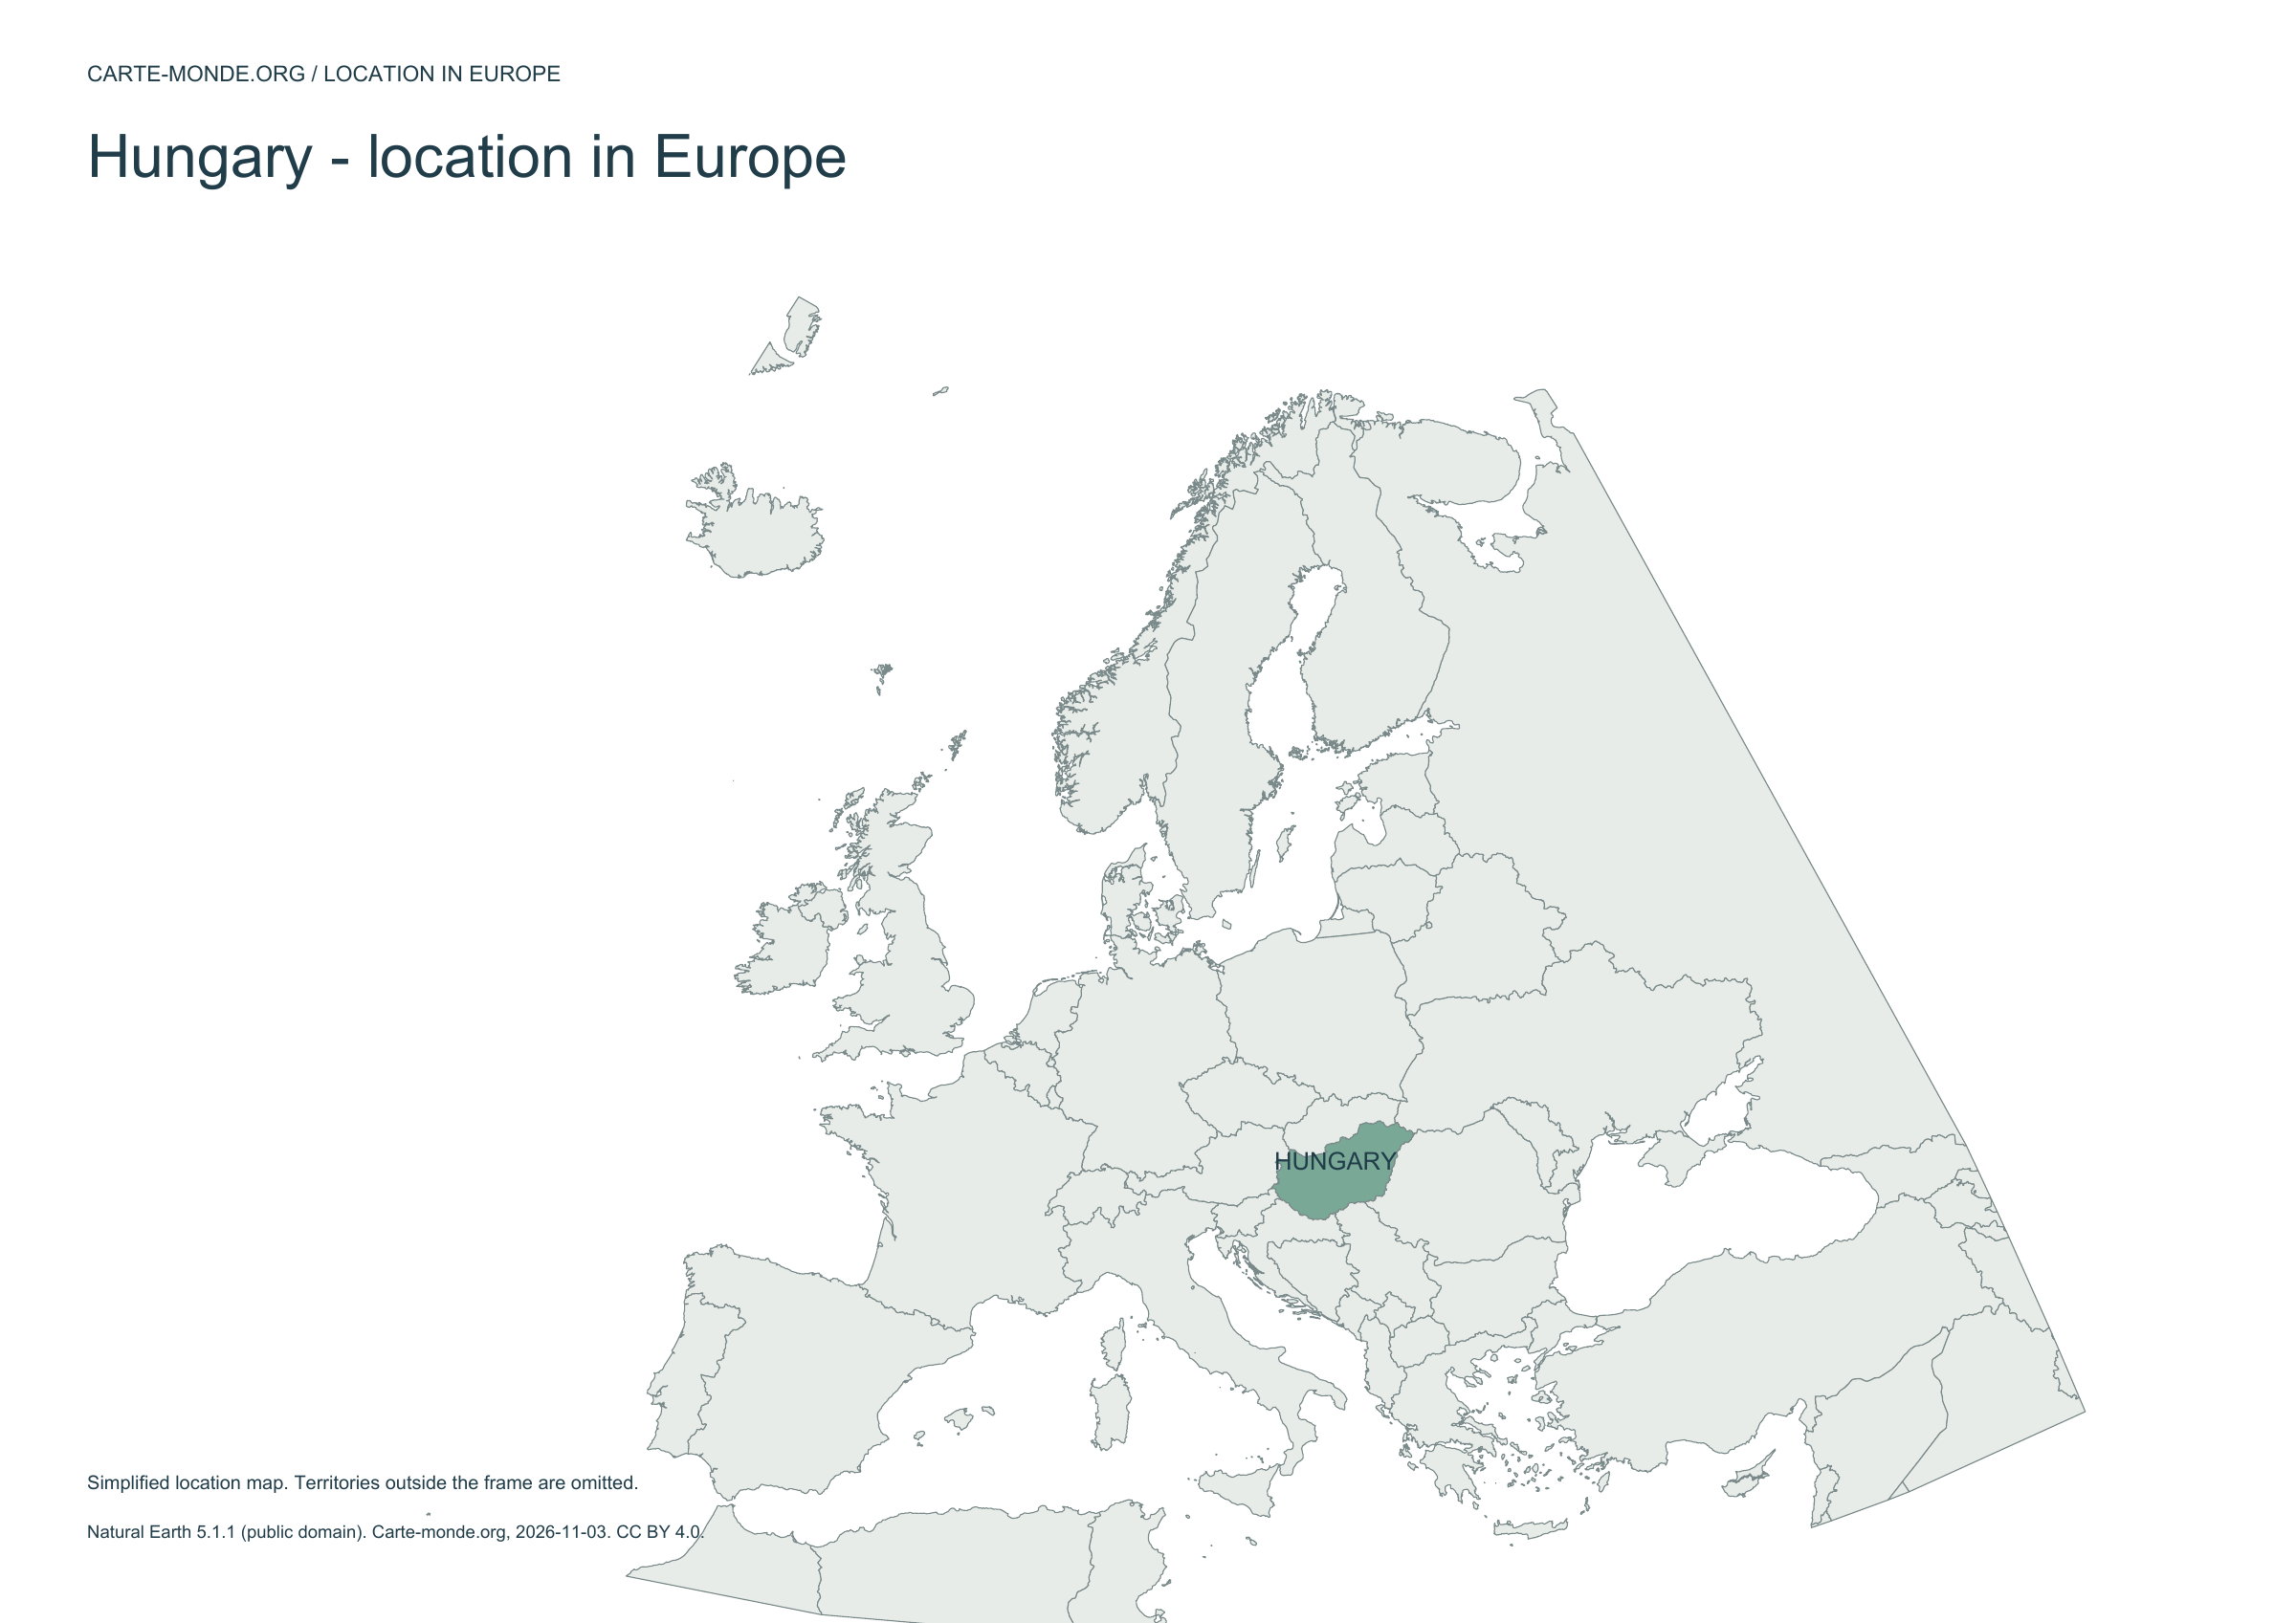
Location in Europe

The country is highlighted within a simplified European frame; territories outside this frame are not shown.

A4 landscape PDF · PNG 2 400 px · CC BY 4.0

Two maps to understand the relief

Choose shaded relief for an overview, or elevation classes for school use.

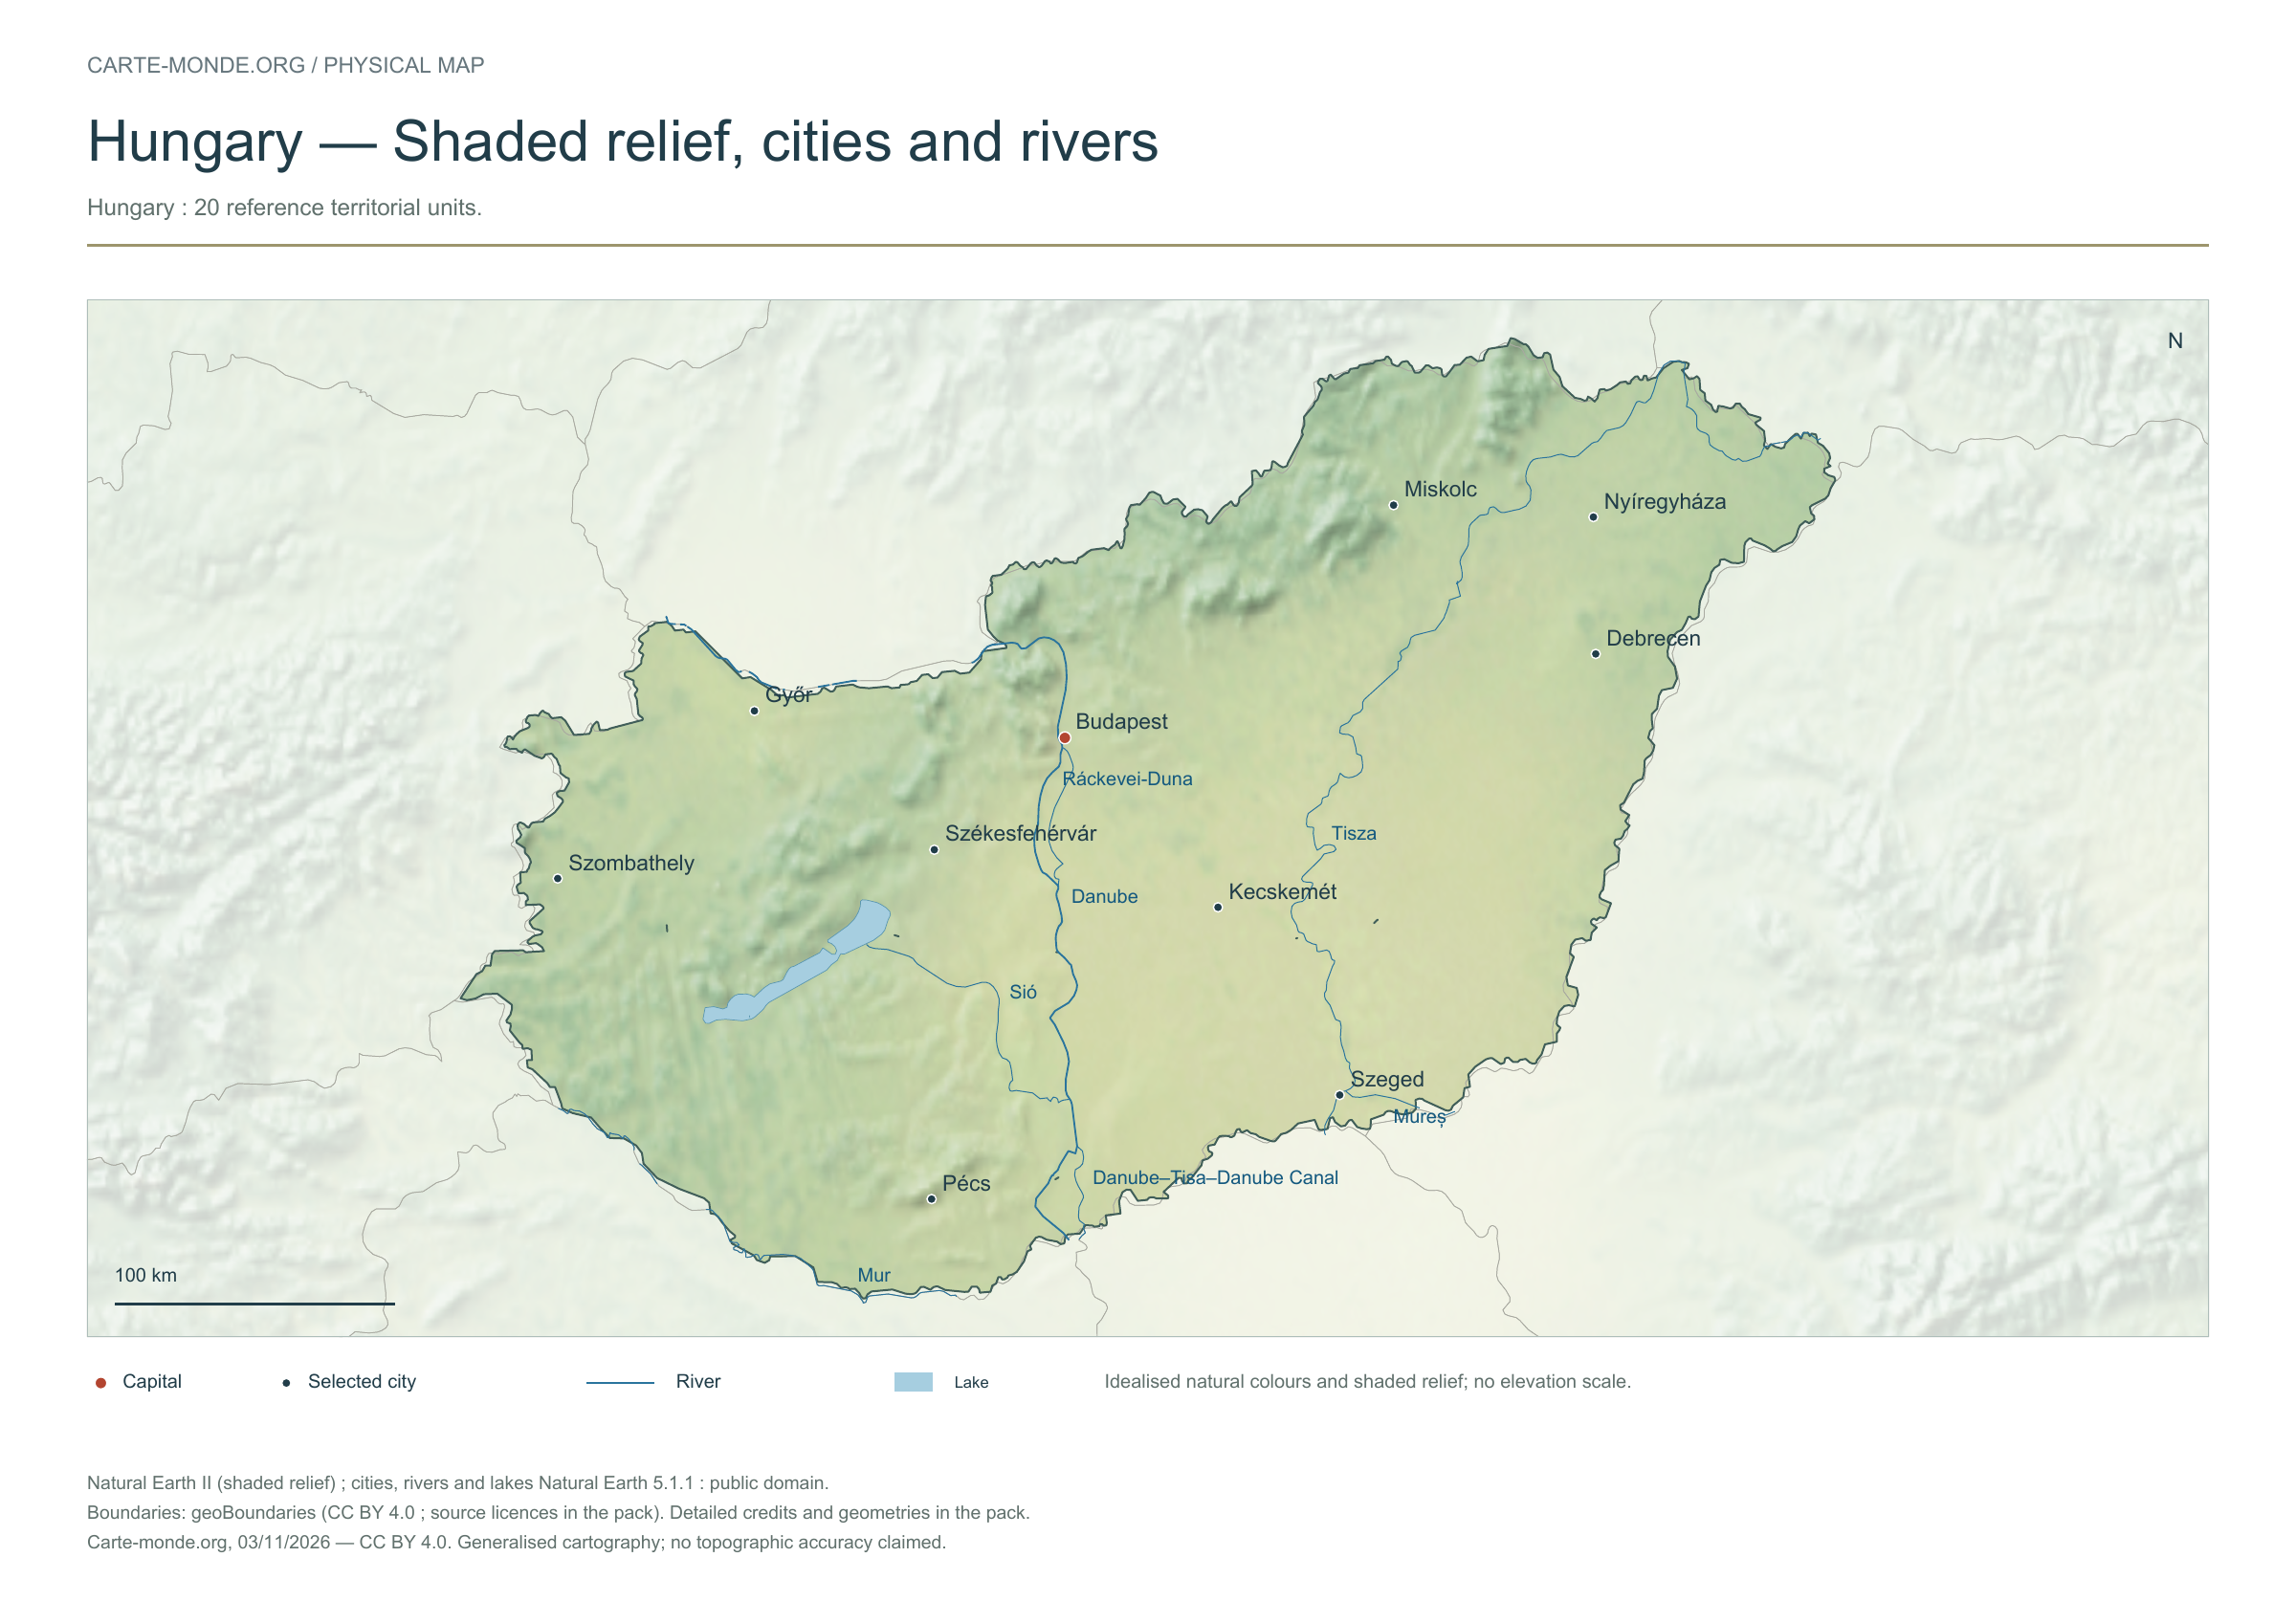
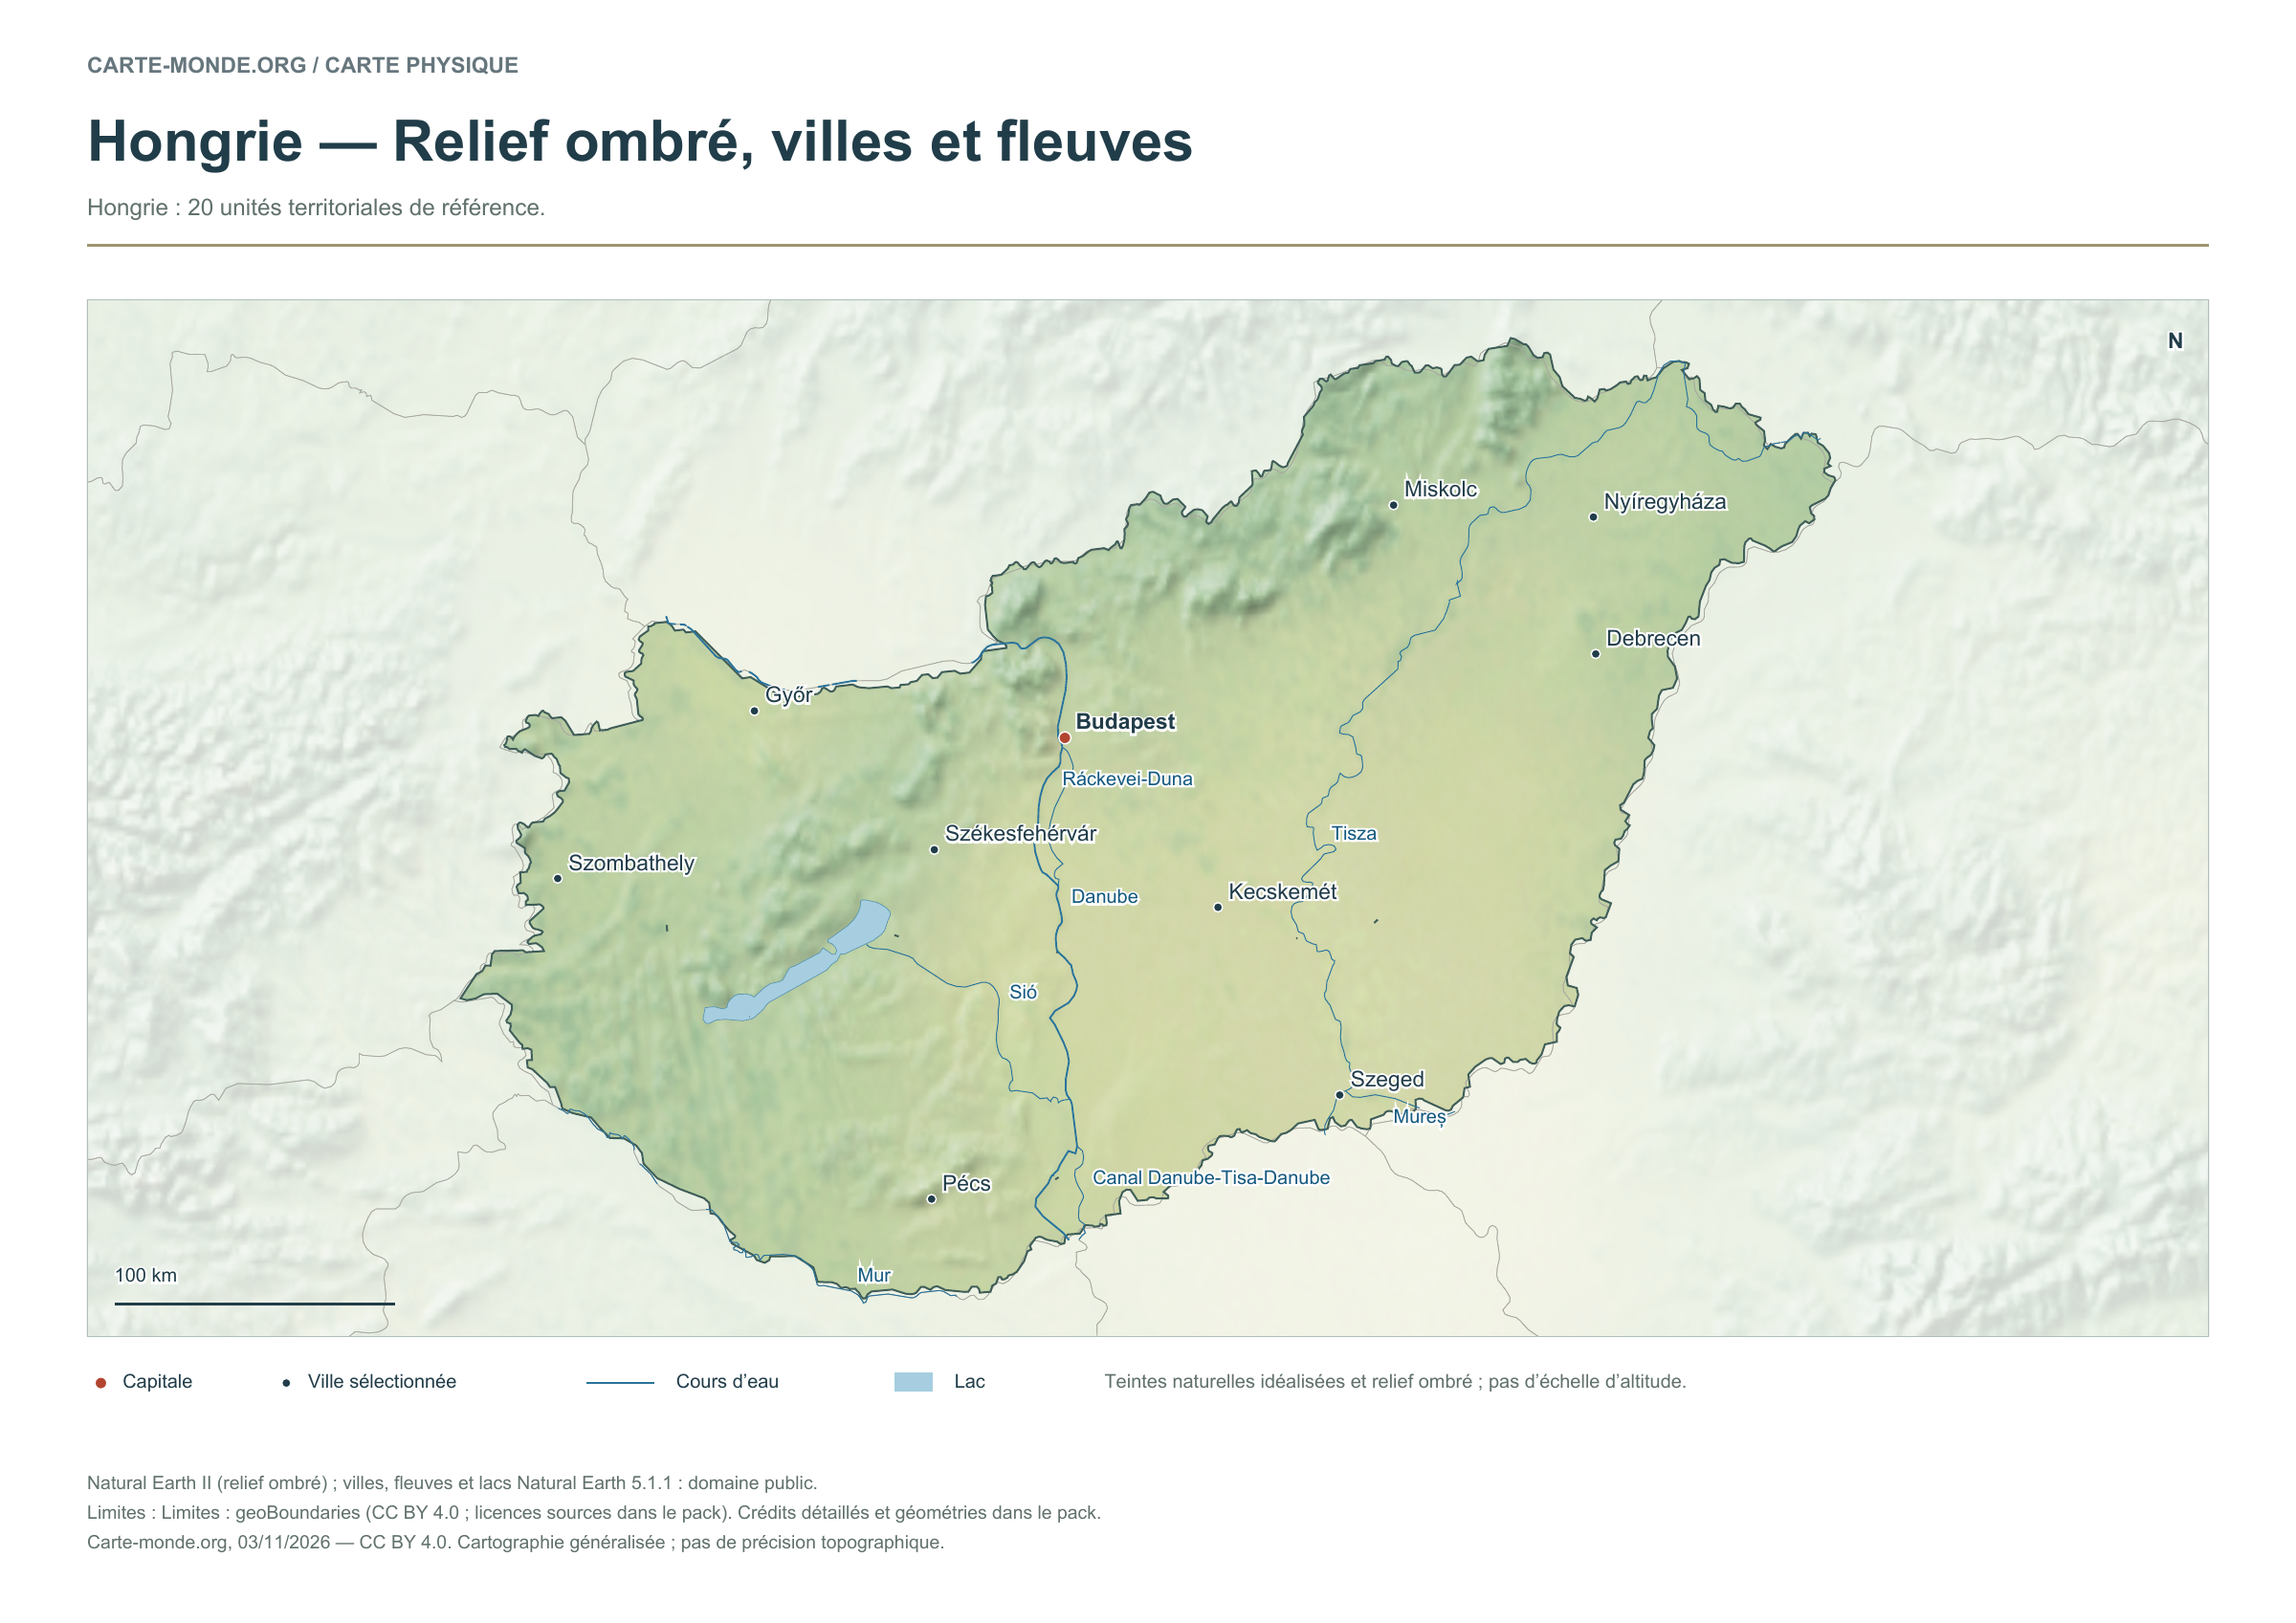
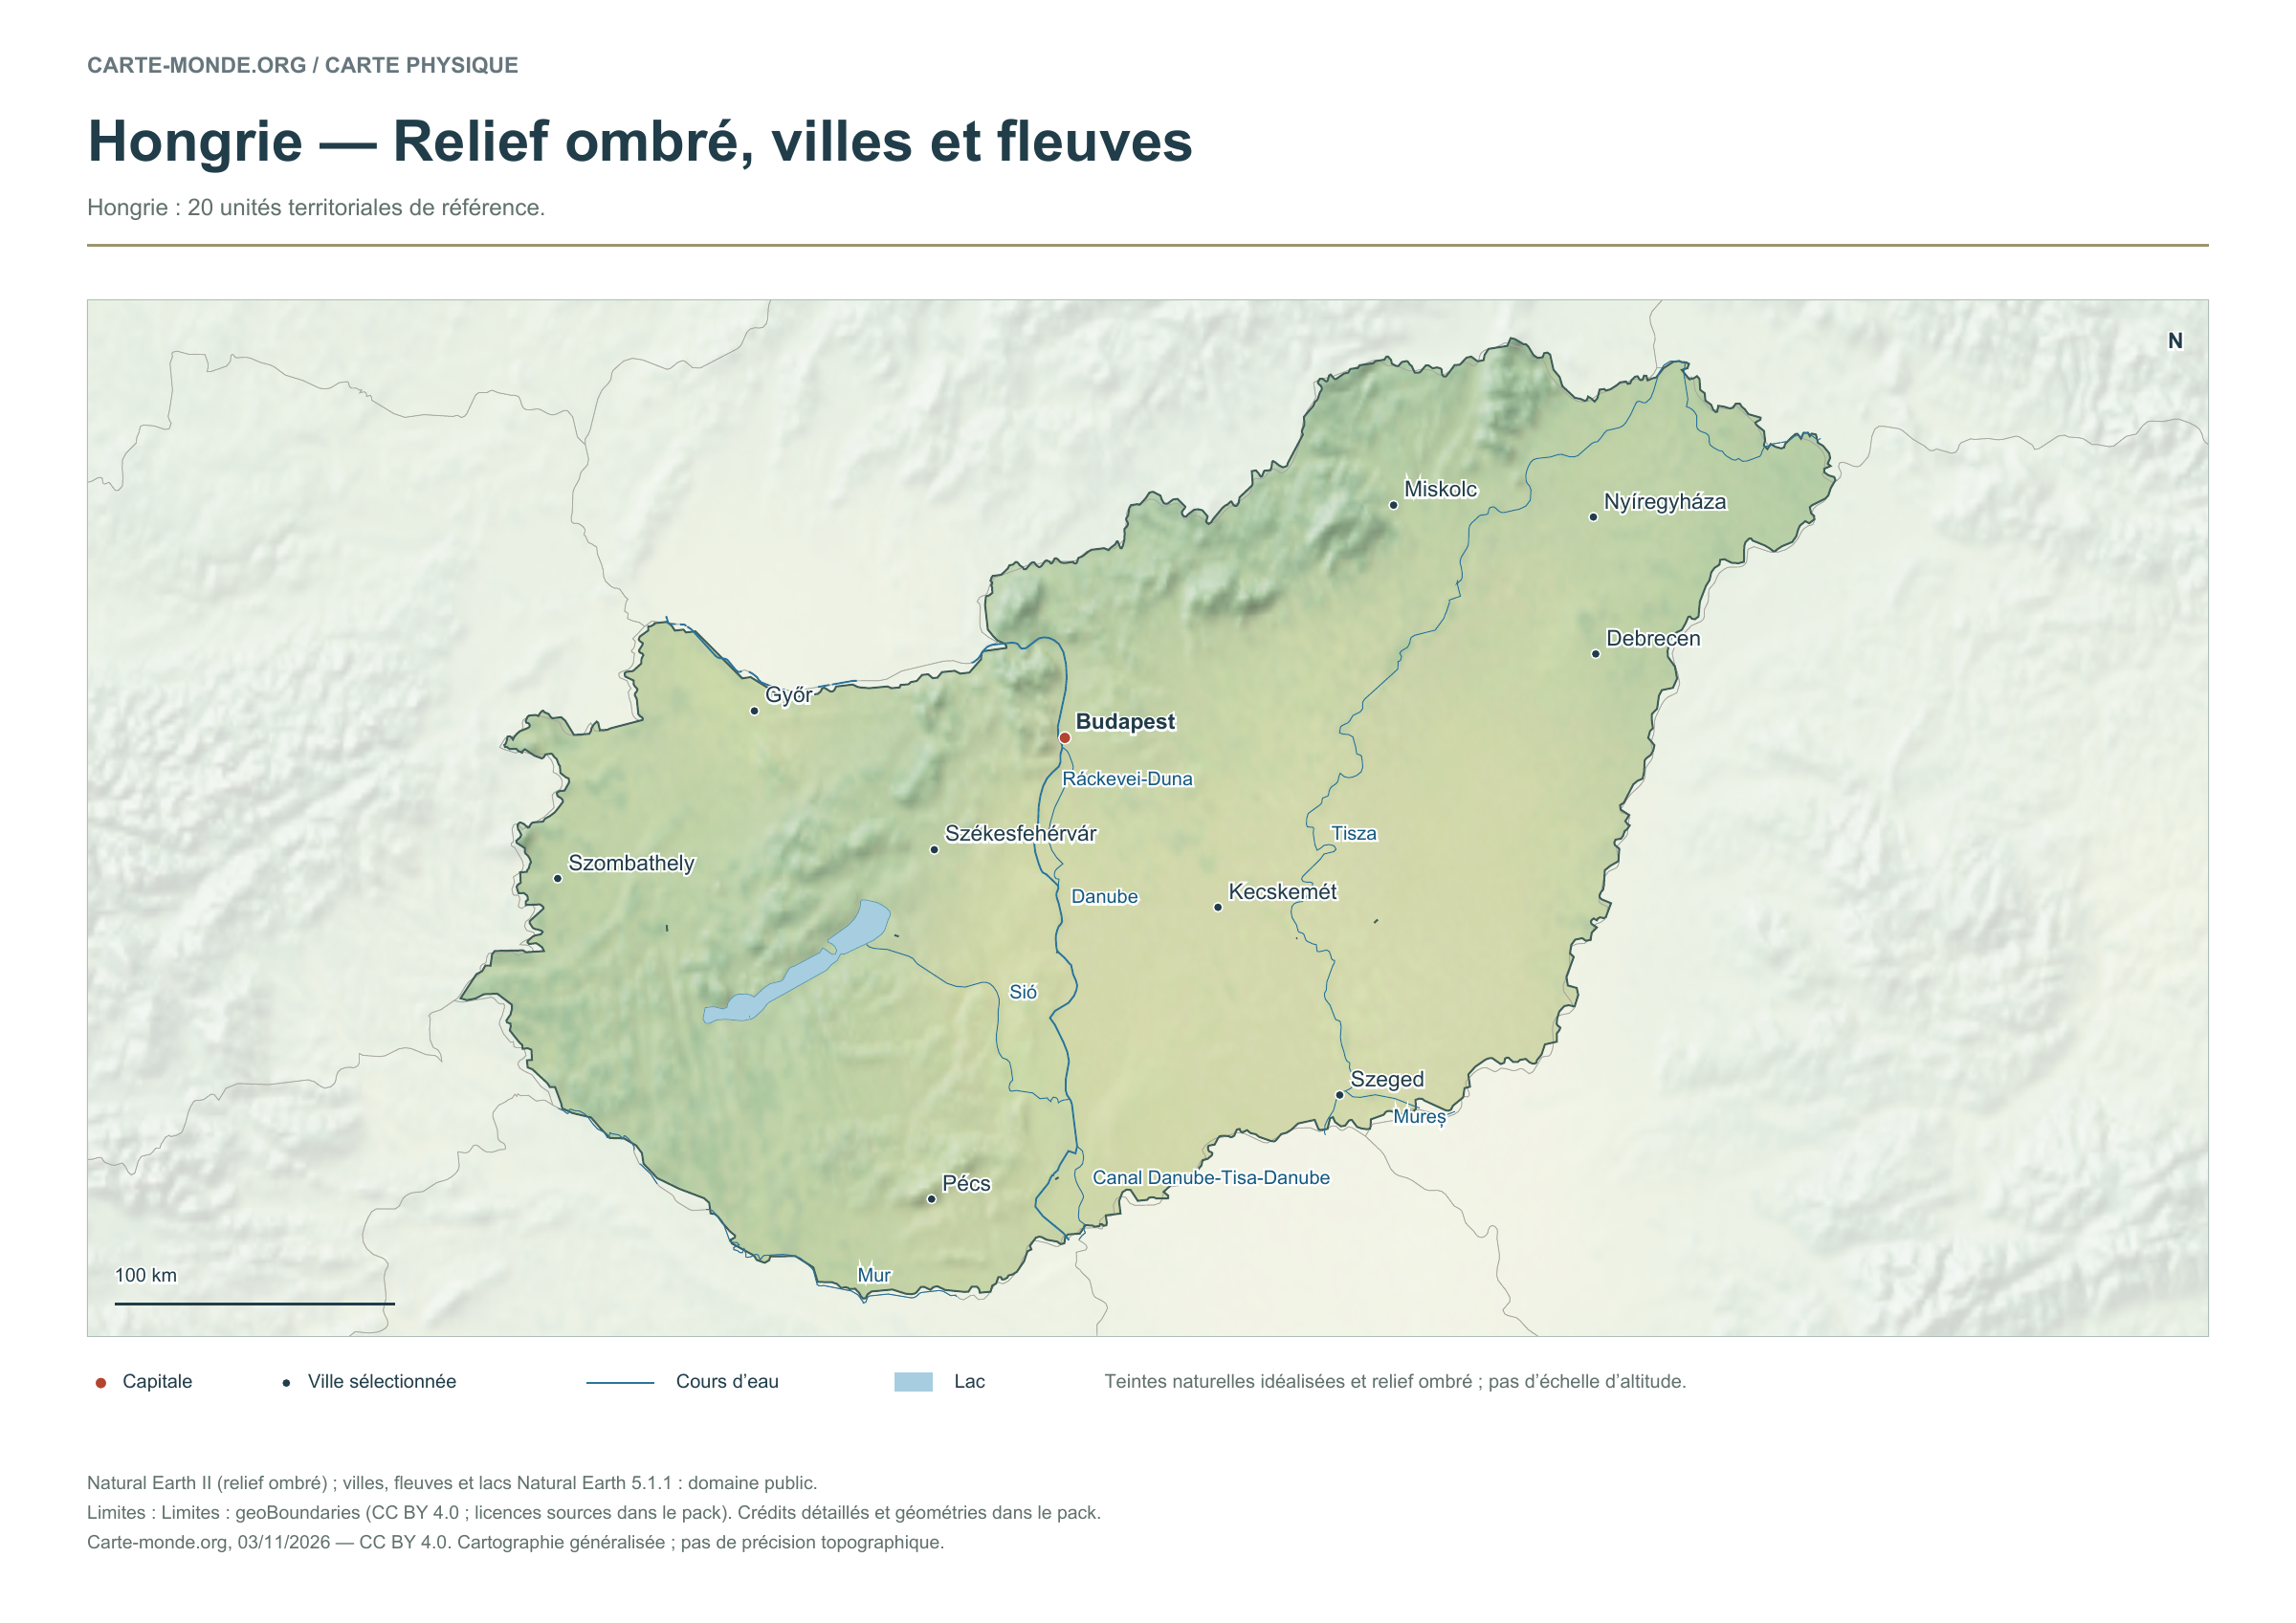
Hungary — Shaded relief, cities and rivers

Carte-monde.org · November 2026

Shaded relief, cities and rivers

To identify major landforms, cities and the river network. The natural colours are not an elevation scale.

Raster base map, cities, rivers and lakes: Natural Earth, public domain. Other boundary credits and licences are retained in the pack. Cartographic work CC BY 4.0; ODbL-derived data retains its licence. No topographic accuracy is claimed.

Territory, data and selection of names

Hungary: 20 reference territorial units.

Natural Earth II shaded relief background, 10 selected cities. Named rivers: Canal Danube-Tisa-Danube, Danube, Mur, Mureș, Ráckevei-Duna, Sió, Tisza.

The colours represent idealised natural cover; they do not correspond to elevation classes. This global background remains generalised, particularly for small states.

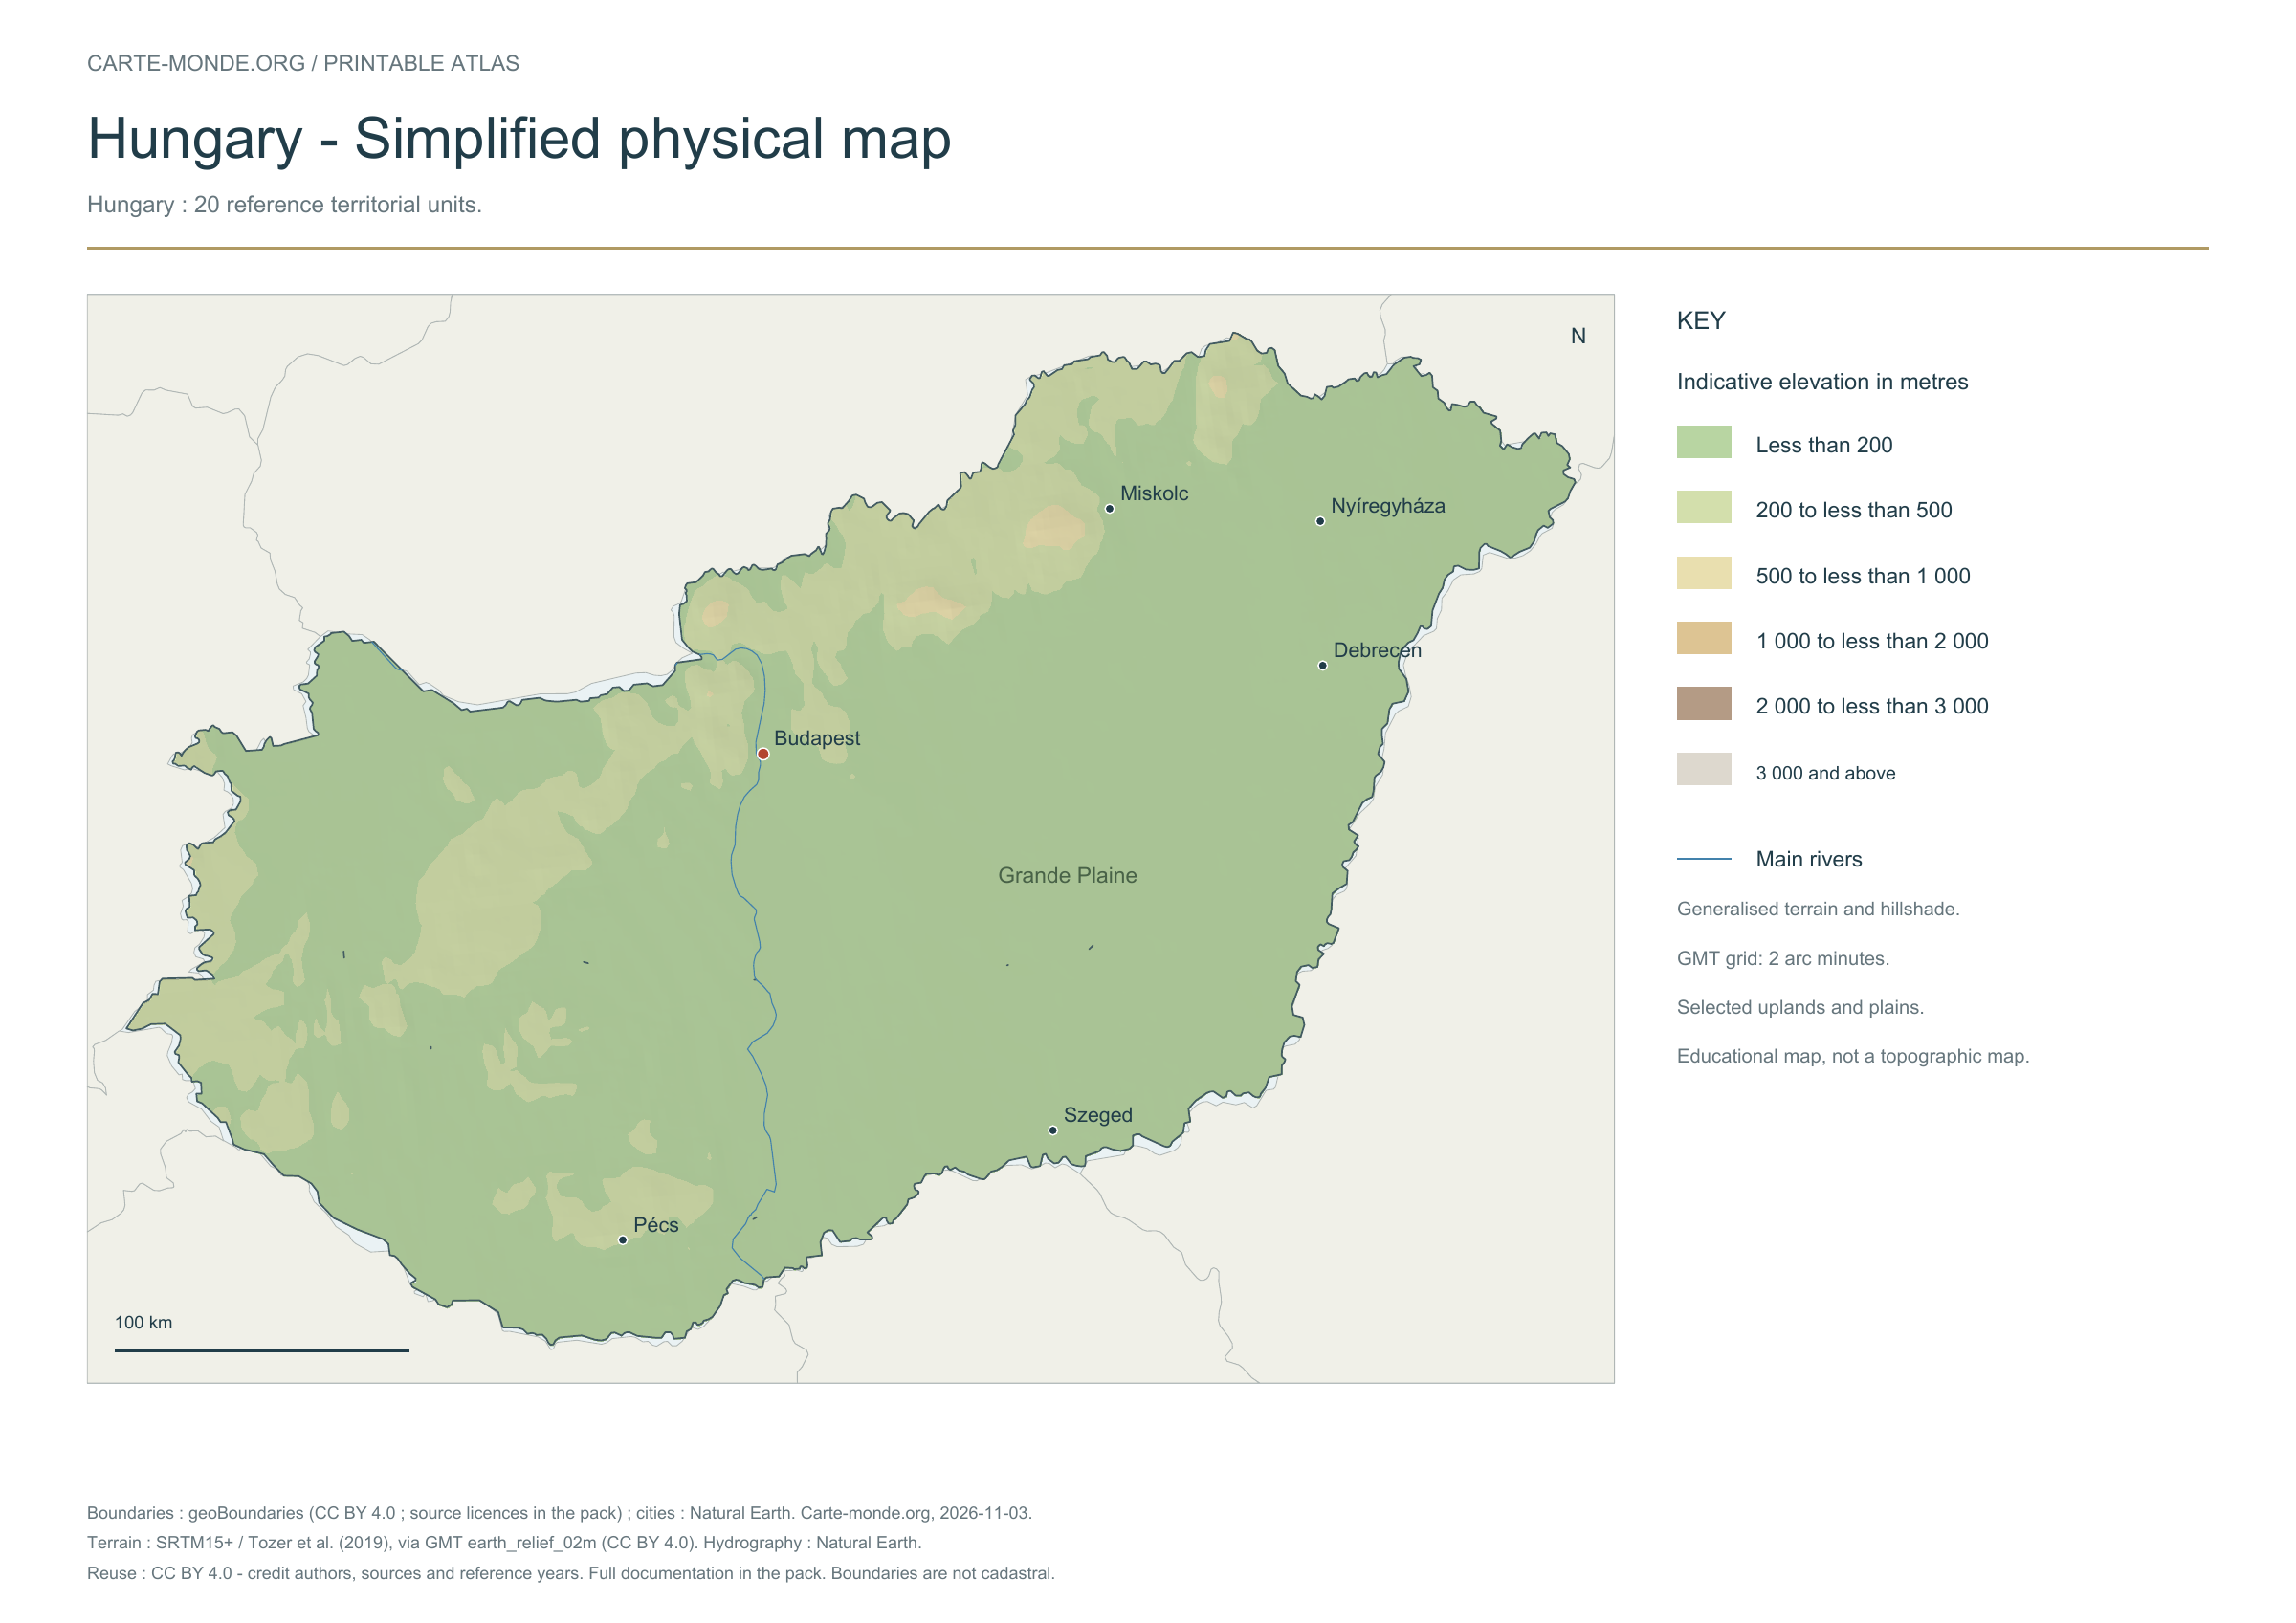
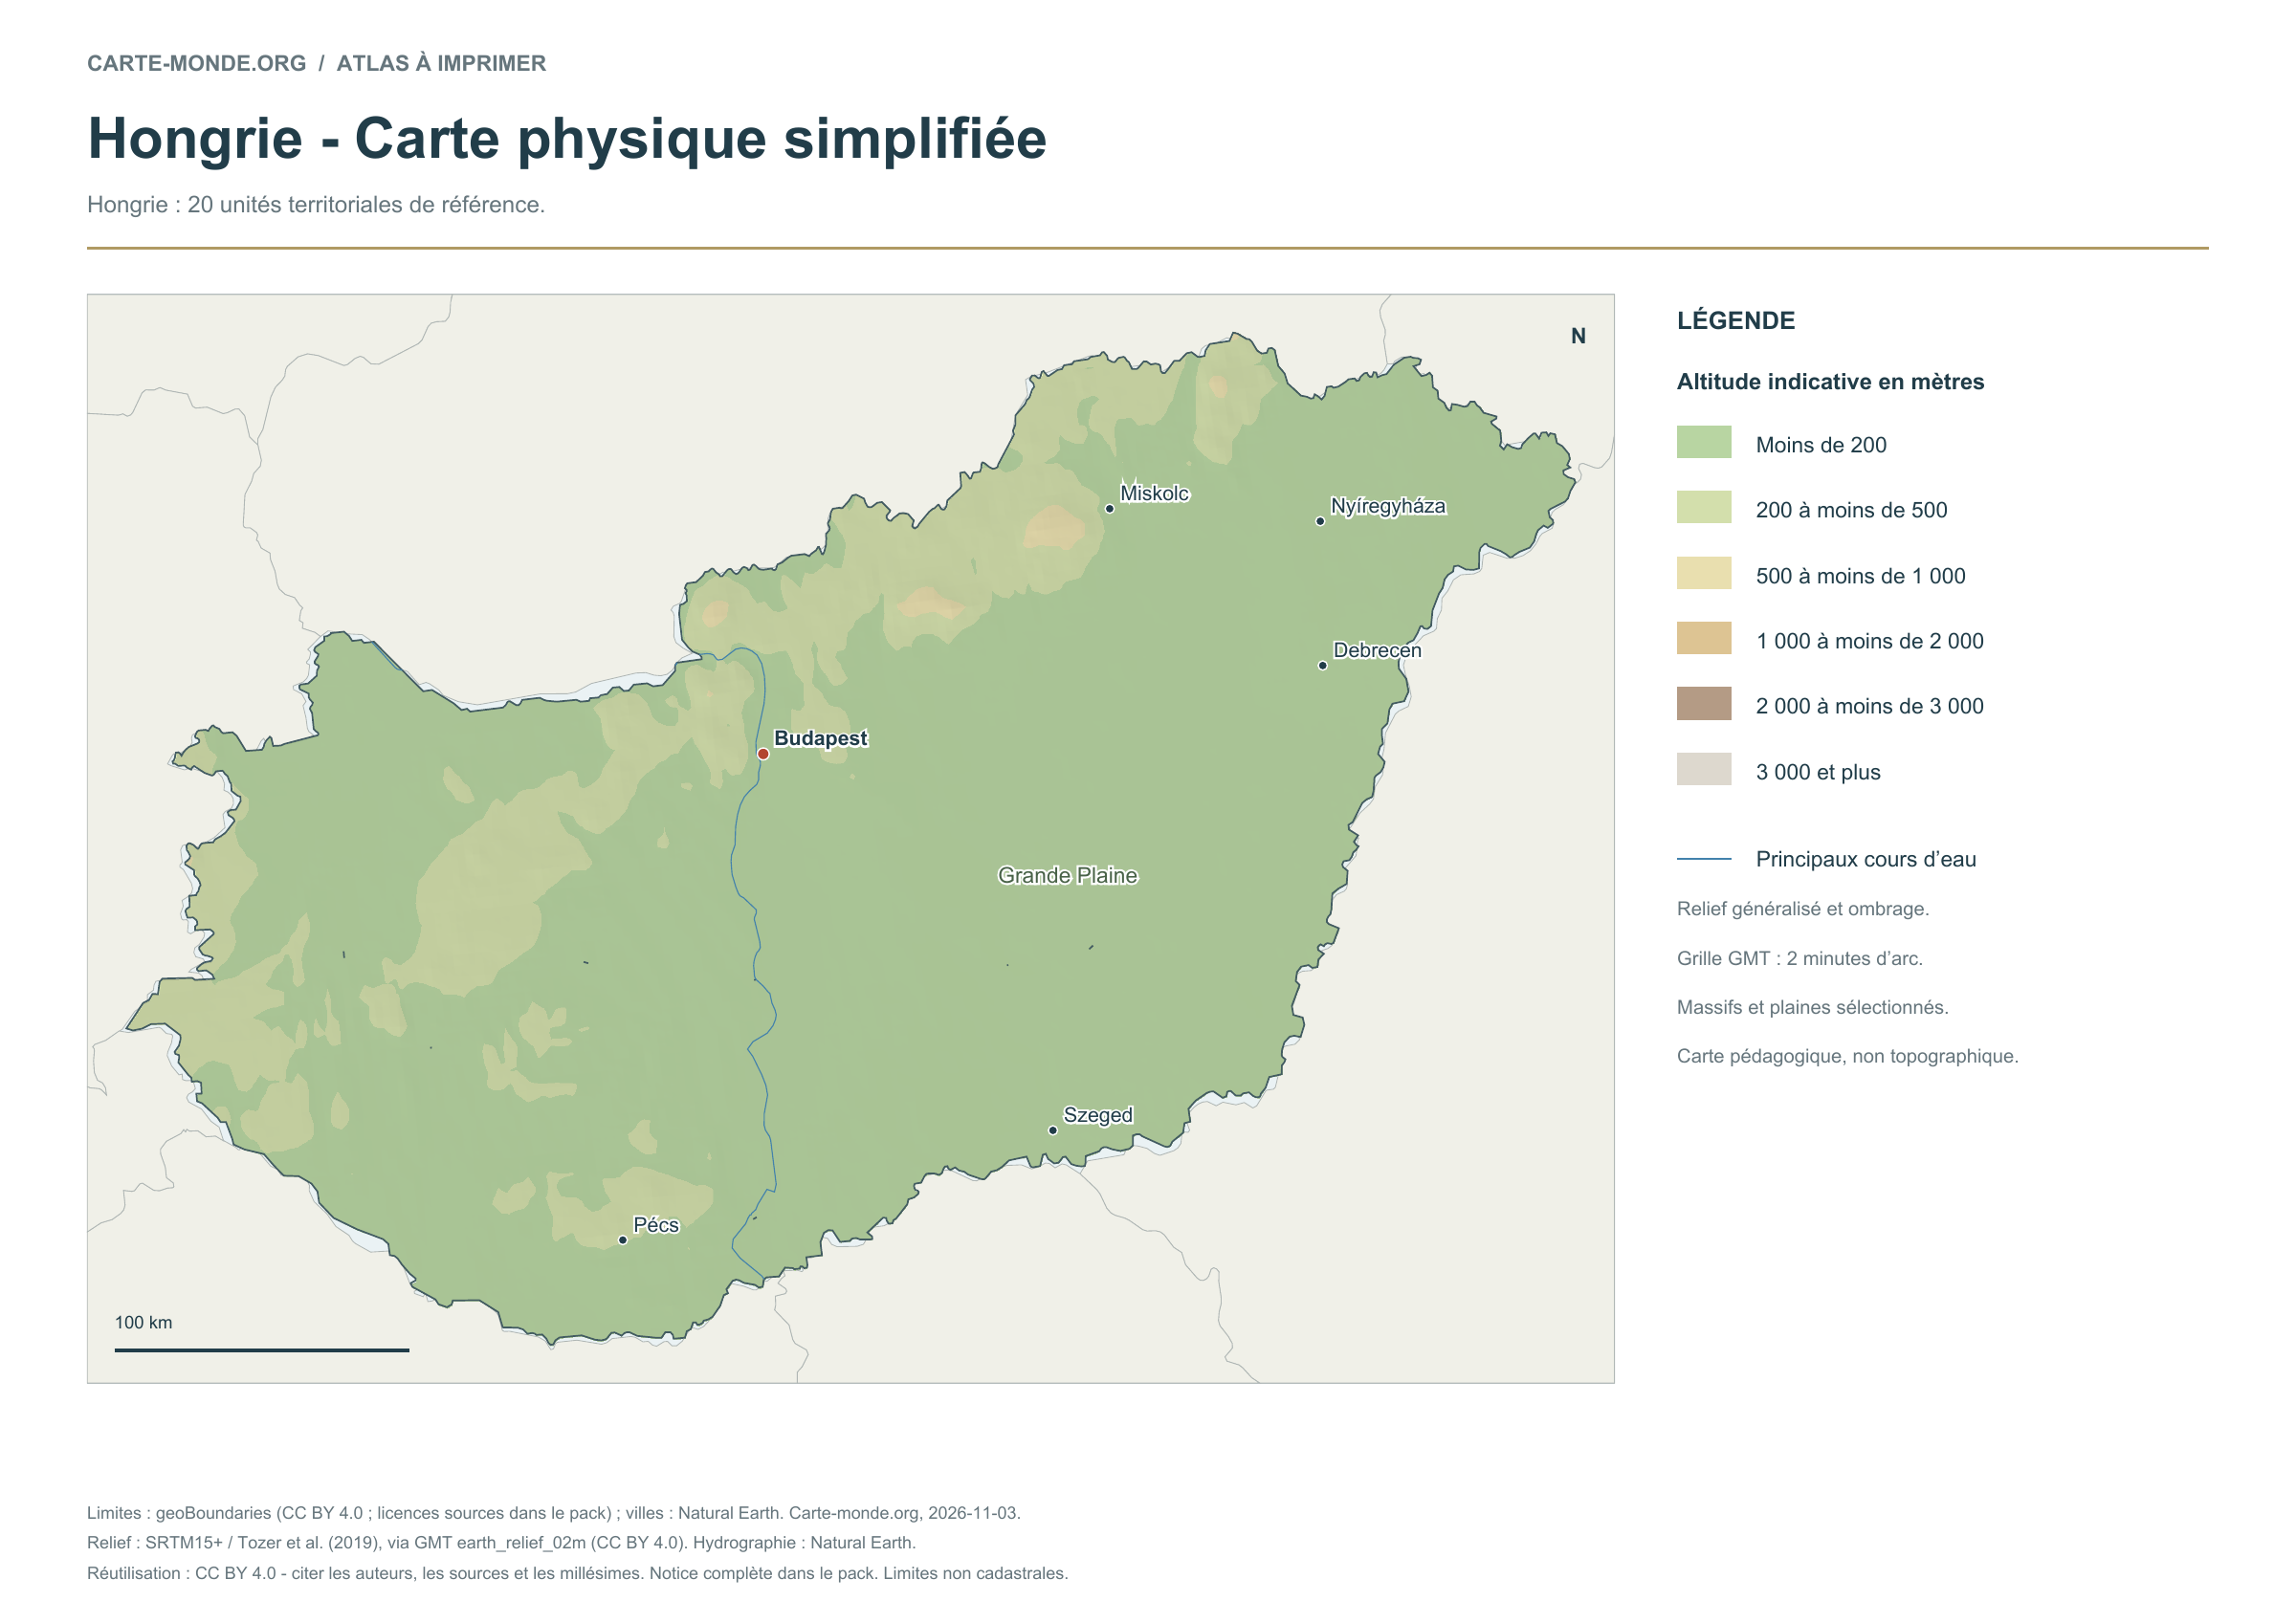
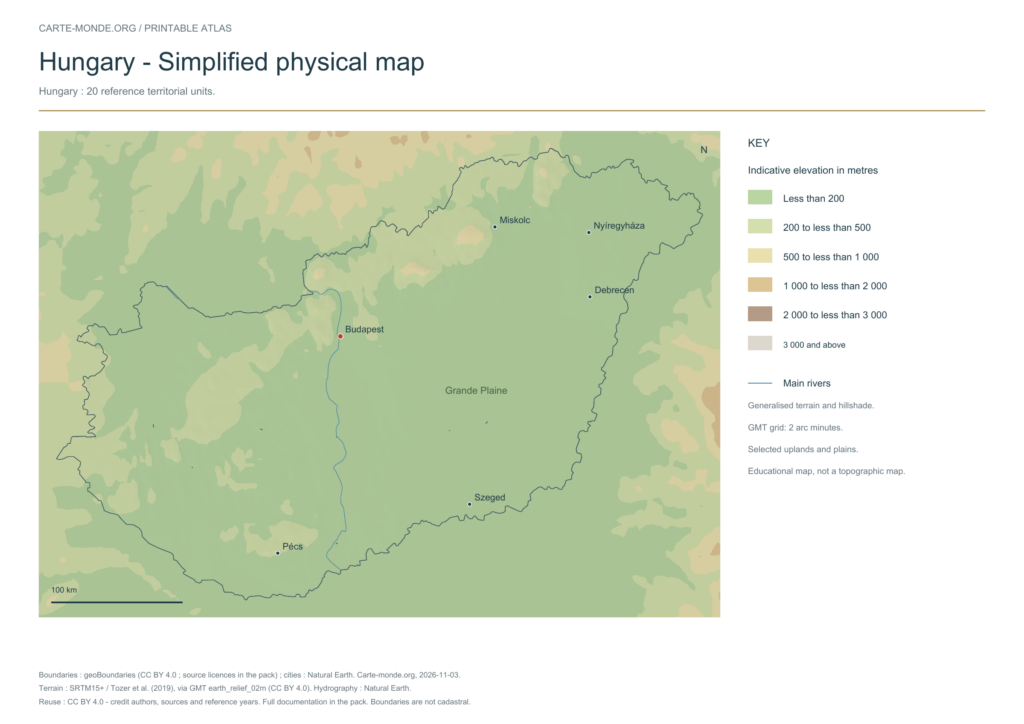
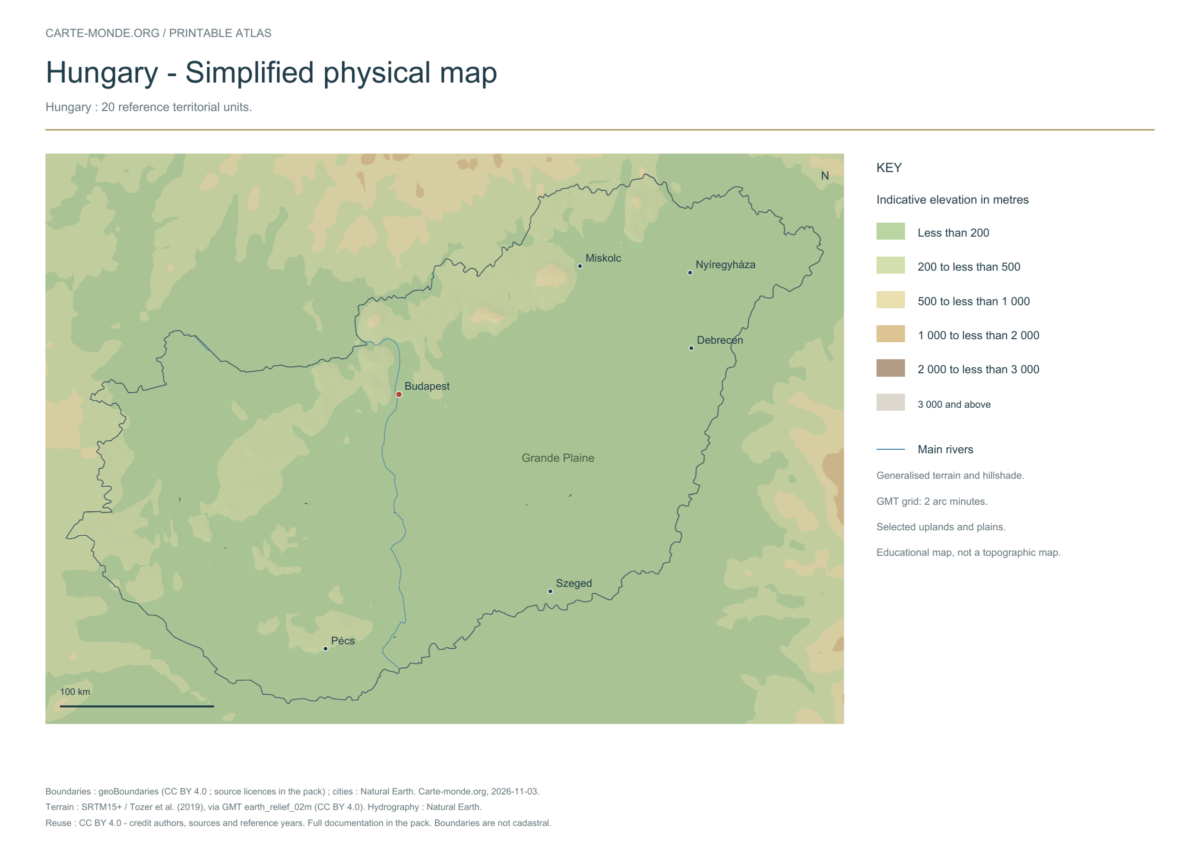
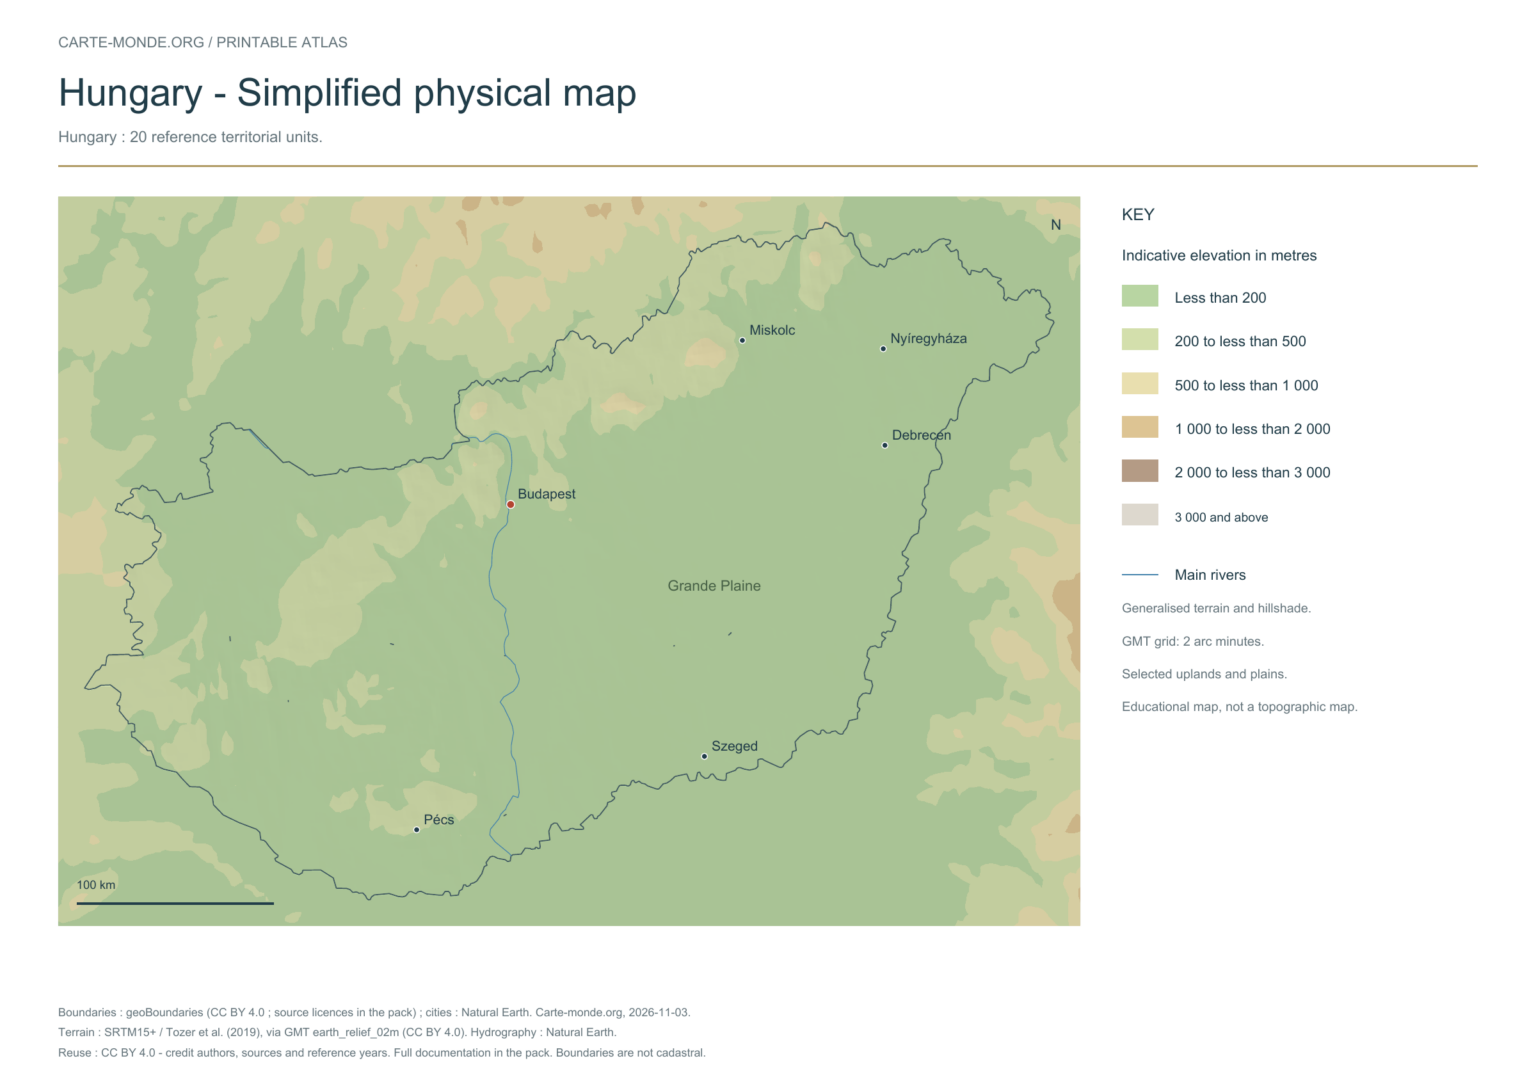
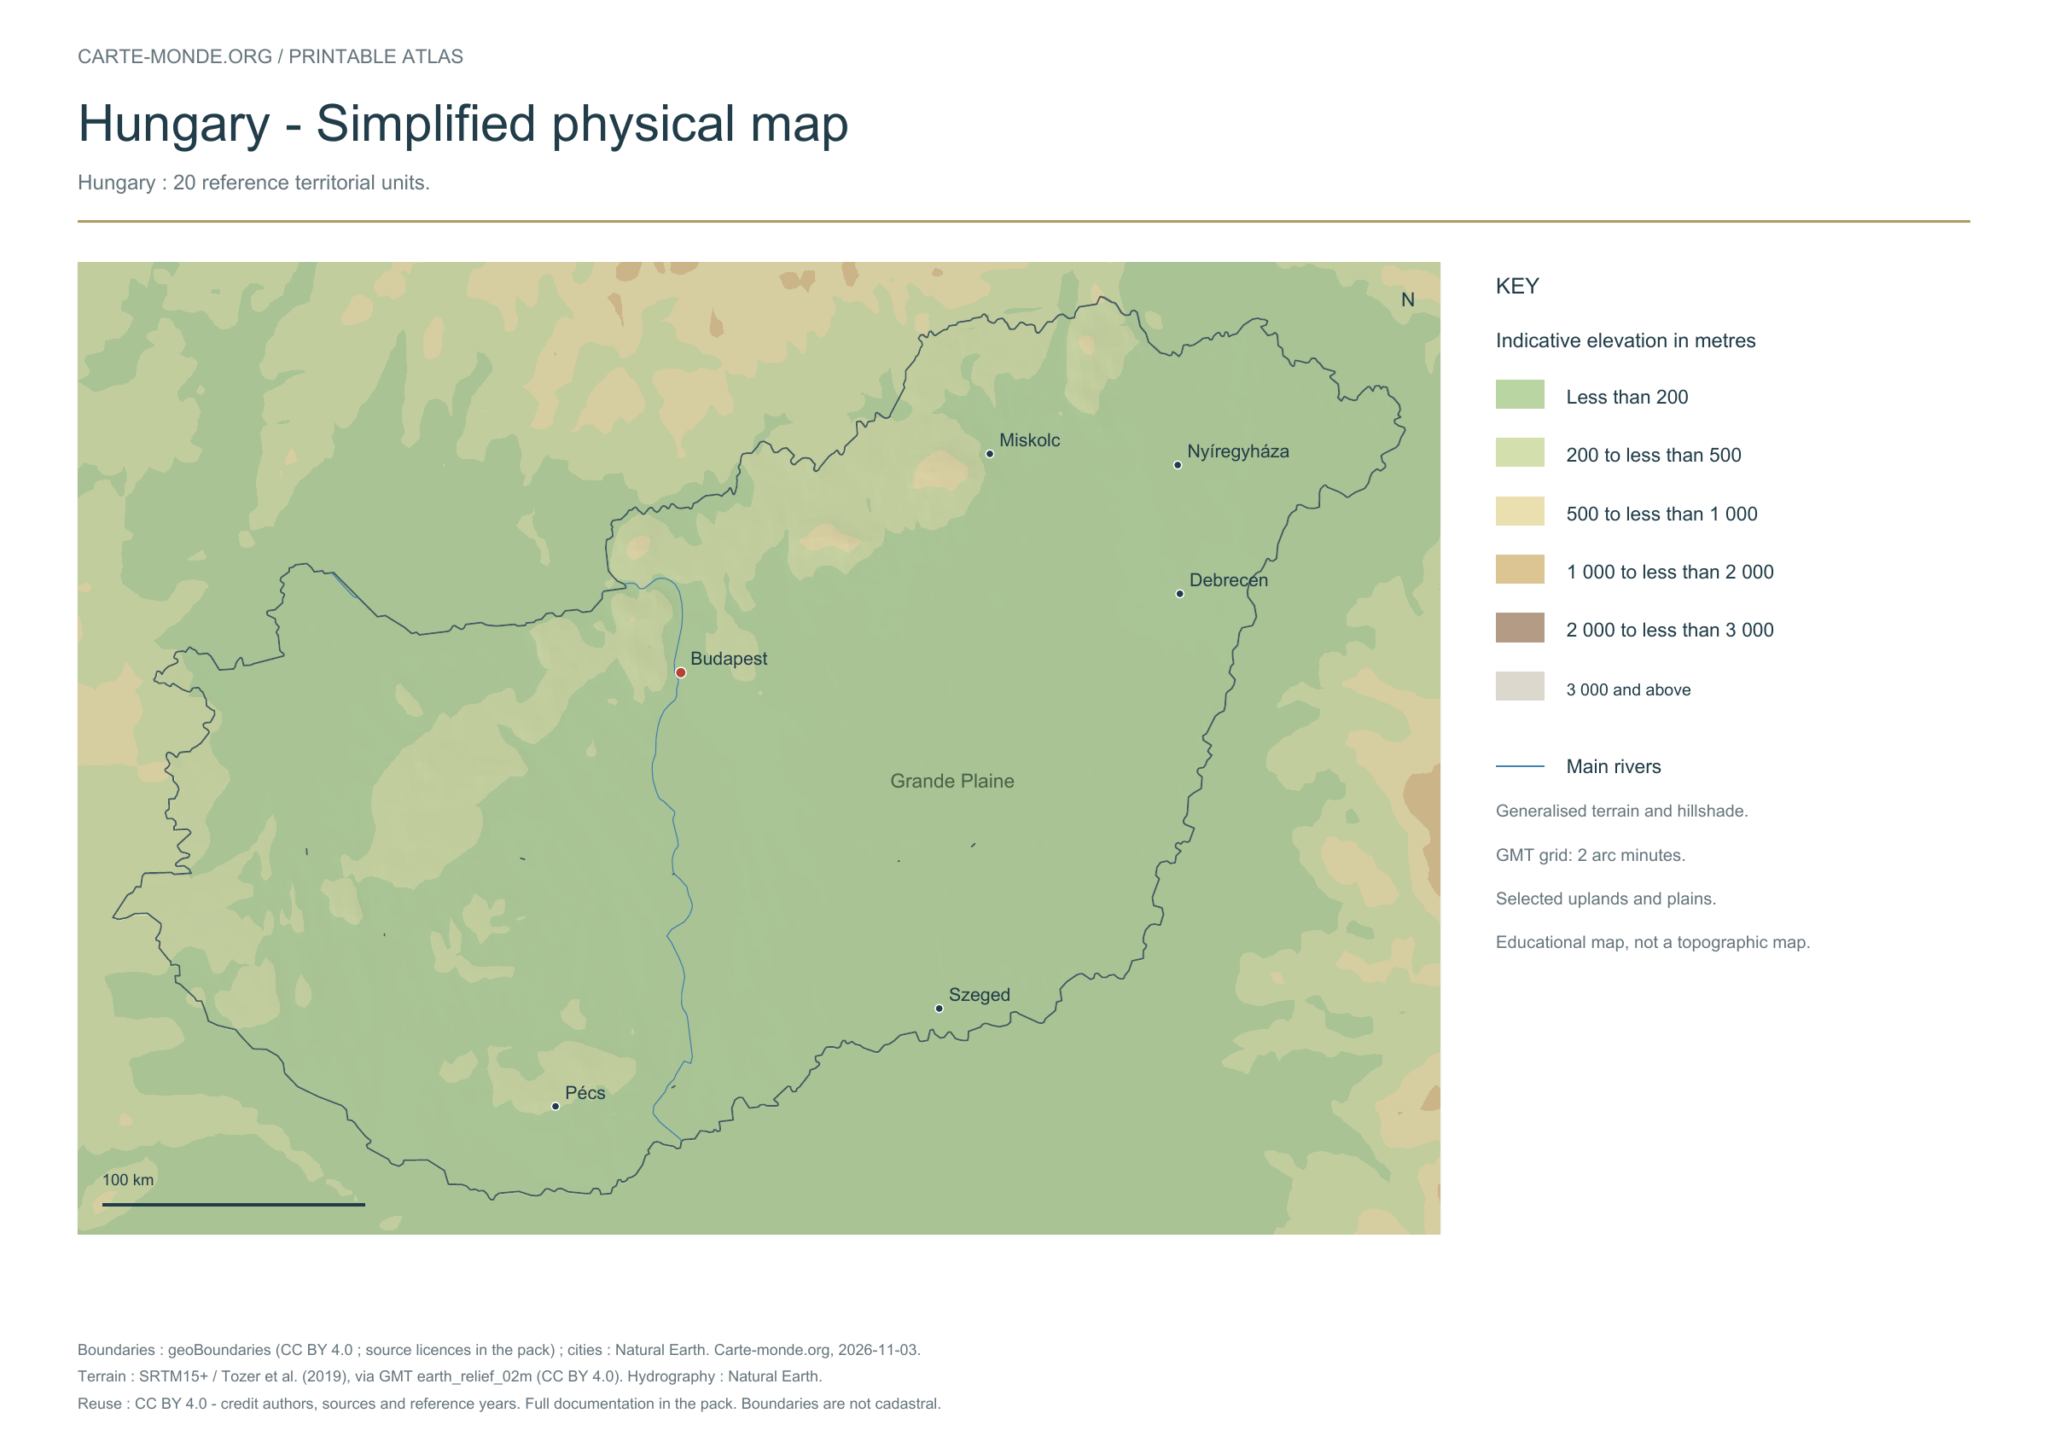
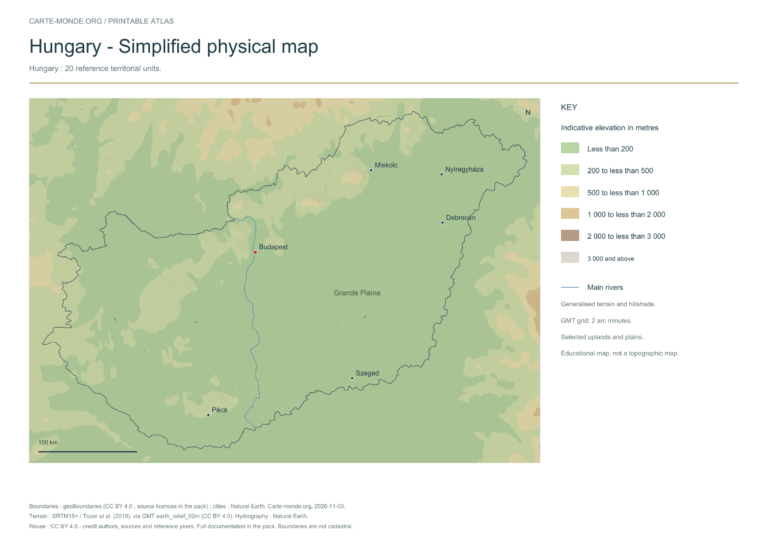
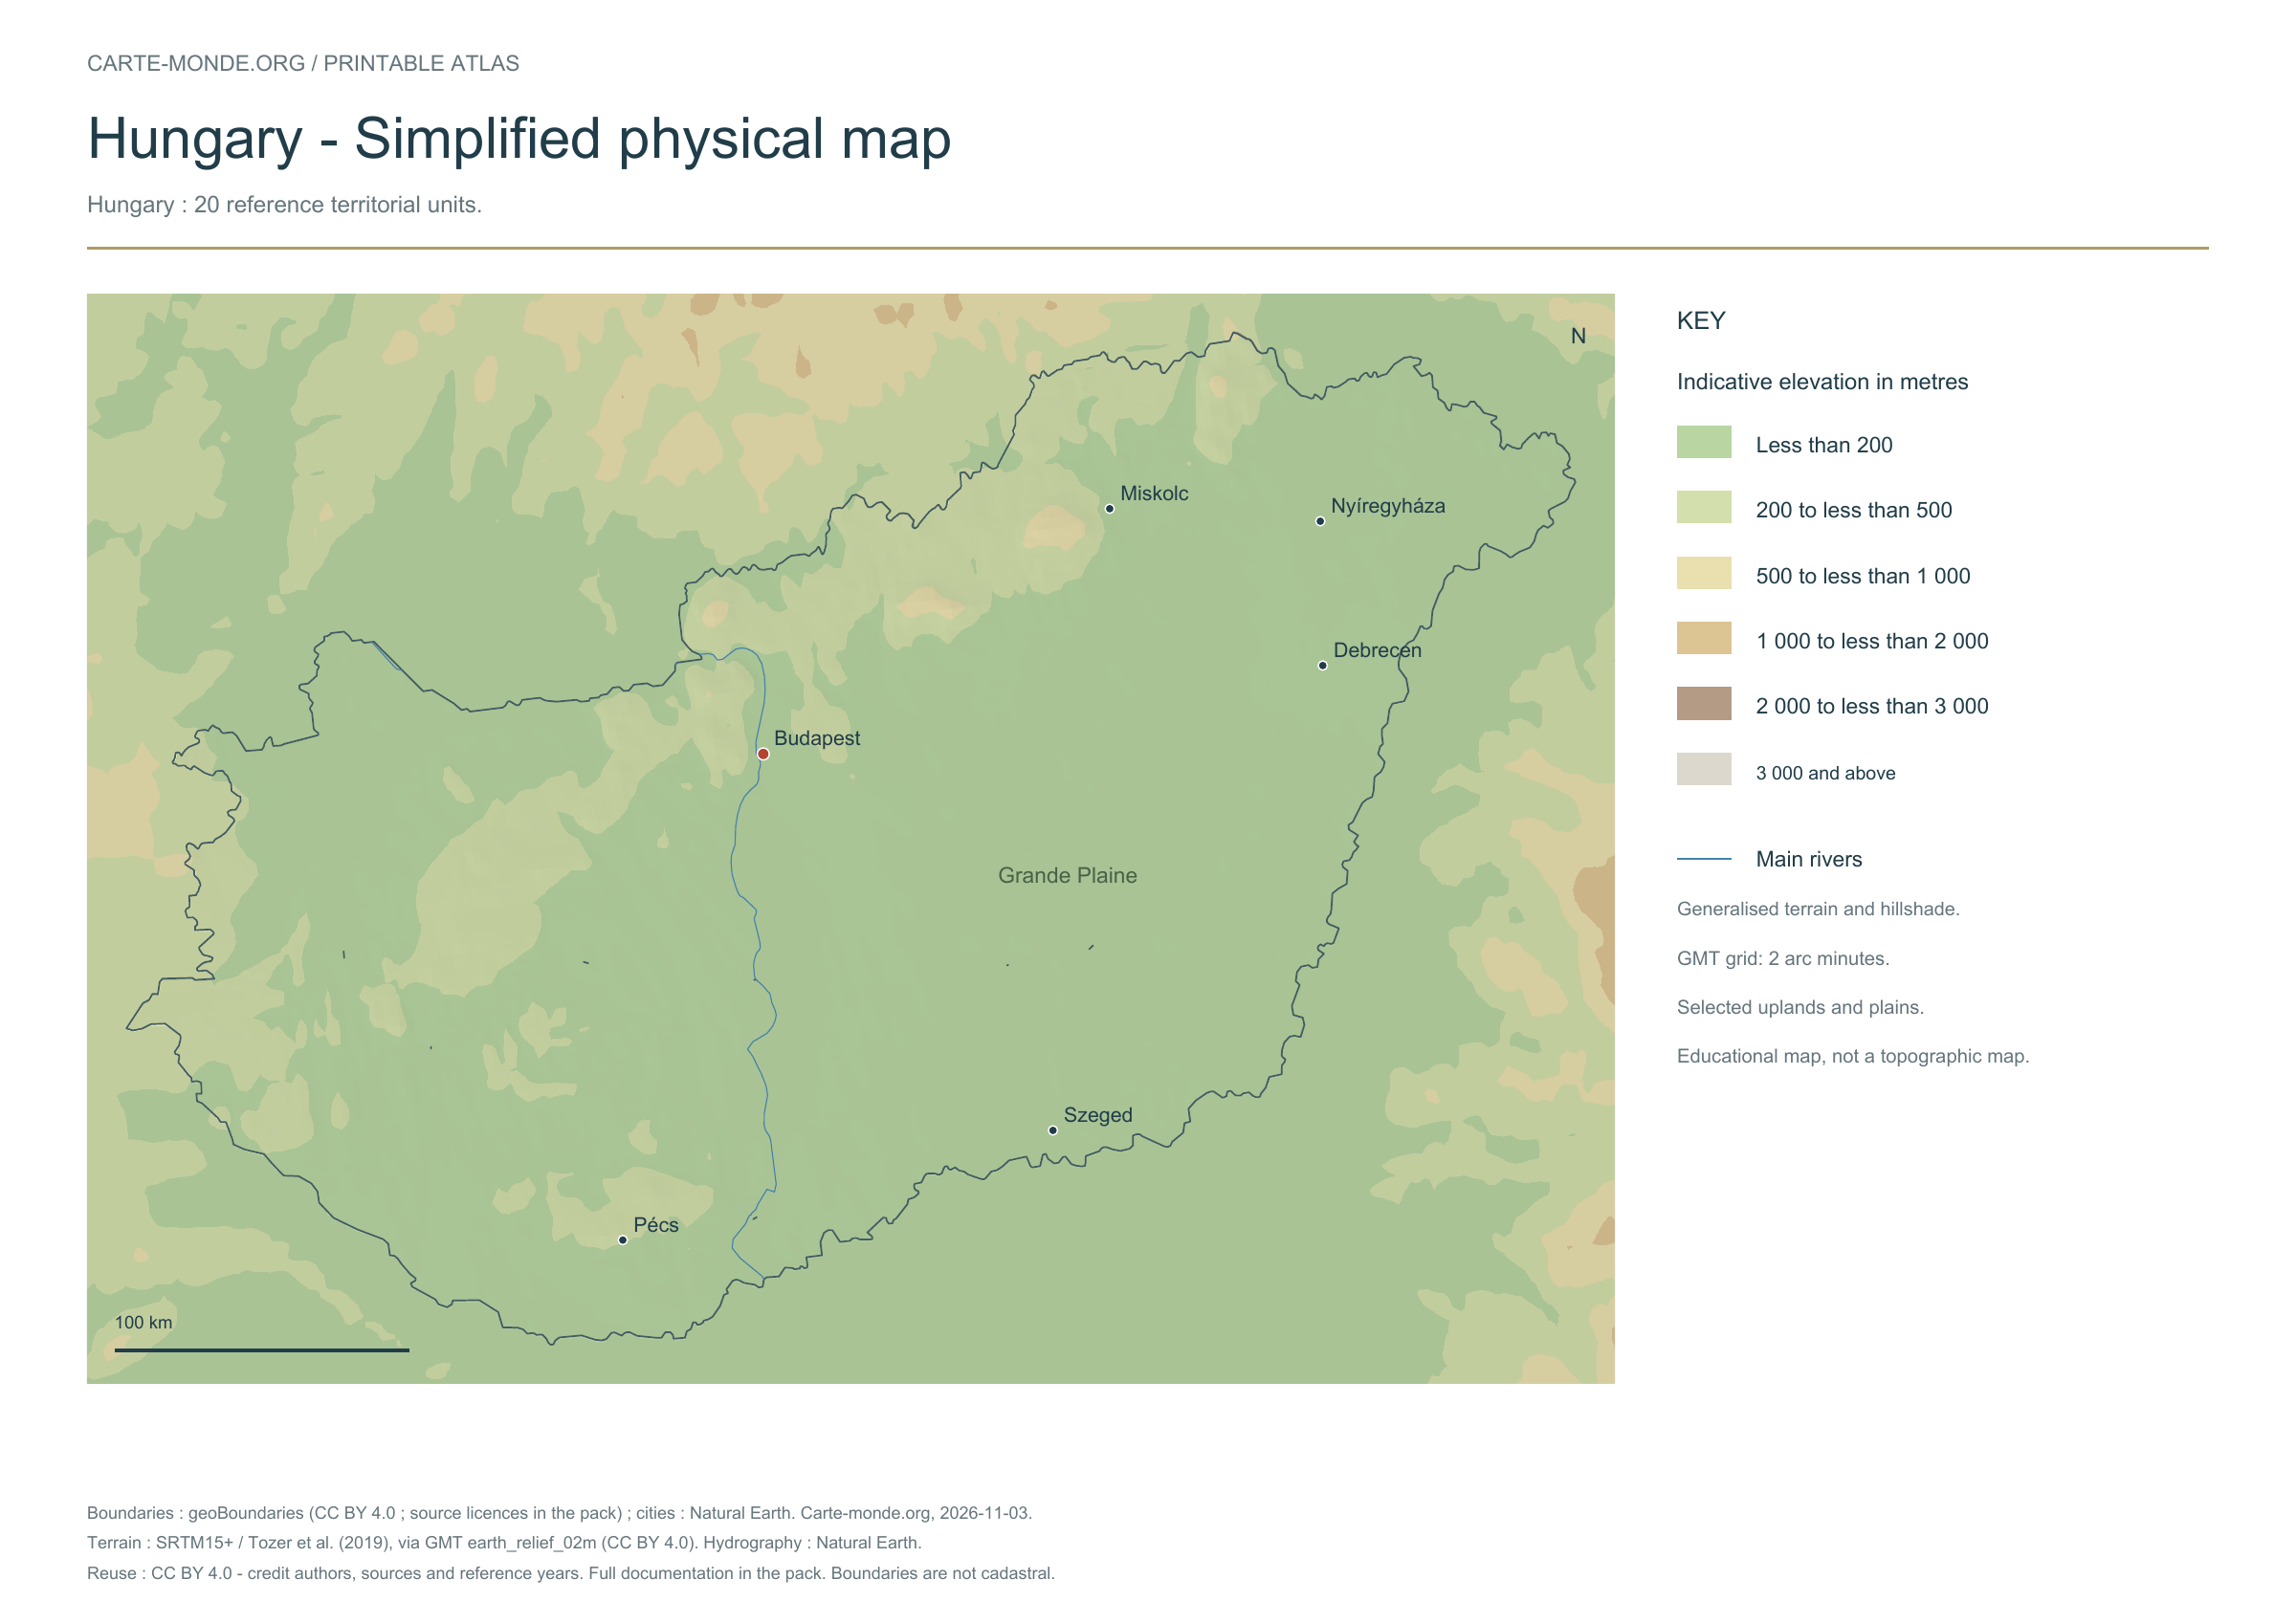
Simplified physical map — Hungary

Carte-monde.org · November 2026

Simplified elevations

Smoothed relief, elevation colours, main mountain ranges, plains and watercourses. Educational map at national scale.

A4 landscape PDF · PNG 2 400 px · CC BY 4.0

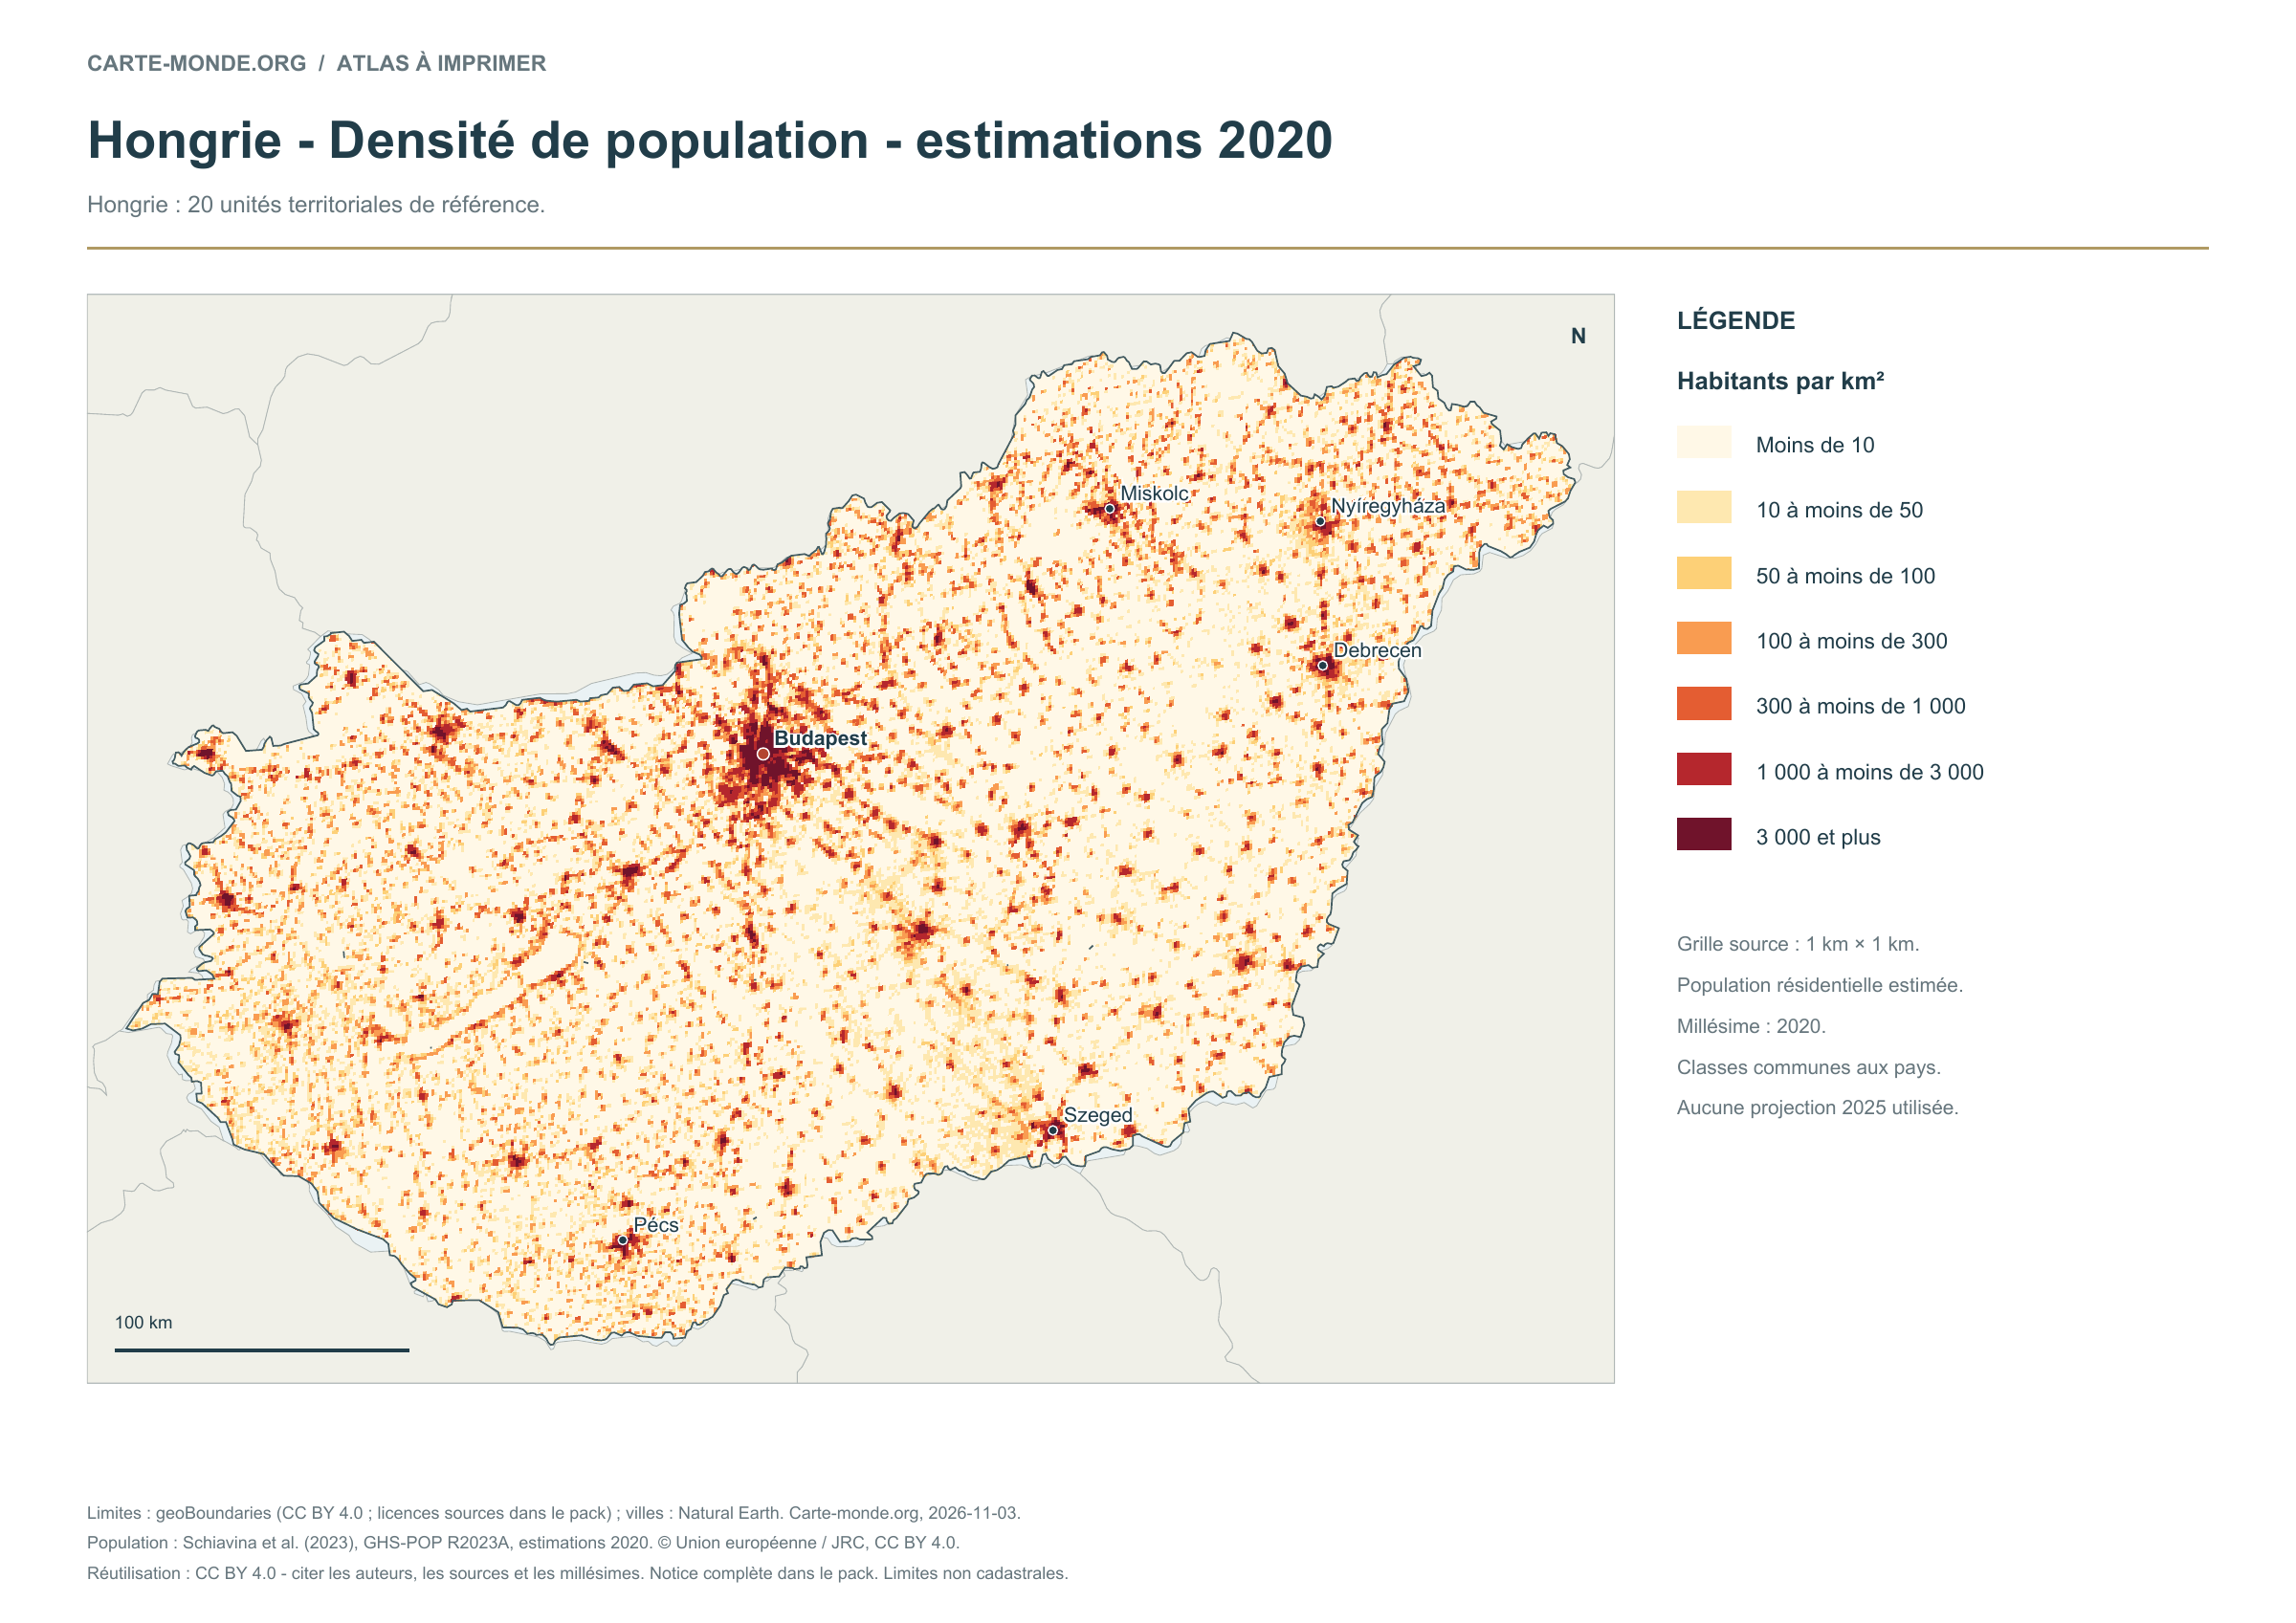
Population density: 2020 estimates

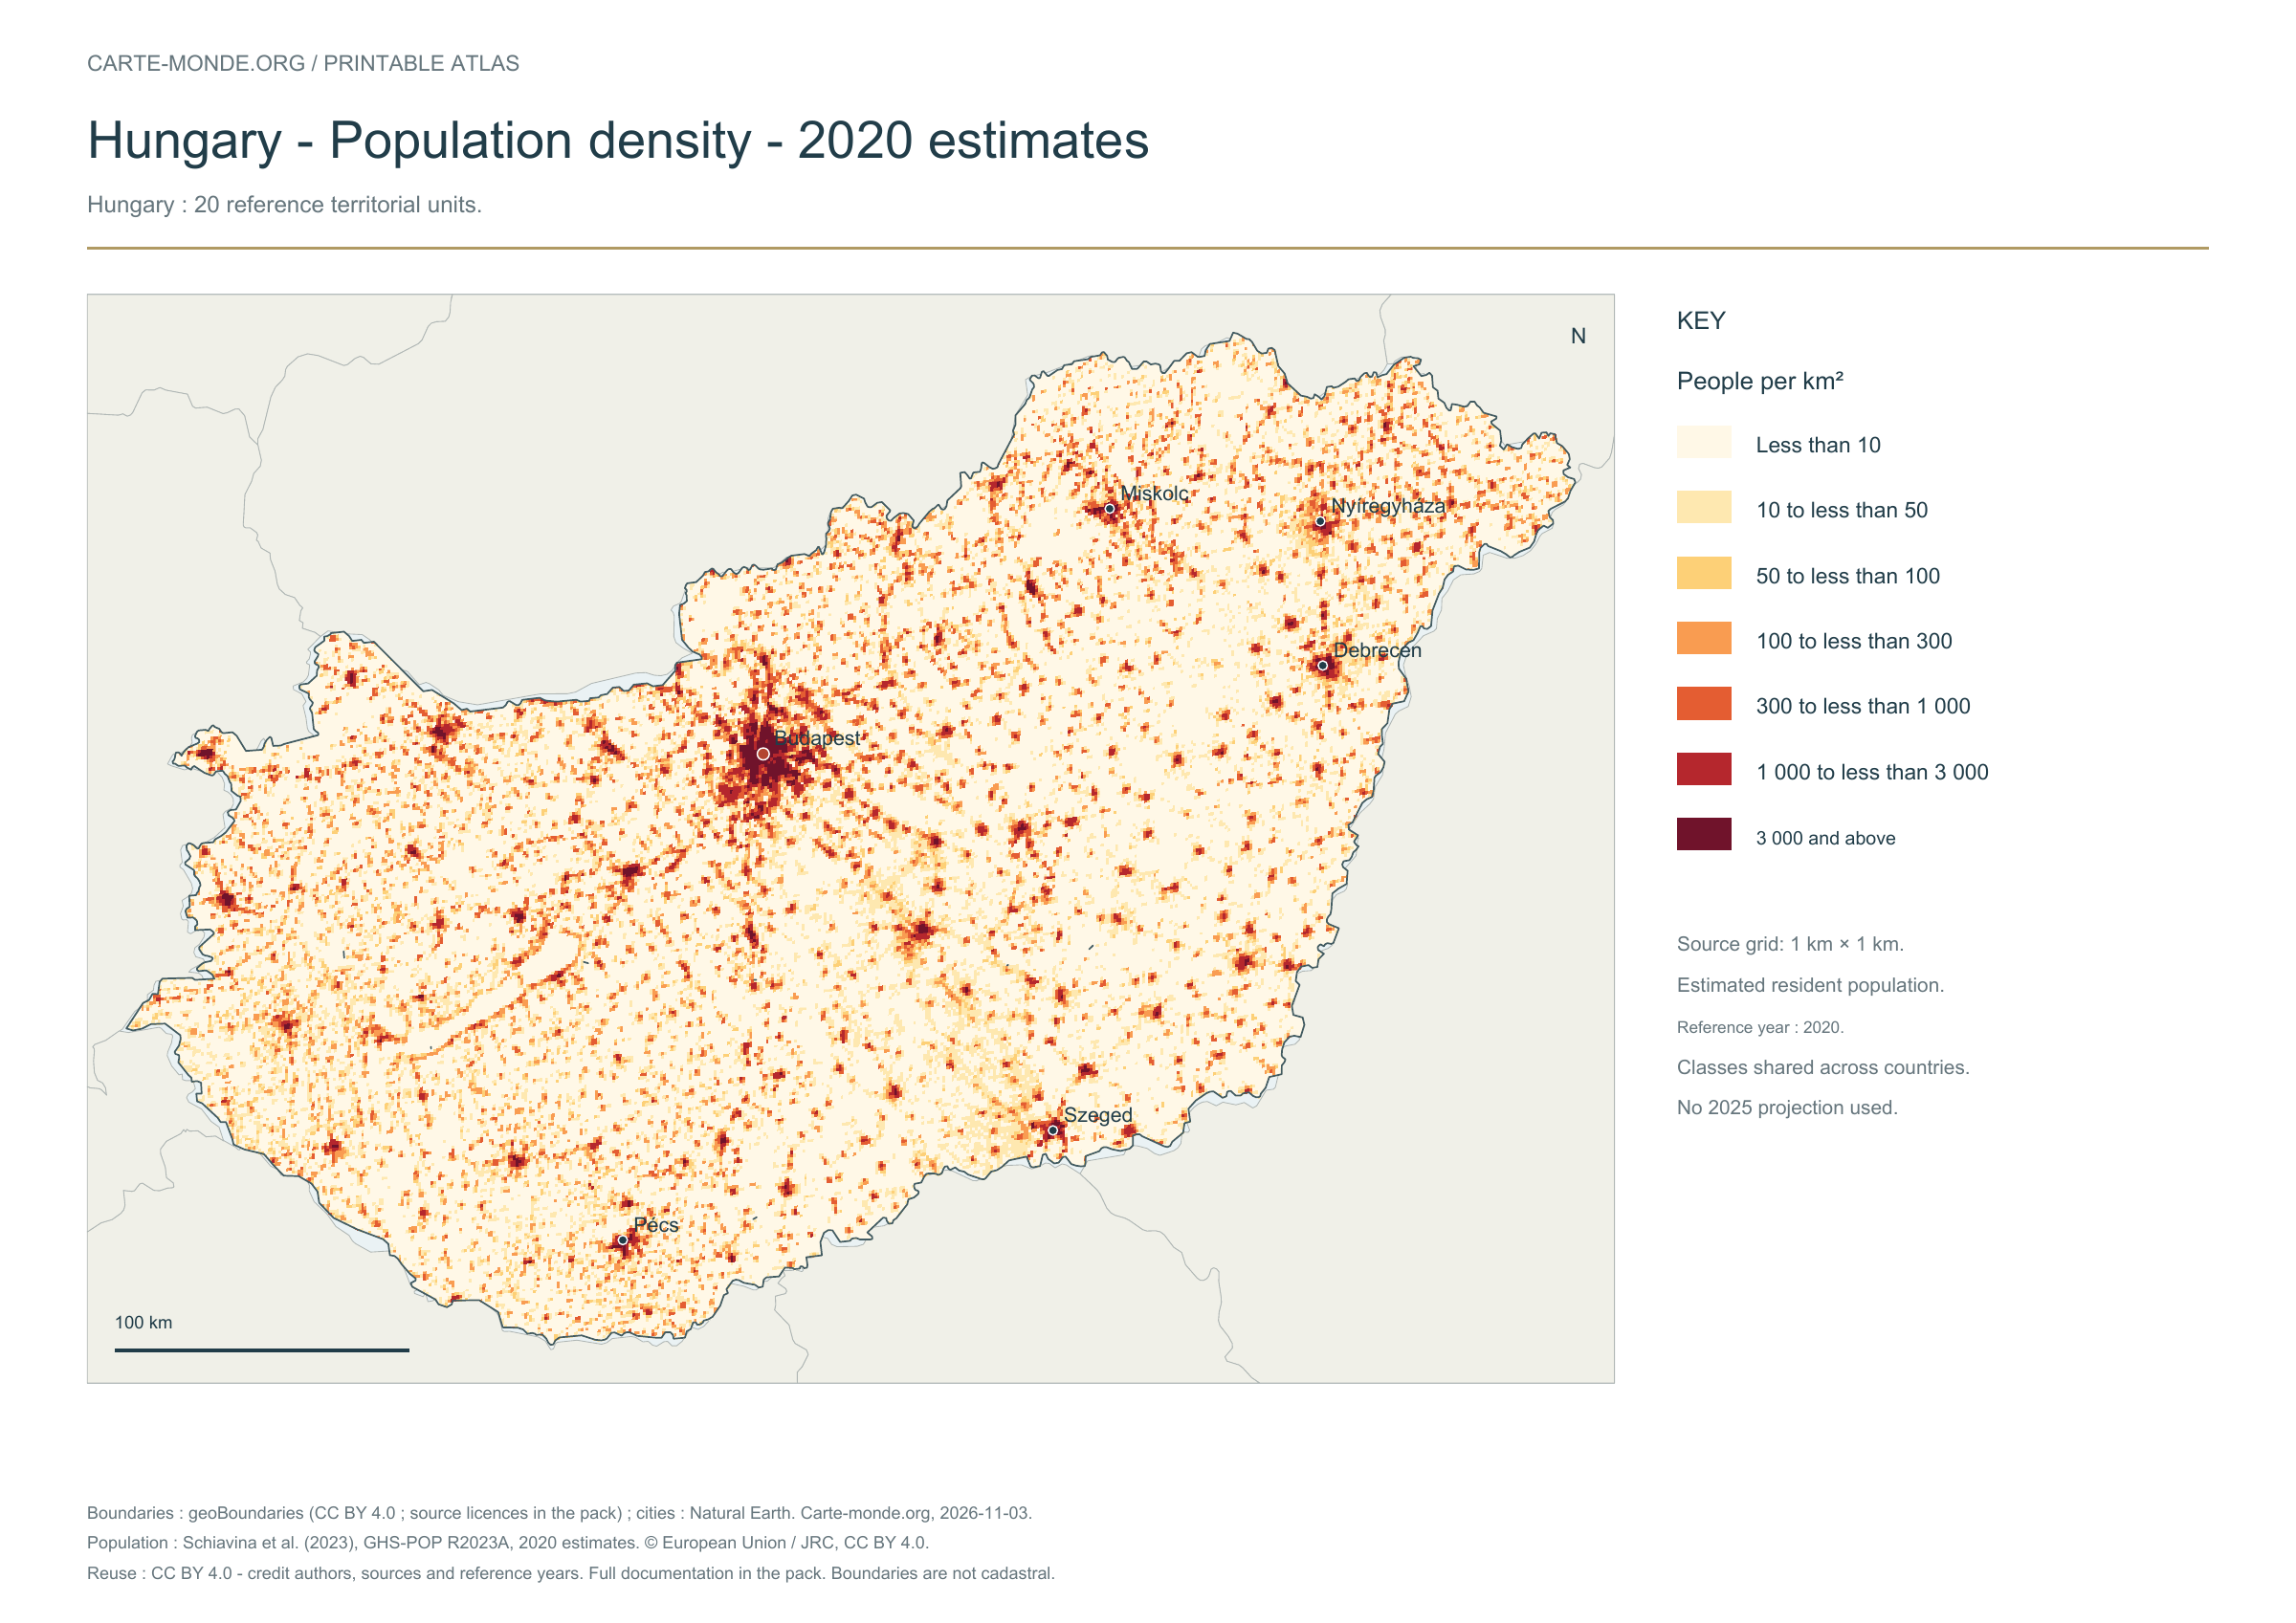
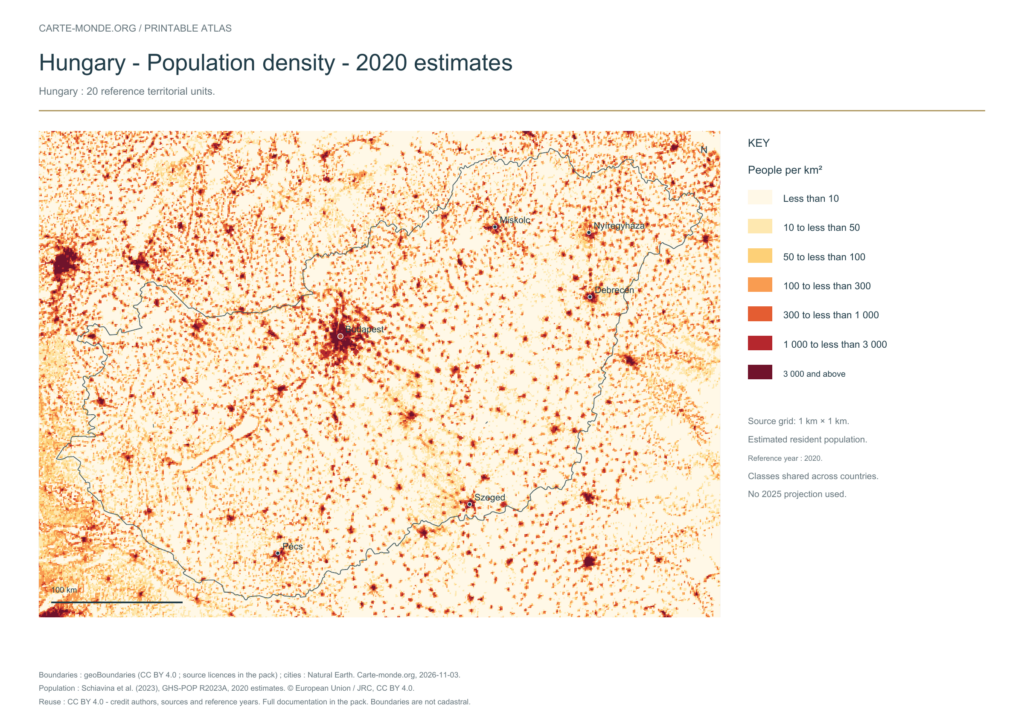
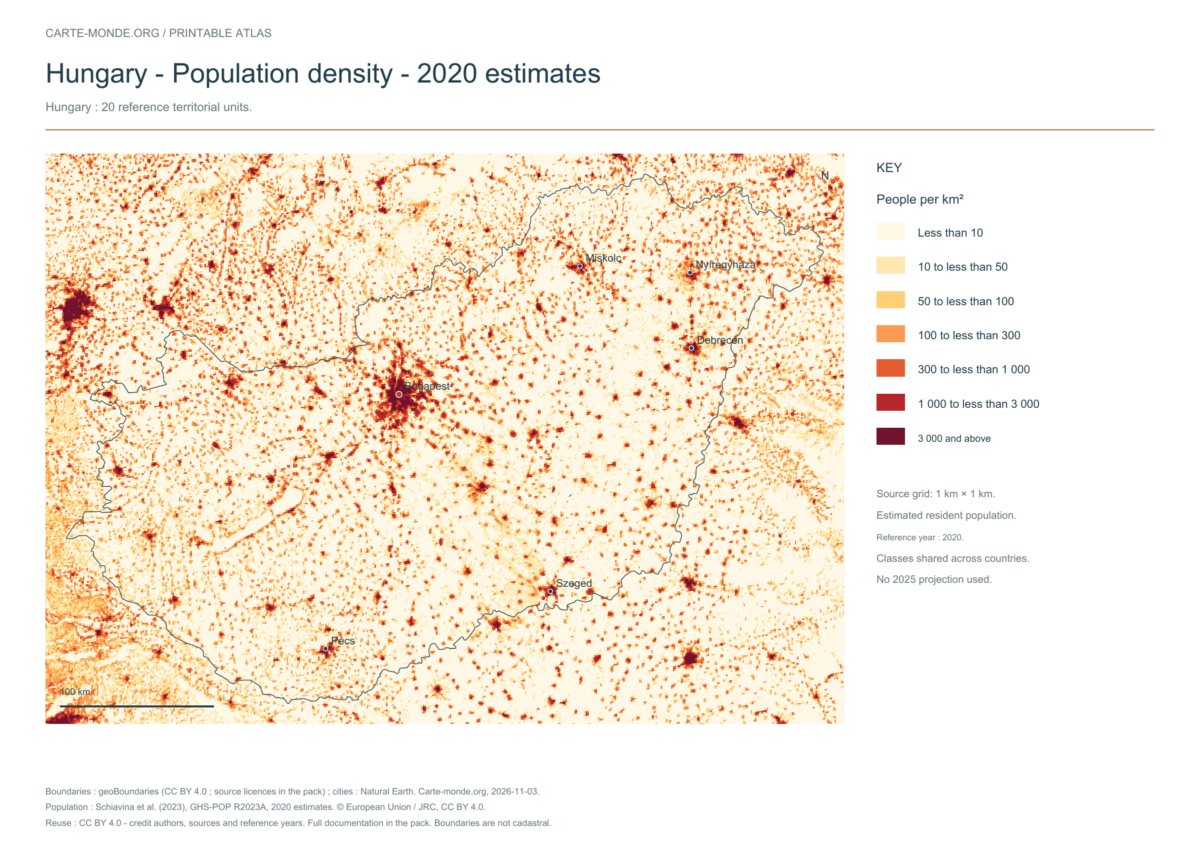
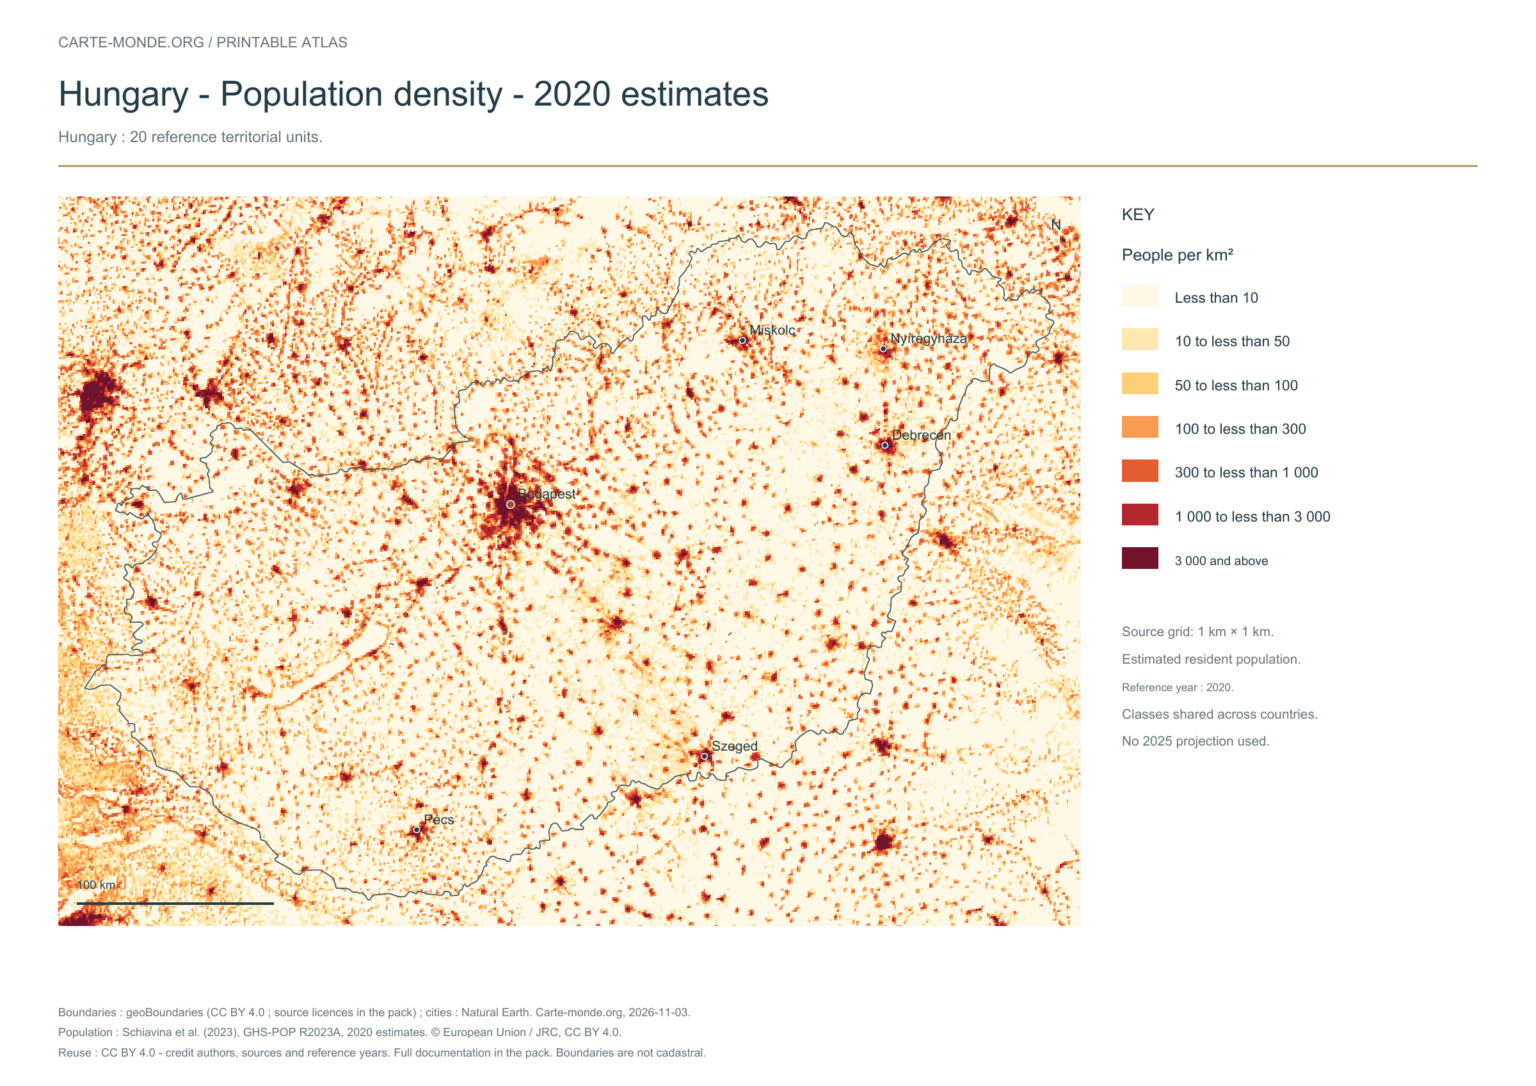
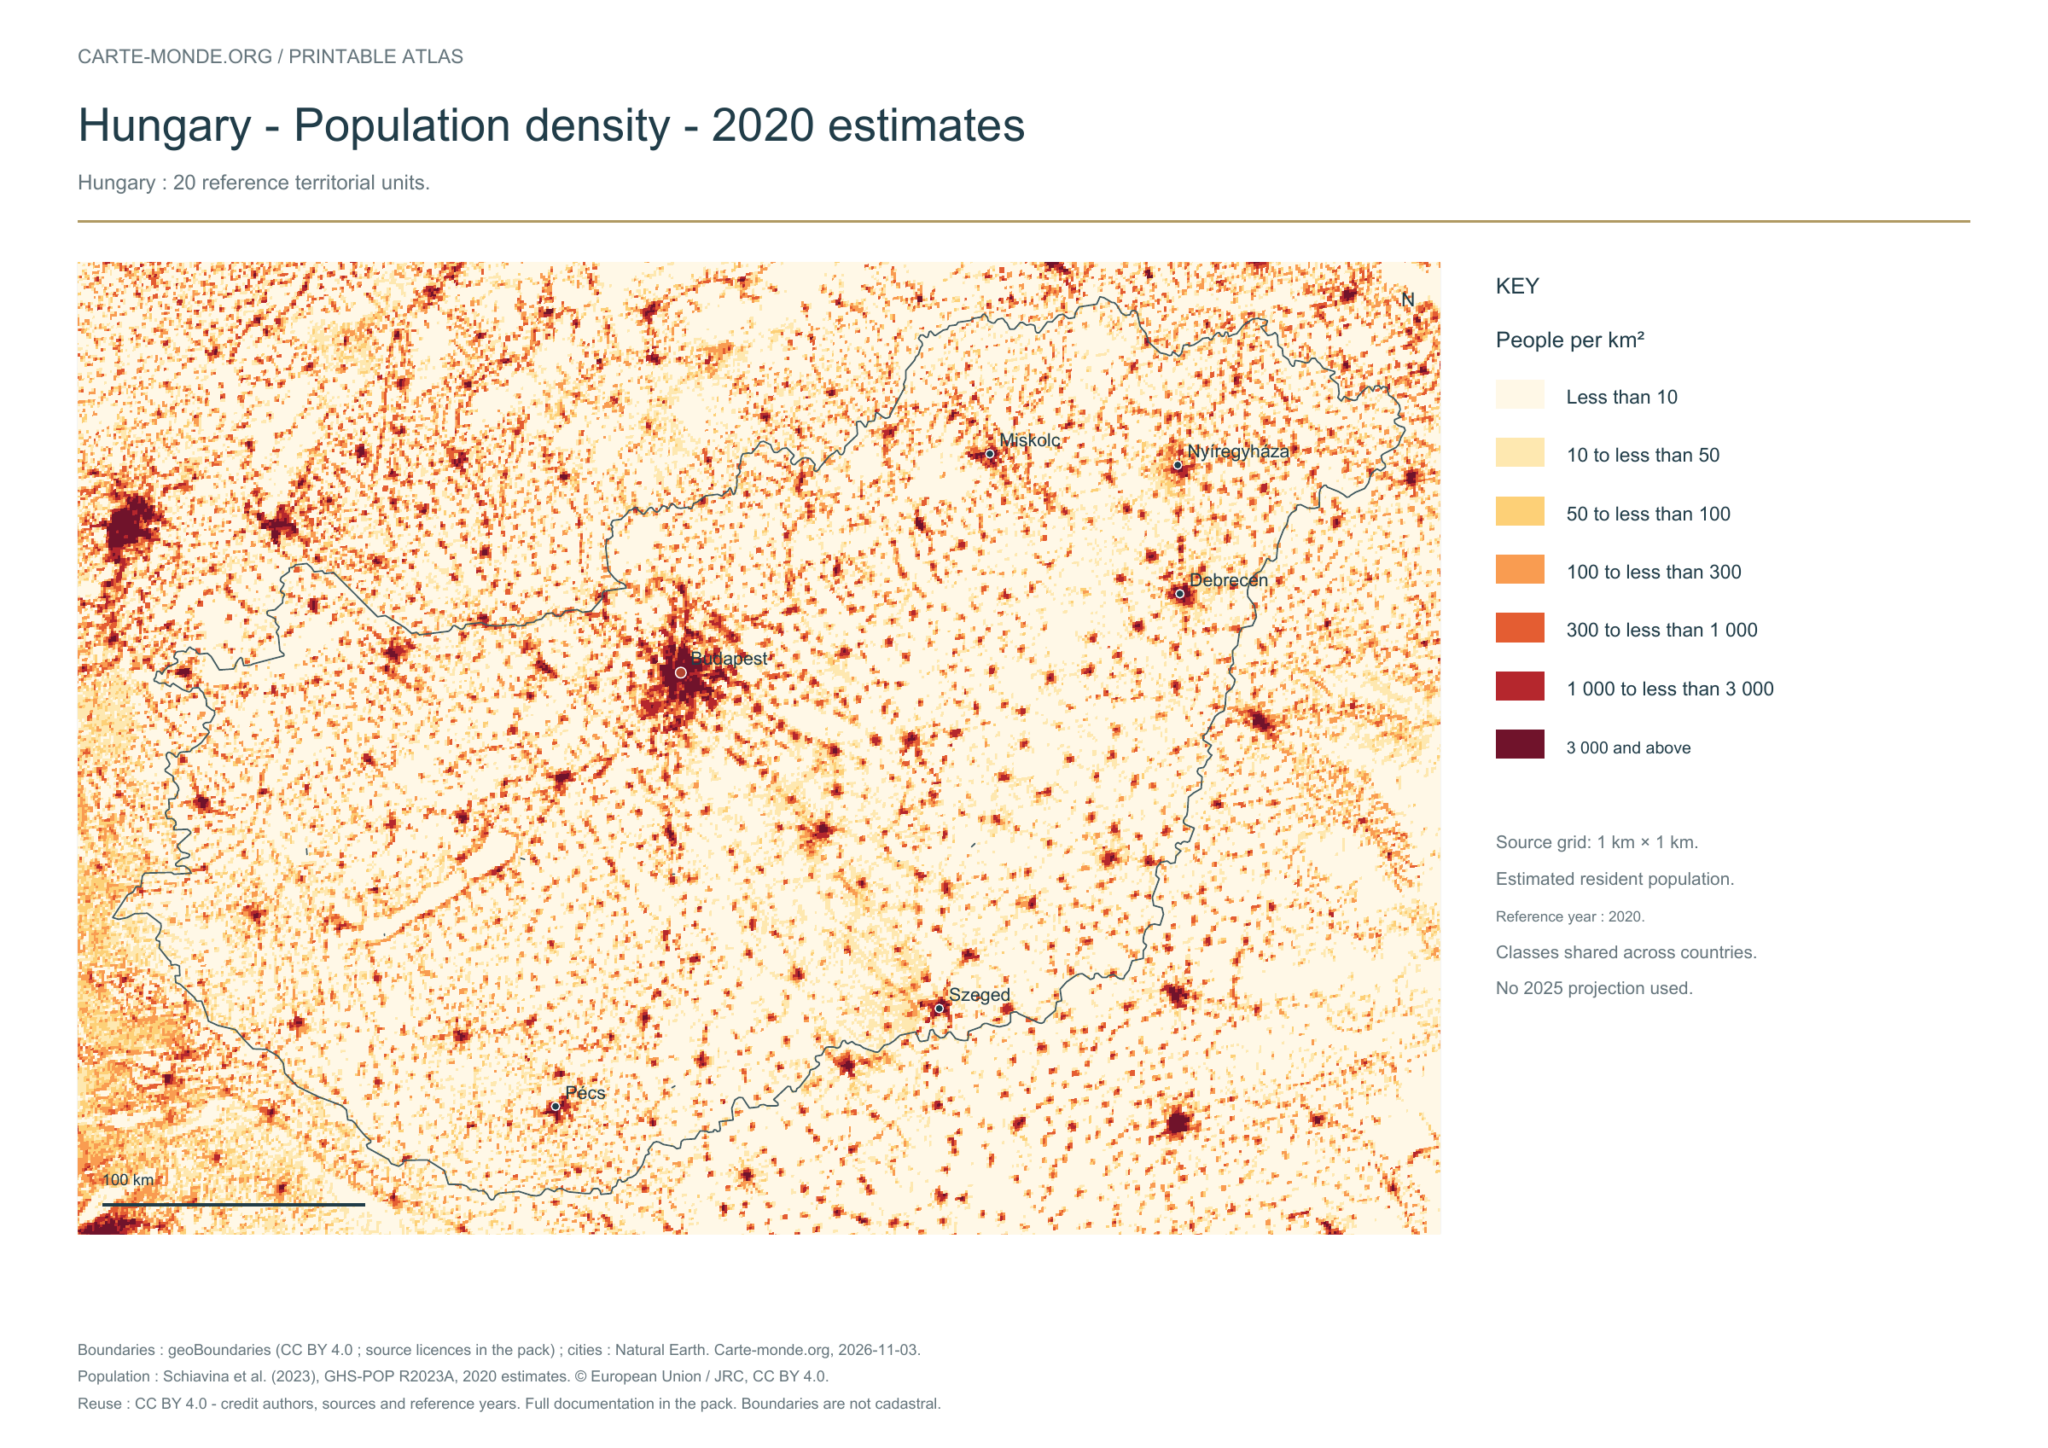
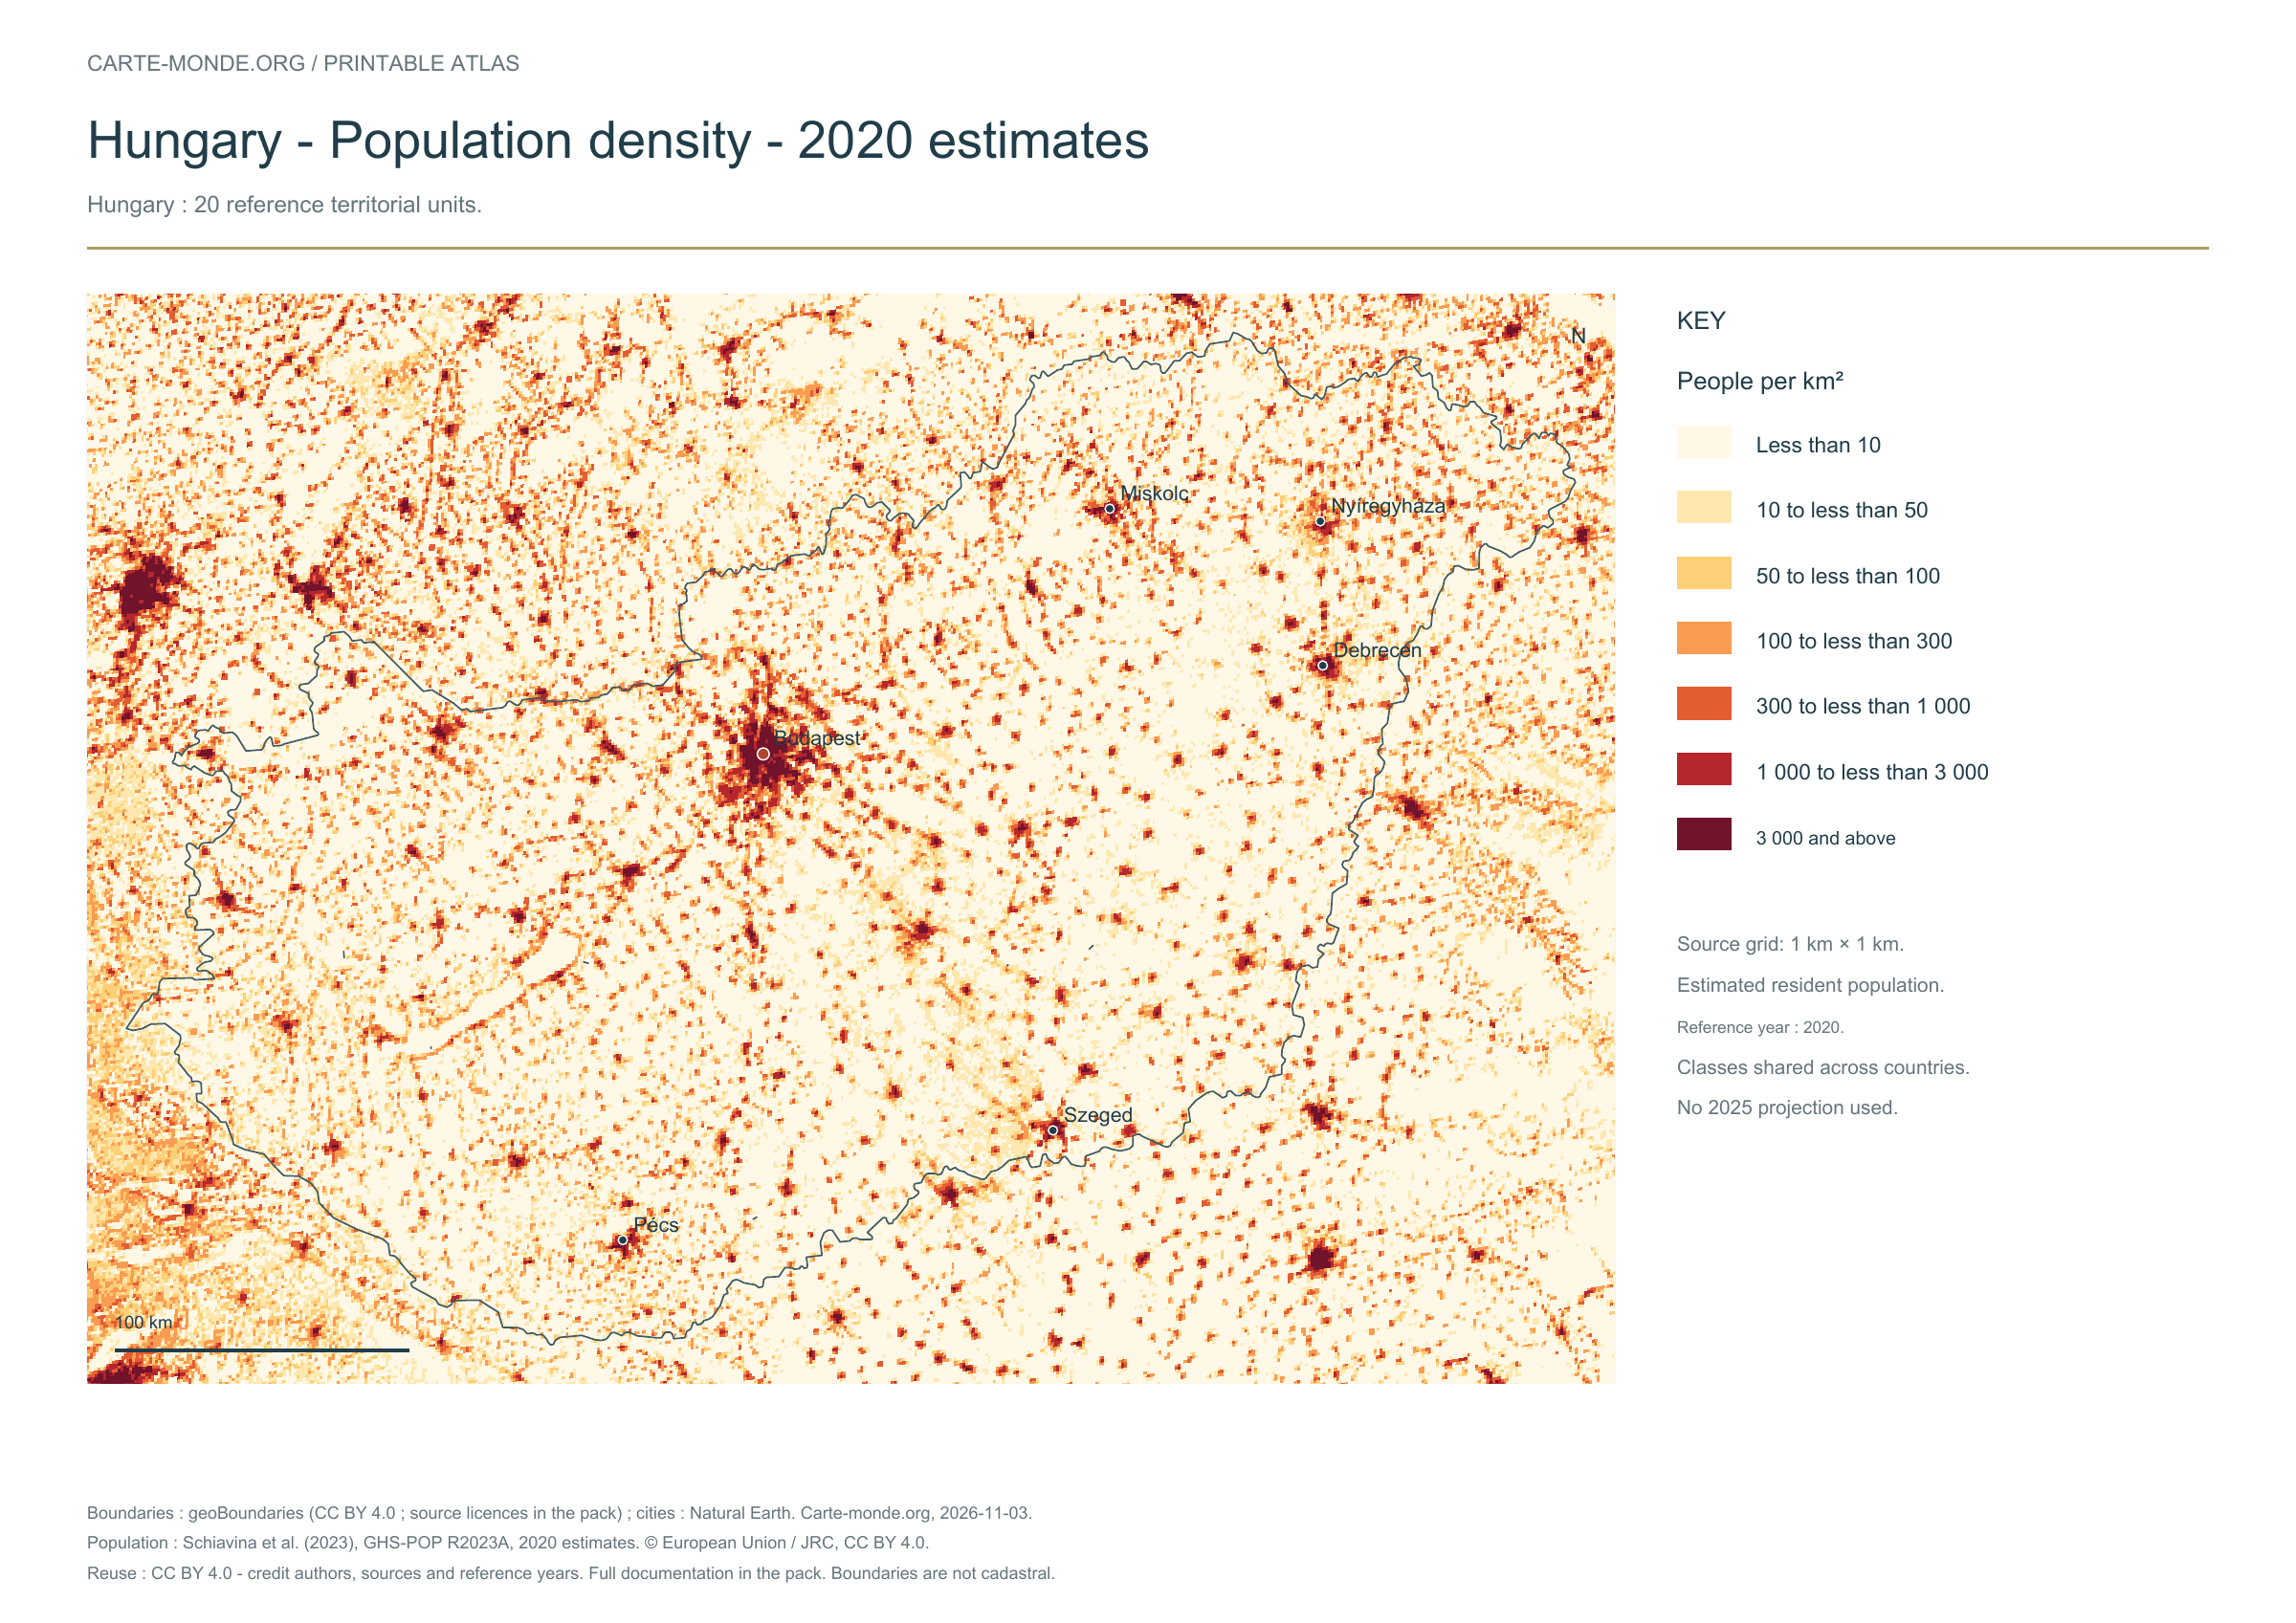
Population density — 2020 estimates — Hungary

Carte-monde.org · November 2026

Population density — 2020 estimates

Estimated residential population in 2020, on a source grid of 1 km². Inhabitants/km² classes are shared across countries; no 2025 projection.

A4 landscape PDF · PNG 2 400 px · CC BY 4.0

The data represents estimated residential population in 2020, on a 1 km² source grid. The document’s creation date does not change this reference year.

The five in-house maps in one pack

Regions and cities, location in Europe, simplified elevations, 2020 population density and shaded relief: five A4 PDFs, their PNGs and SVGs, with sources and licences.

Download the five maps — ZIP
Previous edition packs

The four maps in one pack

Four A4 PDFs, their PNGs and SVGs, with full notes. Terrain and density use an embedded image background; text and linework remain vector-based.

Download the Hungary pack — ZIP

Find the old maps of Hungary

Previously published maps remain accessible at their original URLs, with the collection’s text and credits.

Open the old maps of Hungary

Choose and print a map

Regions and cities show how the territory is organized; the location map places the country; terrain shows the main natural regions; density shows population distribution. Print the in-house PDFs in A4 landscape with “Fit to page”. Insets have their own scales.

For exercises: six blank base maps of Hungary.

Sources, reference years and reuse

Administrative boundaries: geoBoundaries / geoBoundaries, Wikimedia Commons. Hungary — Geographical data year: 2011. The file edition date does not mean all boundaries have been updated. Budapest has been restored from Natural Earth 5.1.1 in the simplified file. Boundary source and terms. Primary licence: CC0 1.0 Universal (CC0 1.0) Public Domain Dedication. The geometries used and credits are included in the pack; derived databases under ODbL remain under ODbL.

Neighbouring area, cities and hydrography: Natural Earth 5.1.1, public domain, generalised boundaries not for cadastral use.

Relief: SRTM15+ / Tozer et al. (2019), reference publication, via GMT earth_relief_02m derived from SRTM15+V2.7. Grid smoothed to two arc minutes, suitable for a national overview, without topographic precision.

Population: Schiavina et al. (2023), GHS-POP R2023A, 2020 residential estimates, © European Union / JRC, CC BY 4.0. The 1 km² Mollweide cells are expressed in inhabitants/km². Methodology: Pesaresi et al. (2024).

The four new maps: created by Carte-monde.org, November 2026, under CC BY 4.0. Cite authors, sources and reference years, and indicate adaptations. Additional and older maps retain their own rights.

Country maps · Other maps and archives

Previous versions: maps and files preserved

These files remain available at their original URLs. For corrected maps, use the main links above. Each edition retains its credits and date.

Raster base map, cities, rivers and lakes: Natural Earth, public domain. Other boundary credits and licences are retained in the pack. Cartographic work CC BY 4.0; ODbL-derived data retains its licence. No topographic accuracy is claimed.

Previous collection — original files preserved
Flag of Hungary
Flag of Hungary
Downloadable Maps of Hungary
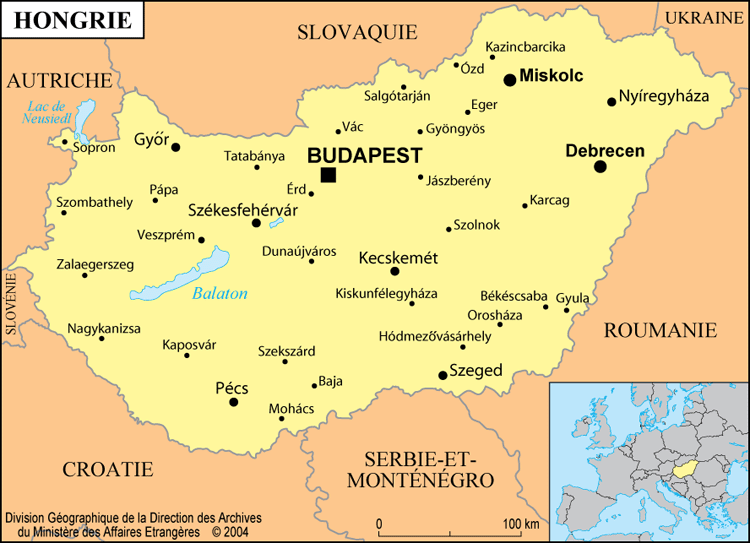
general map of Hungary
Map of Hungary
Map of Hungary
Relief map of Hungary
Original French files
Previous language edition

Maps of Ireland: regions, cities, relief and population

Flag of Ireland
Flag of Ireland

IRELAND · PRINTABLE MAPS

Five printable maps of Ireland: regions and cities, location in Europe, two views of the relief and population. PDFs, images and sources are available below.

Our five maps have English labels. Maps from other publishers retain their original language.

Regions, cities and location in Europe

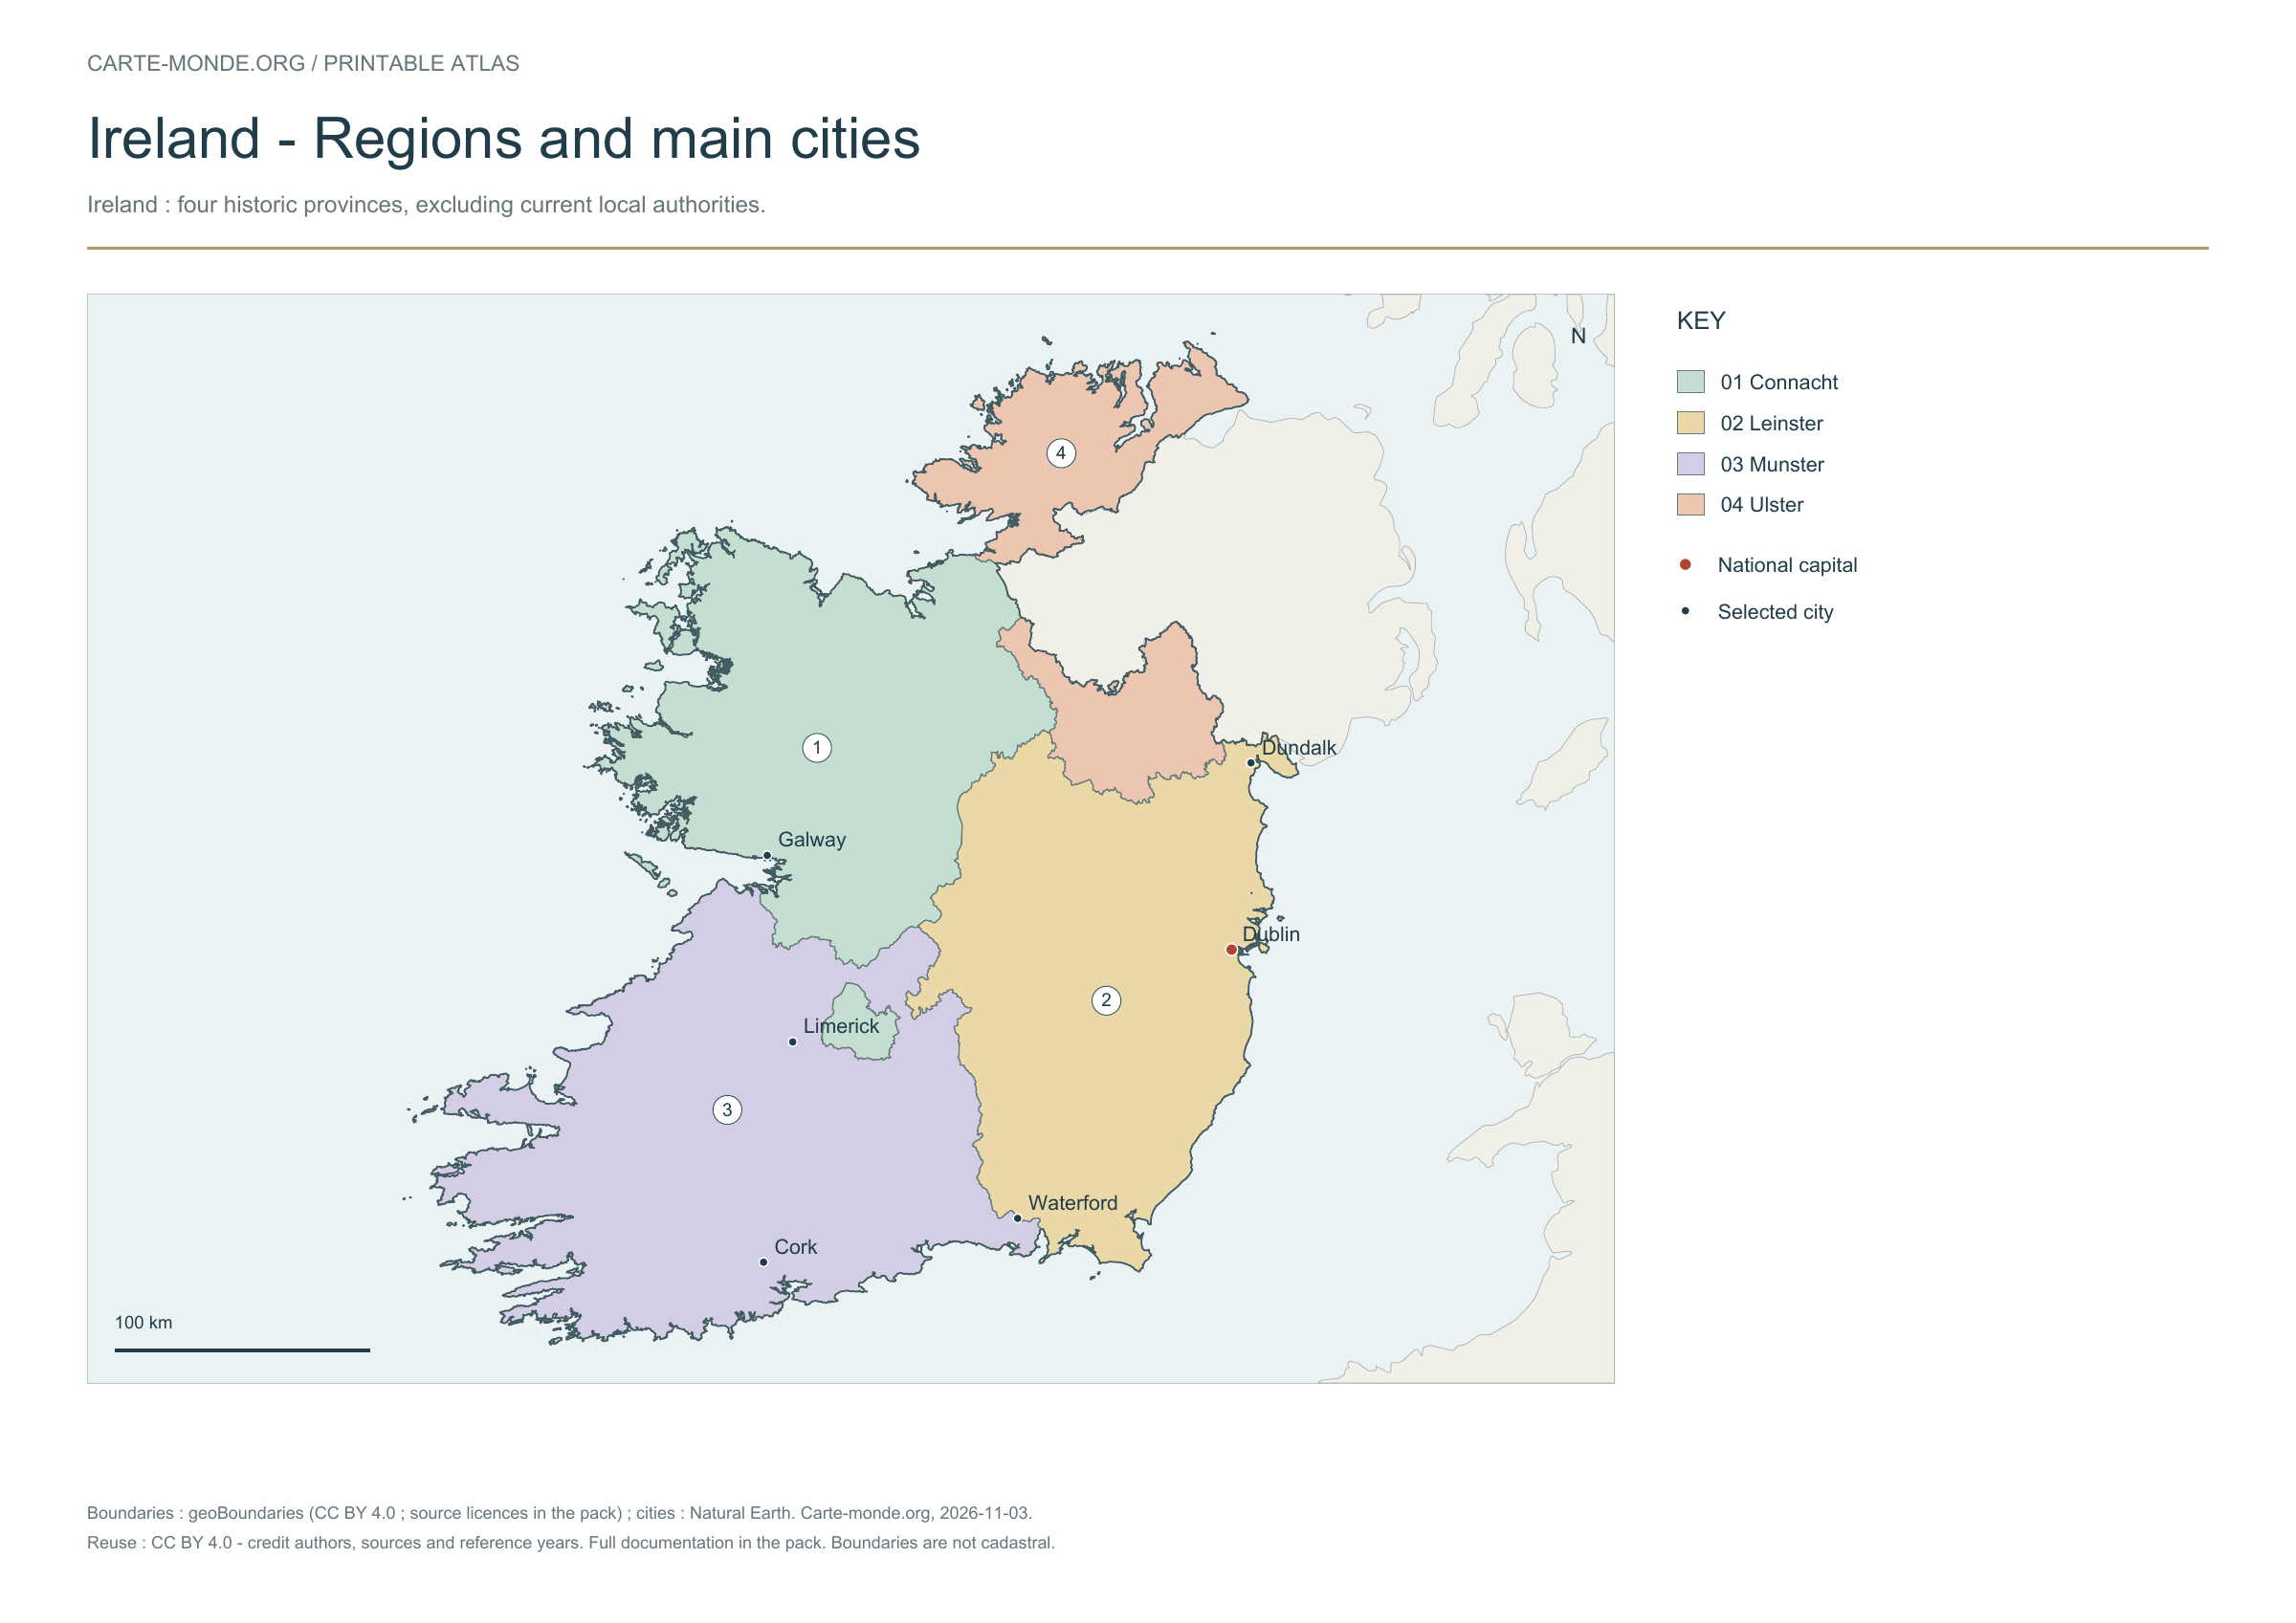
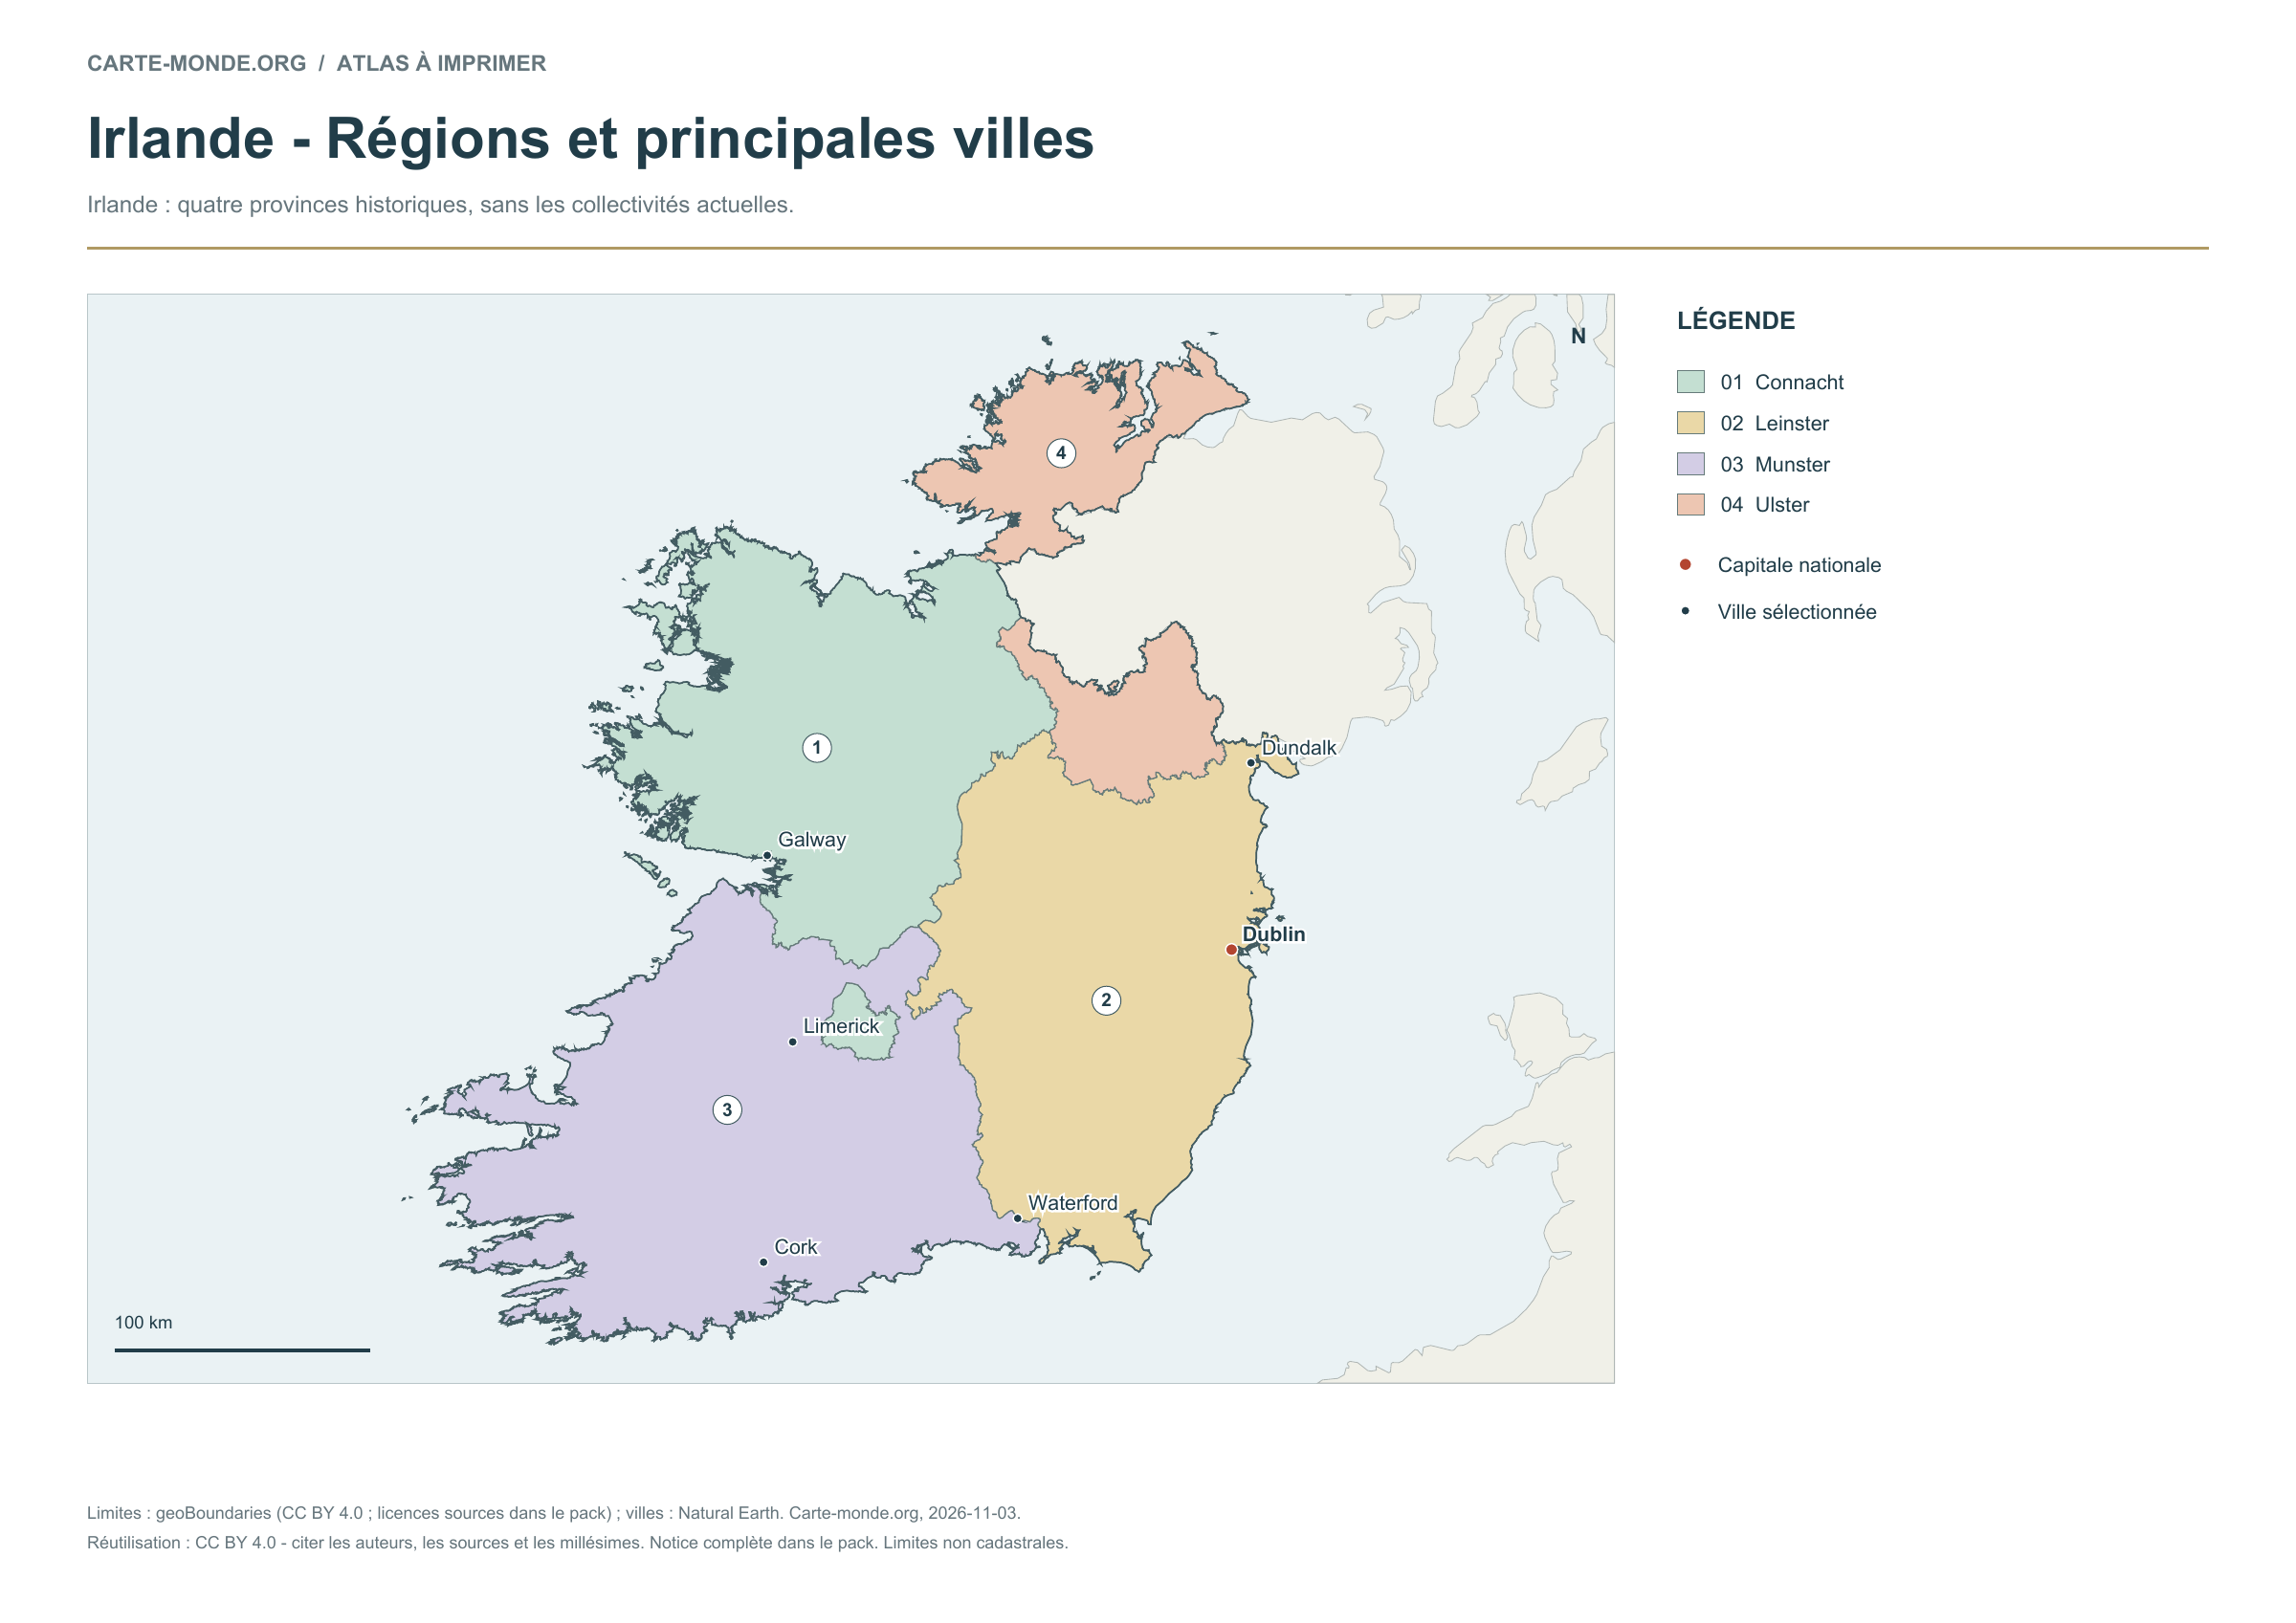
Ireland: four historical provinces, without current local authorities.

Regions and main cities — Ireland

Carte-monde.org · November 2026

Regions and main cities

The 4 reference territorial units are numbered and named in the key, with selected cities and the capital.

A4 landscape PDF · PNG 2 400 px · CC BY 4.0

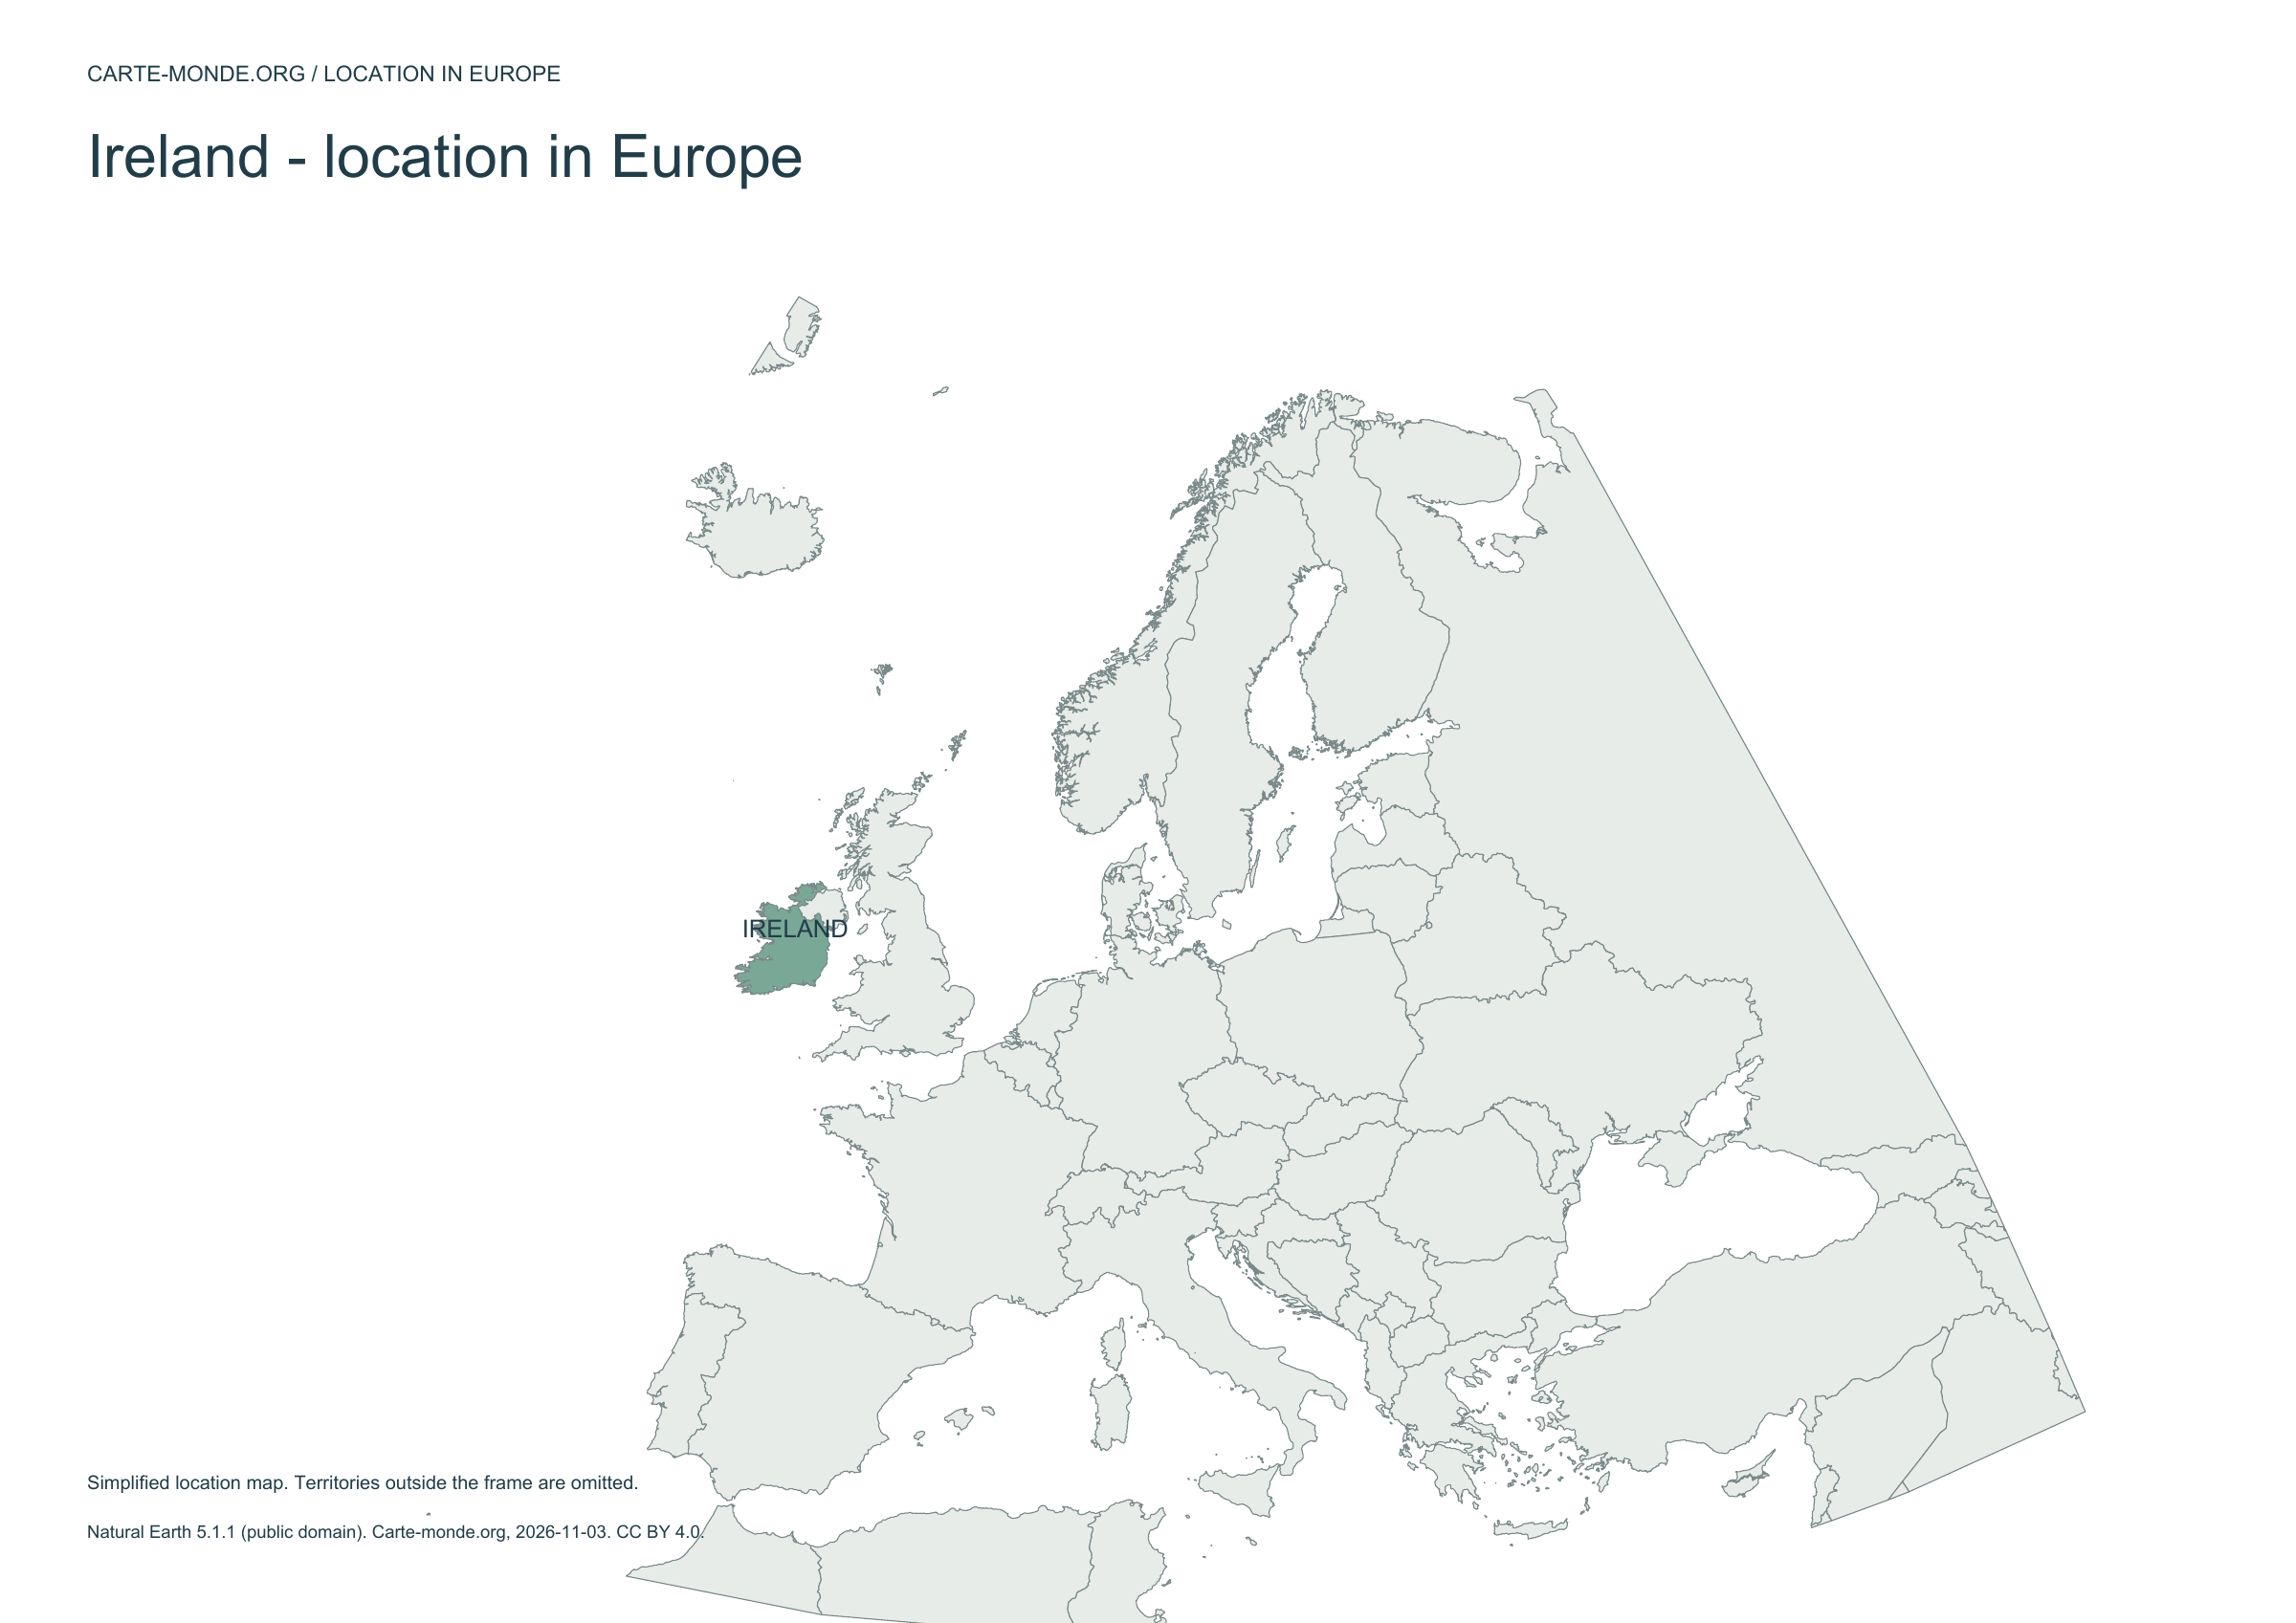
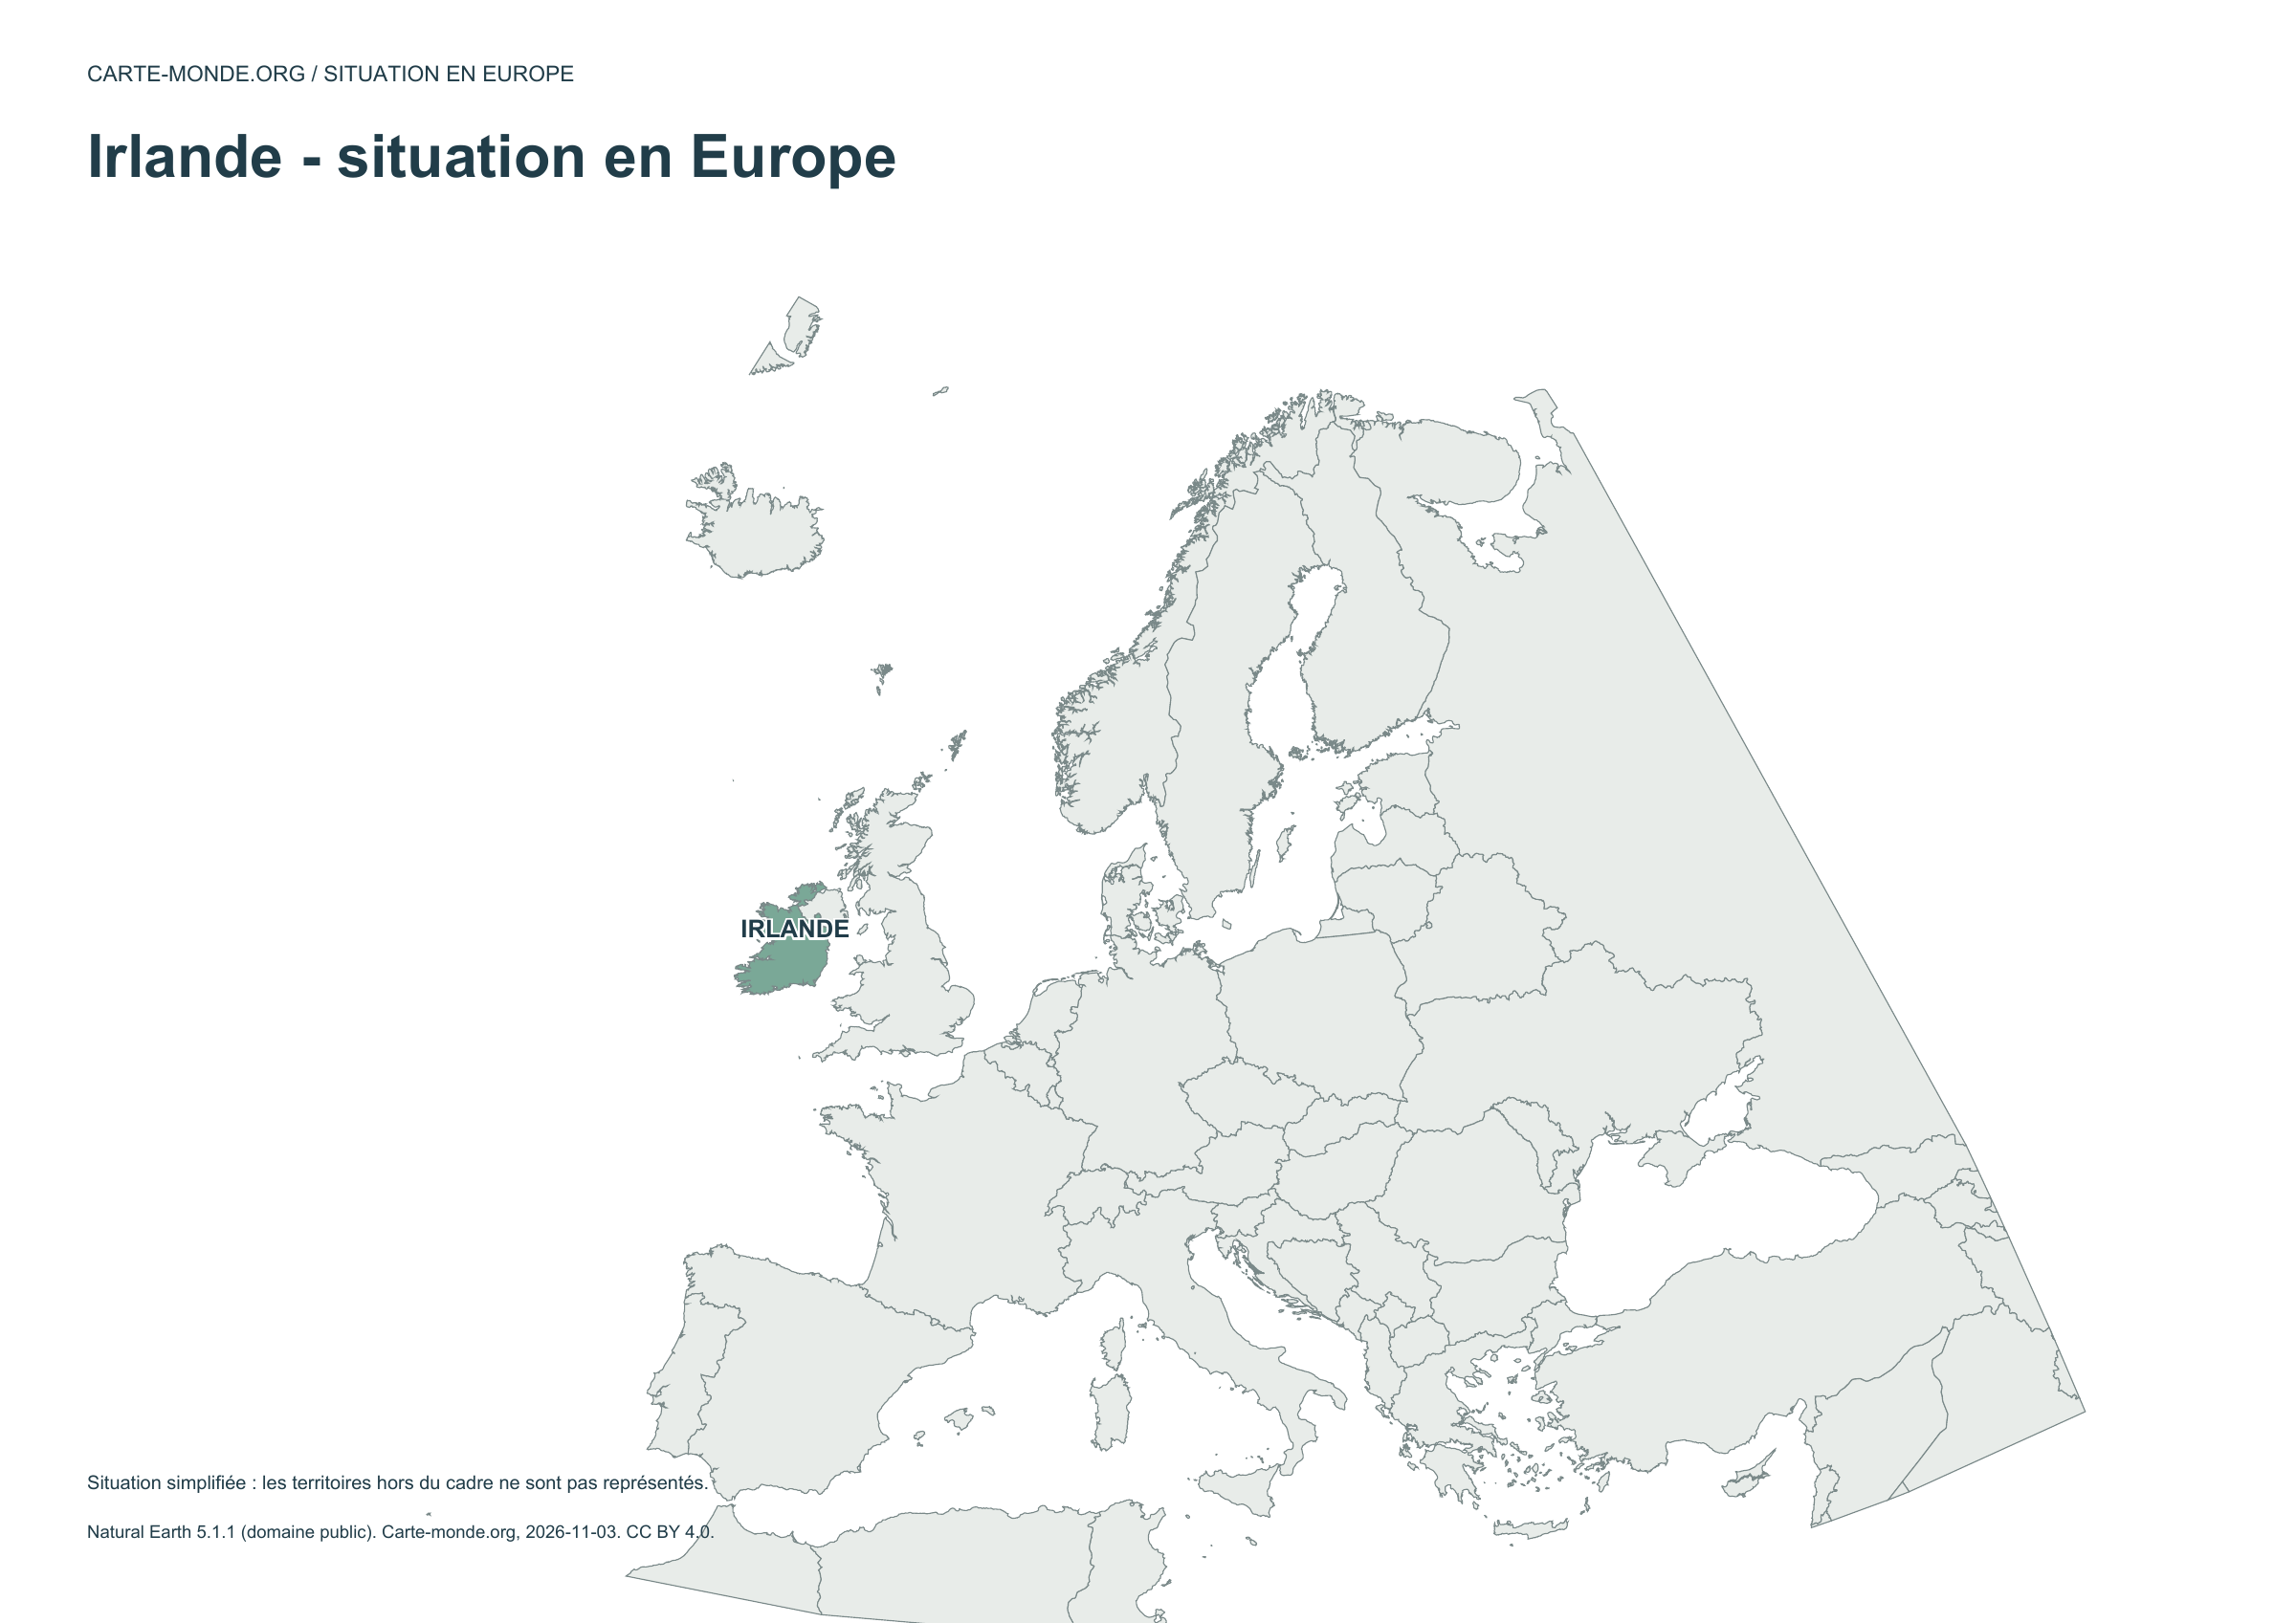
Location in Europe — Ireland

Carte-monde.org · November 2026

Location in Europe

The country is highlighted within a simplified European frame; territories outside this frame are not shown.

A4 landscape PDF · PNG 2 400 px · CC BY 4.0

Two maps to understand the relief

Choose shaded relief for an overview, or elevation classes for school use.

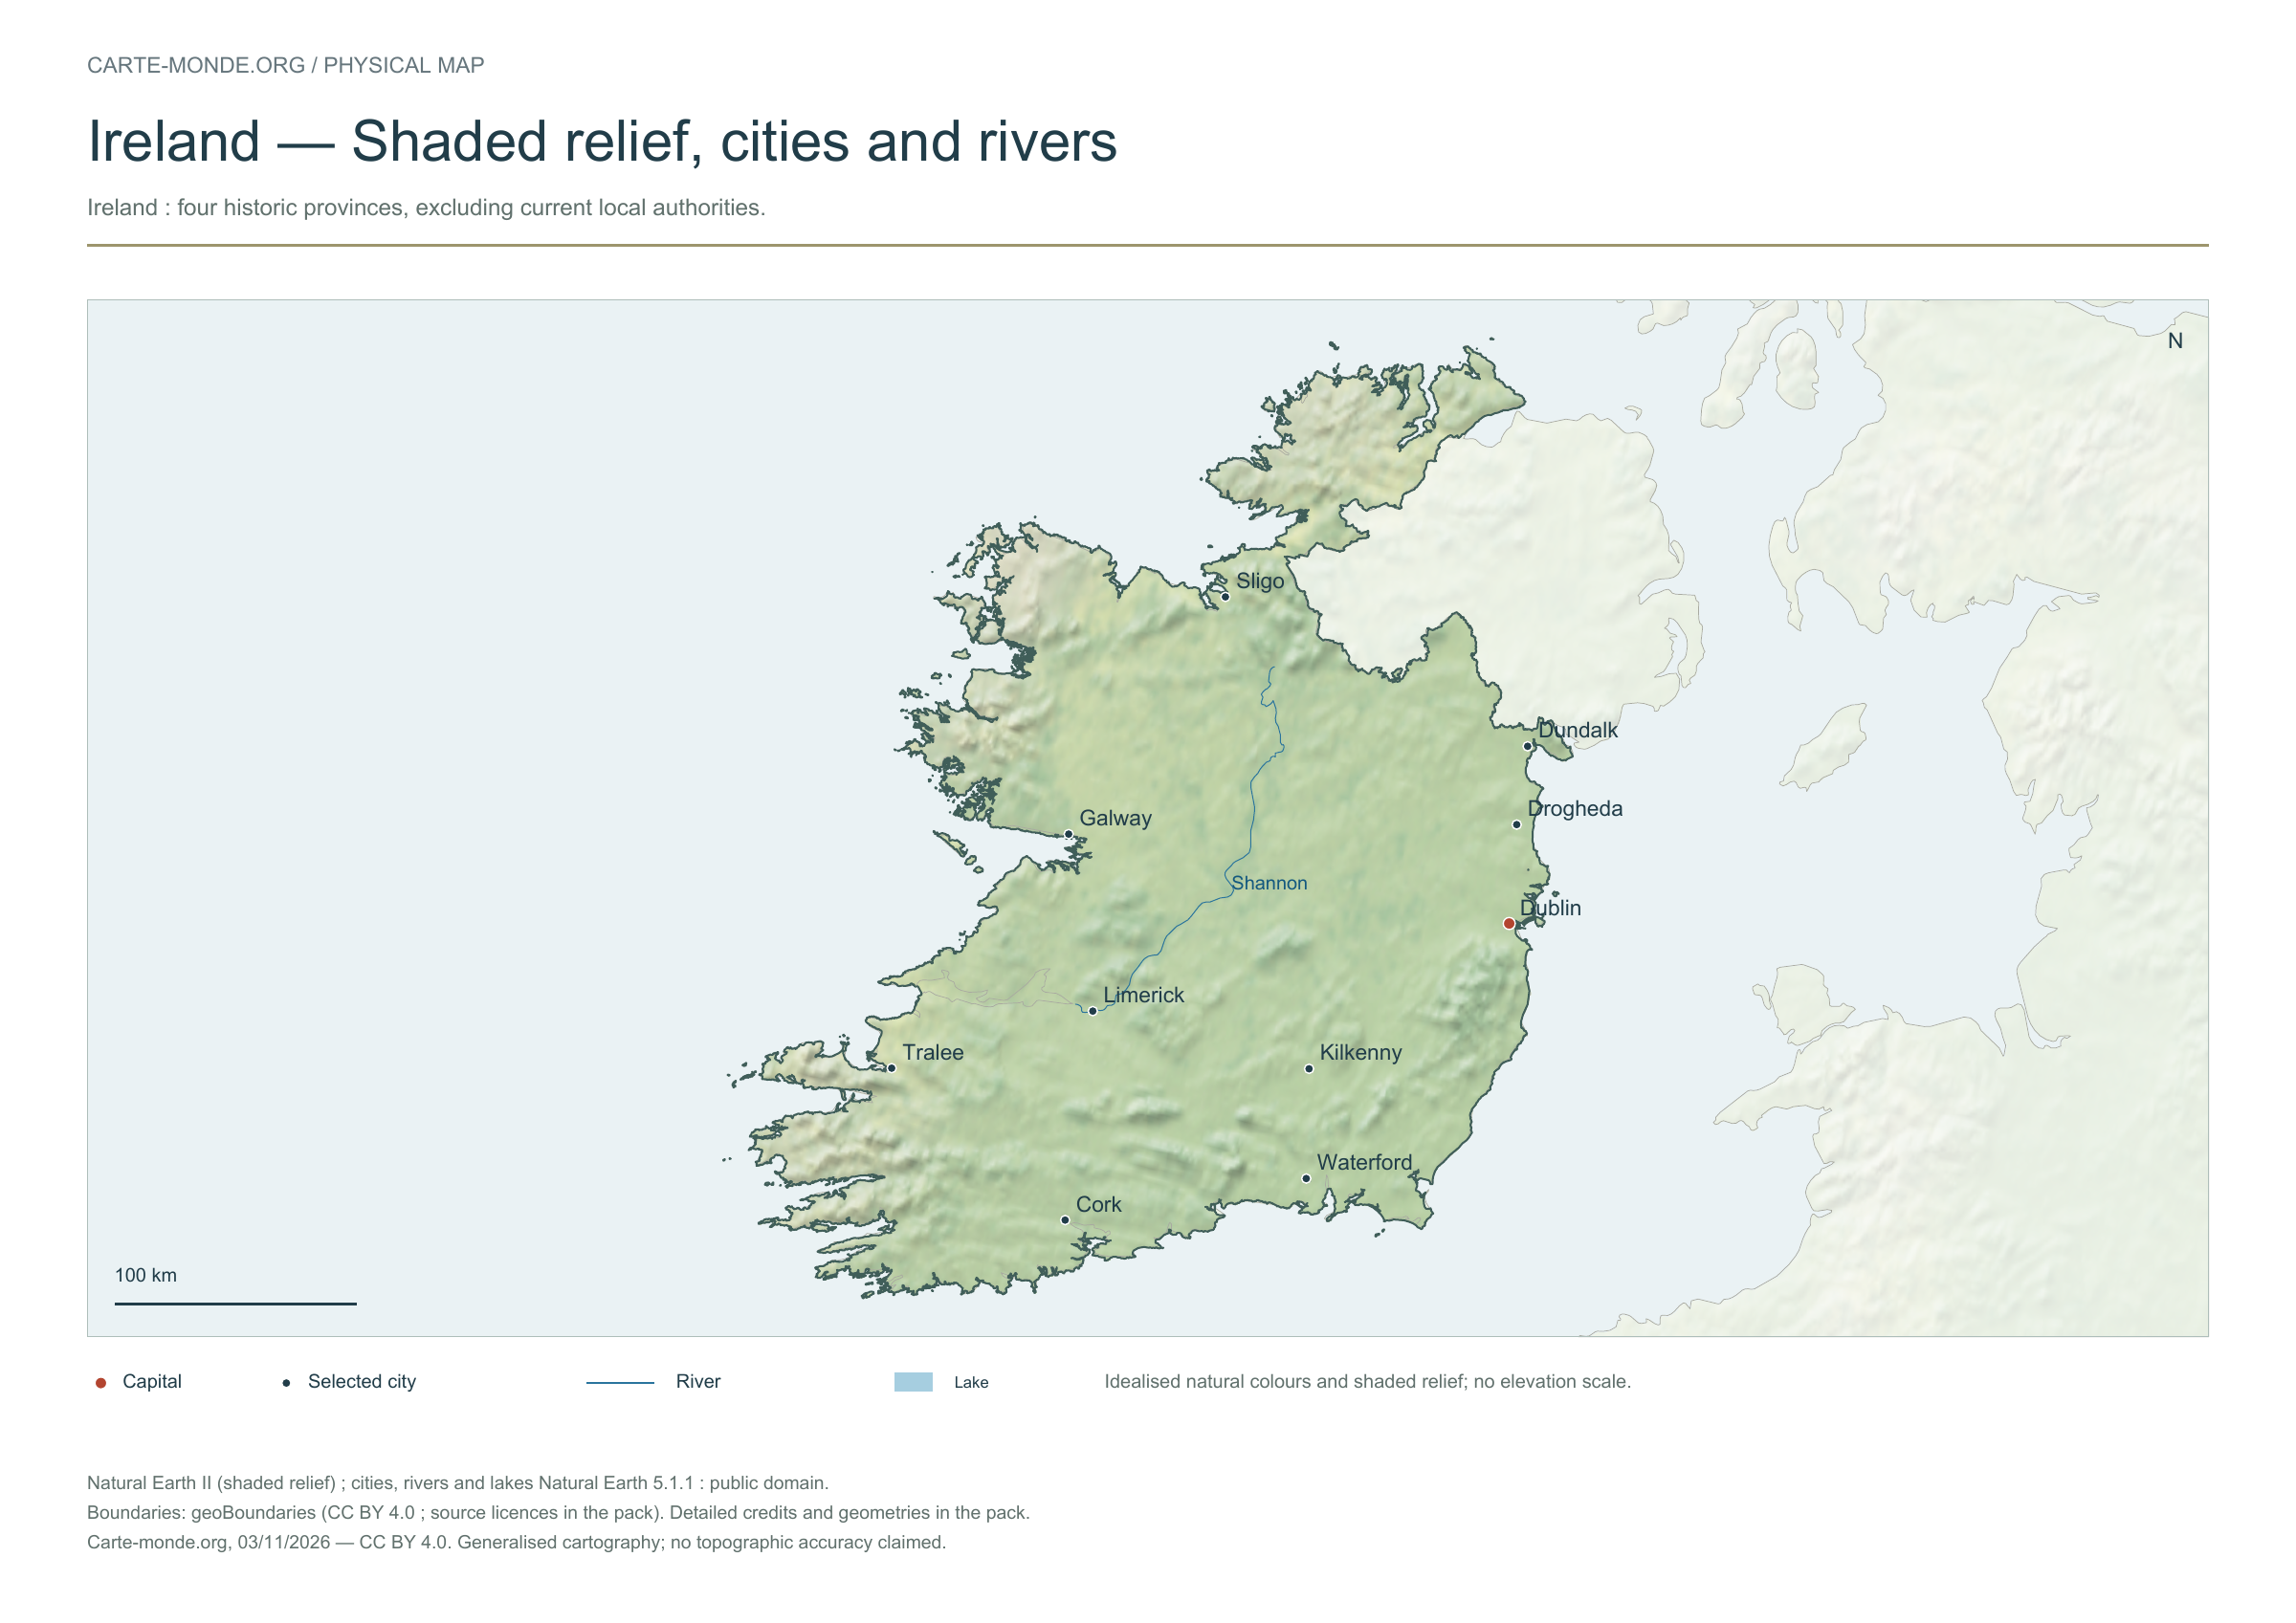
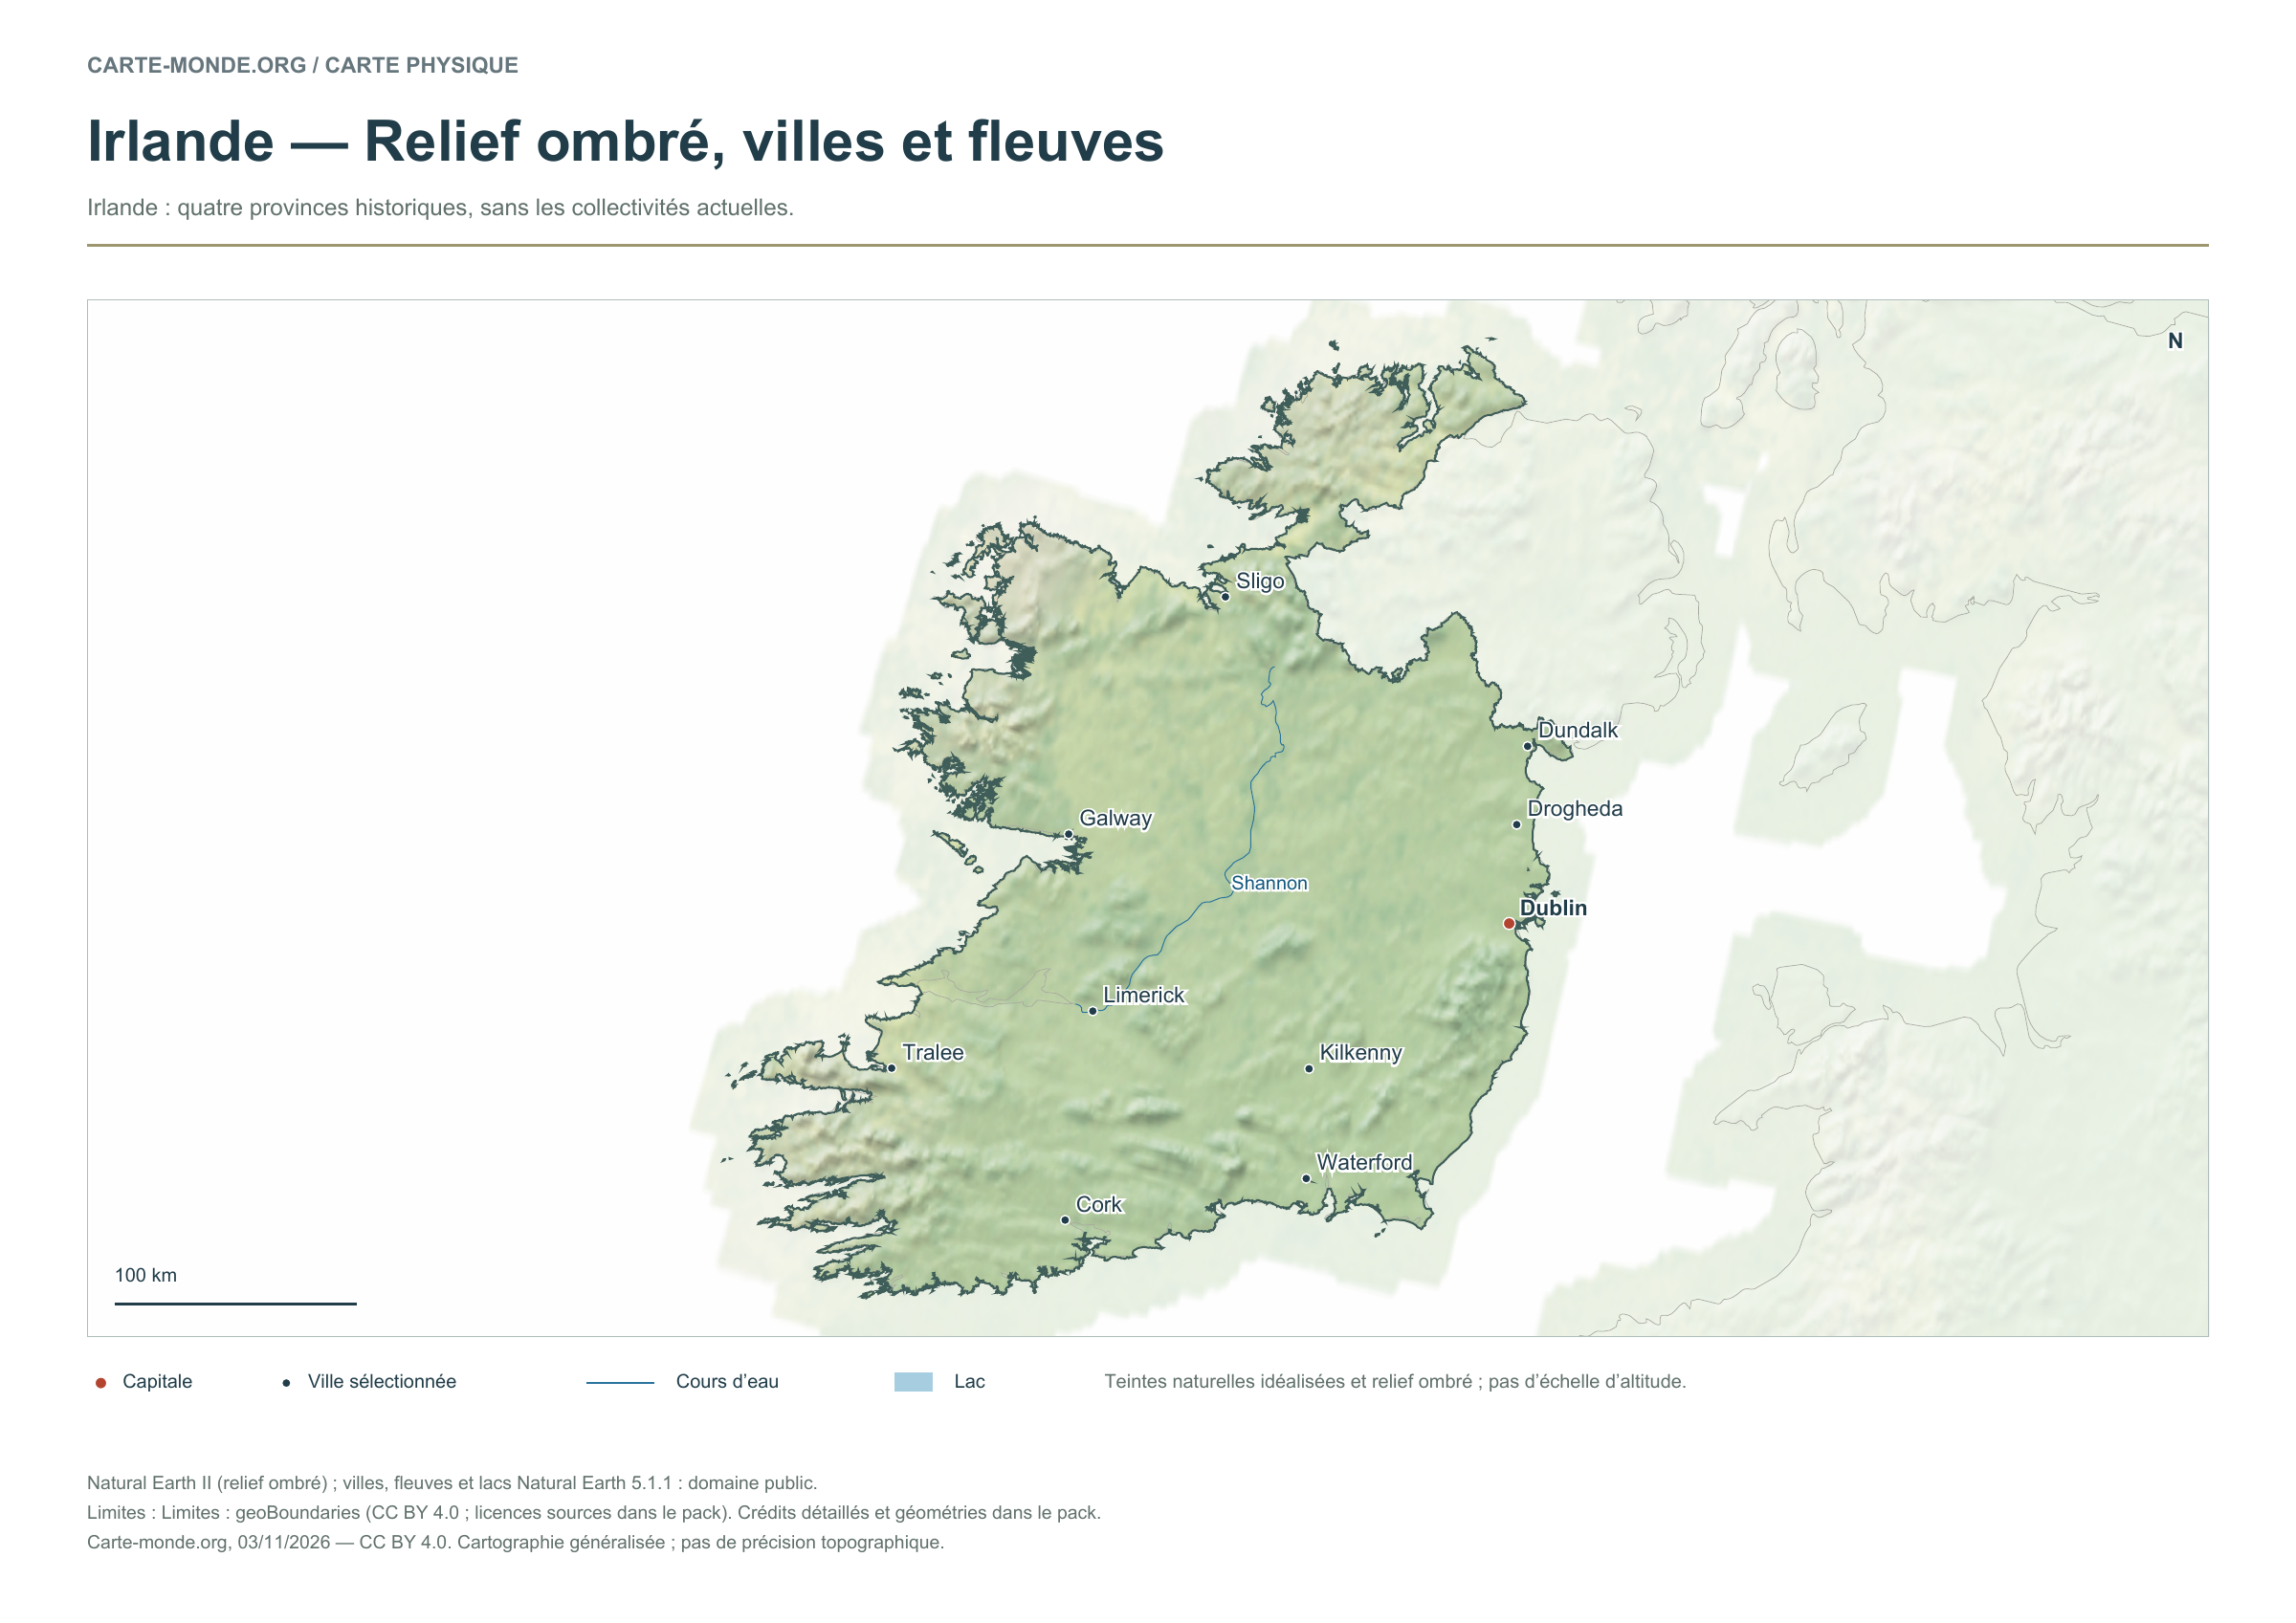
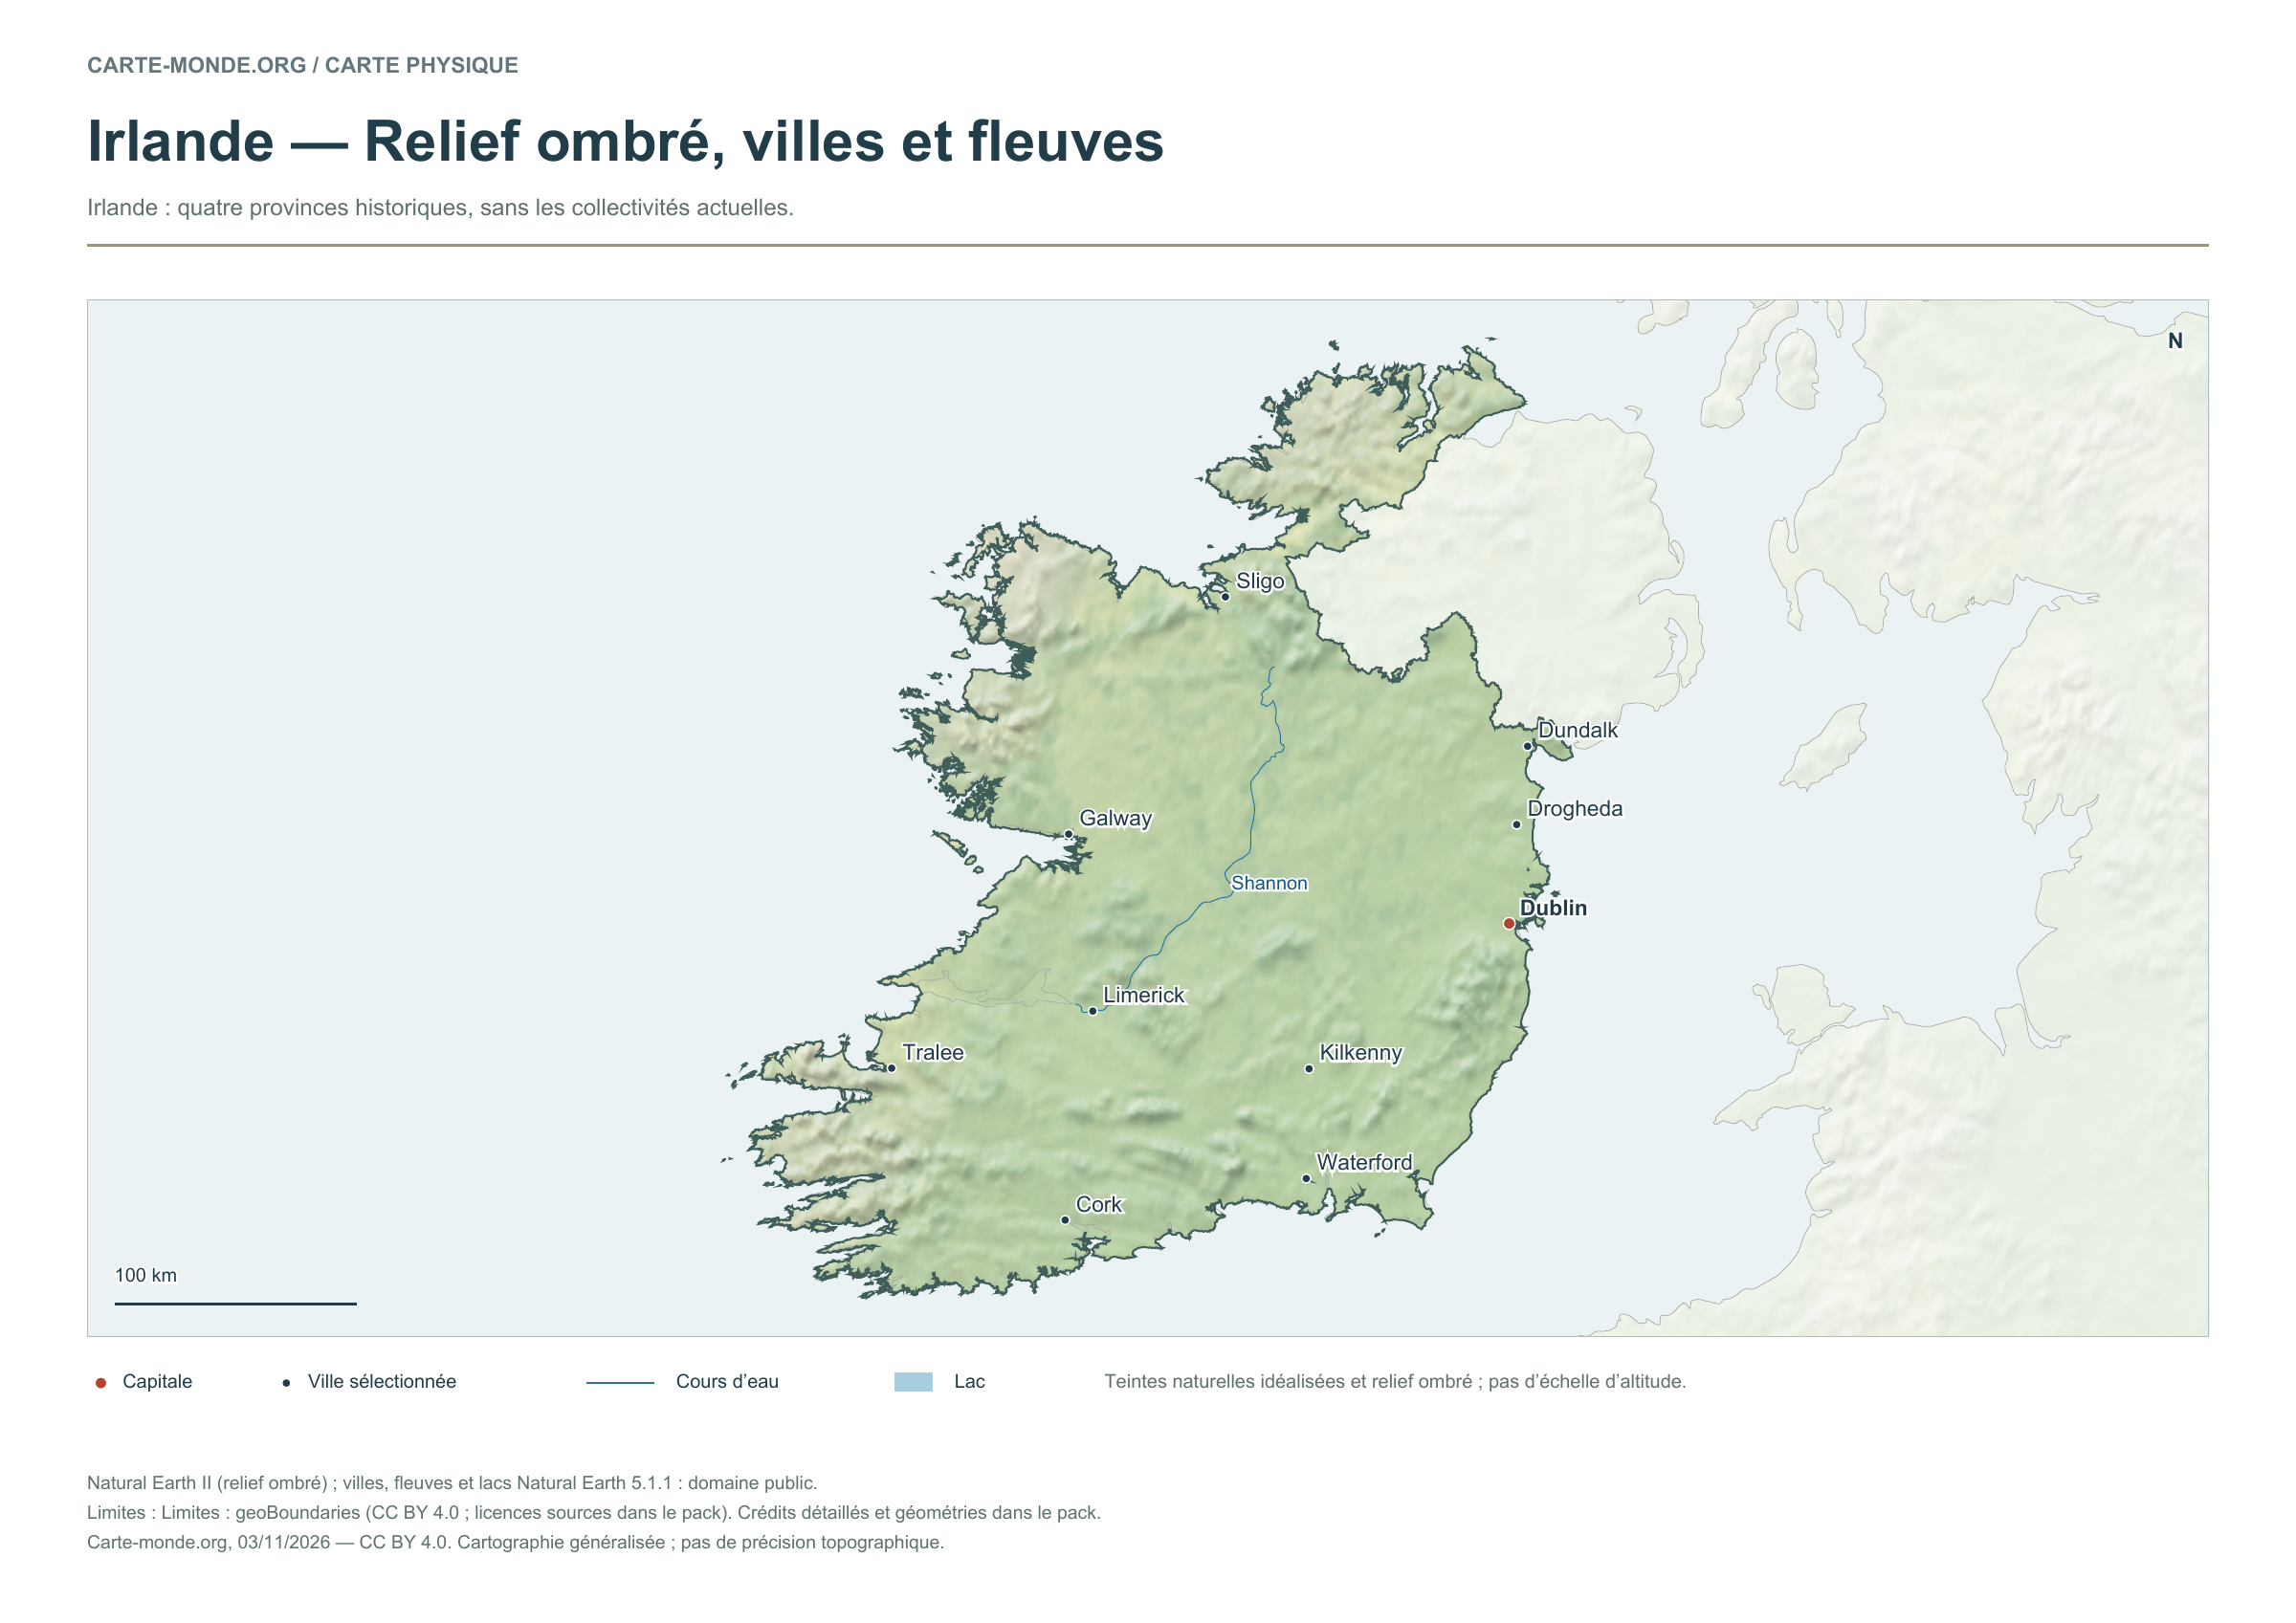
Ireland — Shaded relief, cities and rivers

Carte-monde.org · November 2026

Shaded relief, cities and rivers

To identify major landforms, cities and the river network. The natural colours are not an elevation scale.

Raster base map, cities, rivers and lakes: Natural Earth, public domain. Other boundary credits and licences are retained in the pack. Cartographic work CC BY 4.0; ODbL-derived data retains its licence. No topographic accuracy is claimed.

Territory, data and selection of names

Ireland: four historical provinces, without current local authorities.

Natural Earth II shaded relief base map, 10 selected cities. Named rivers: Shannon.

The colours represent idealised natural cover; they do not correspond to elevation classes. This global background remains generalised, particularly for small states.

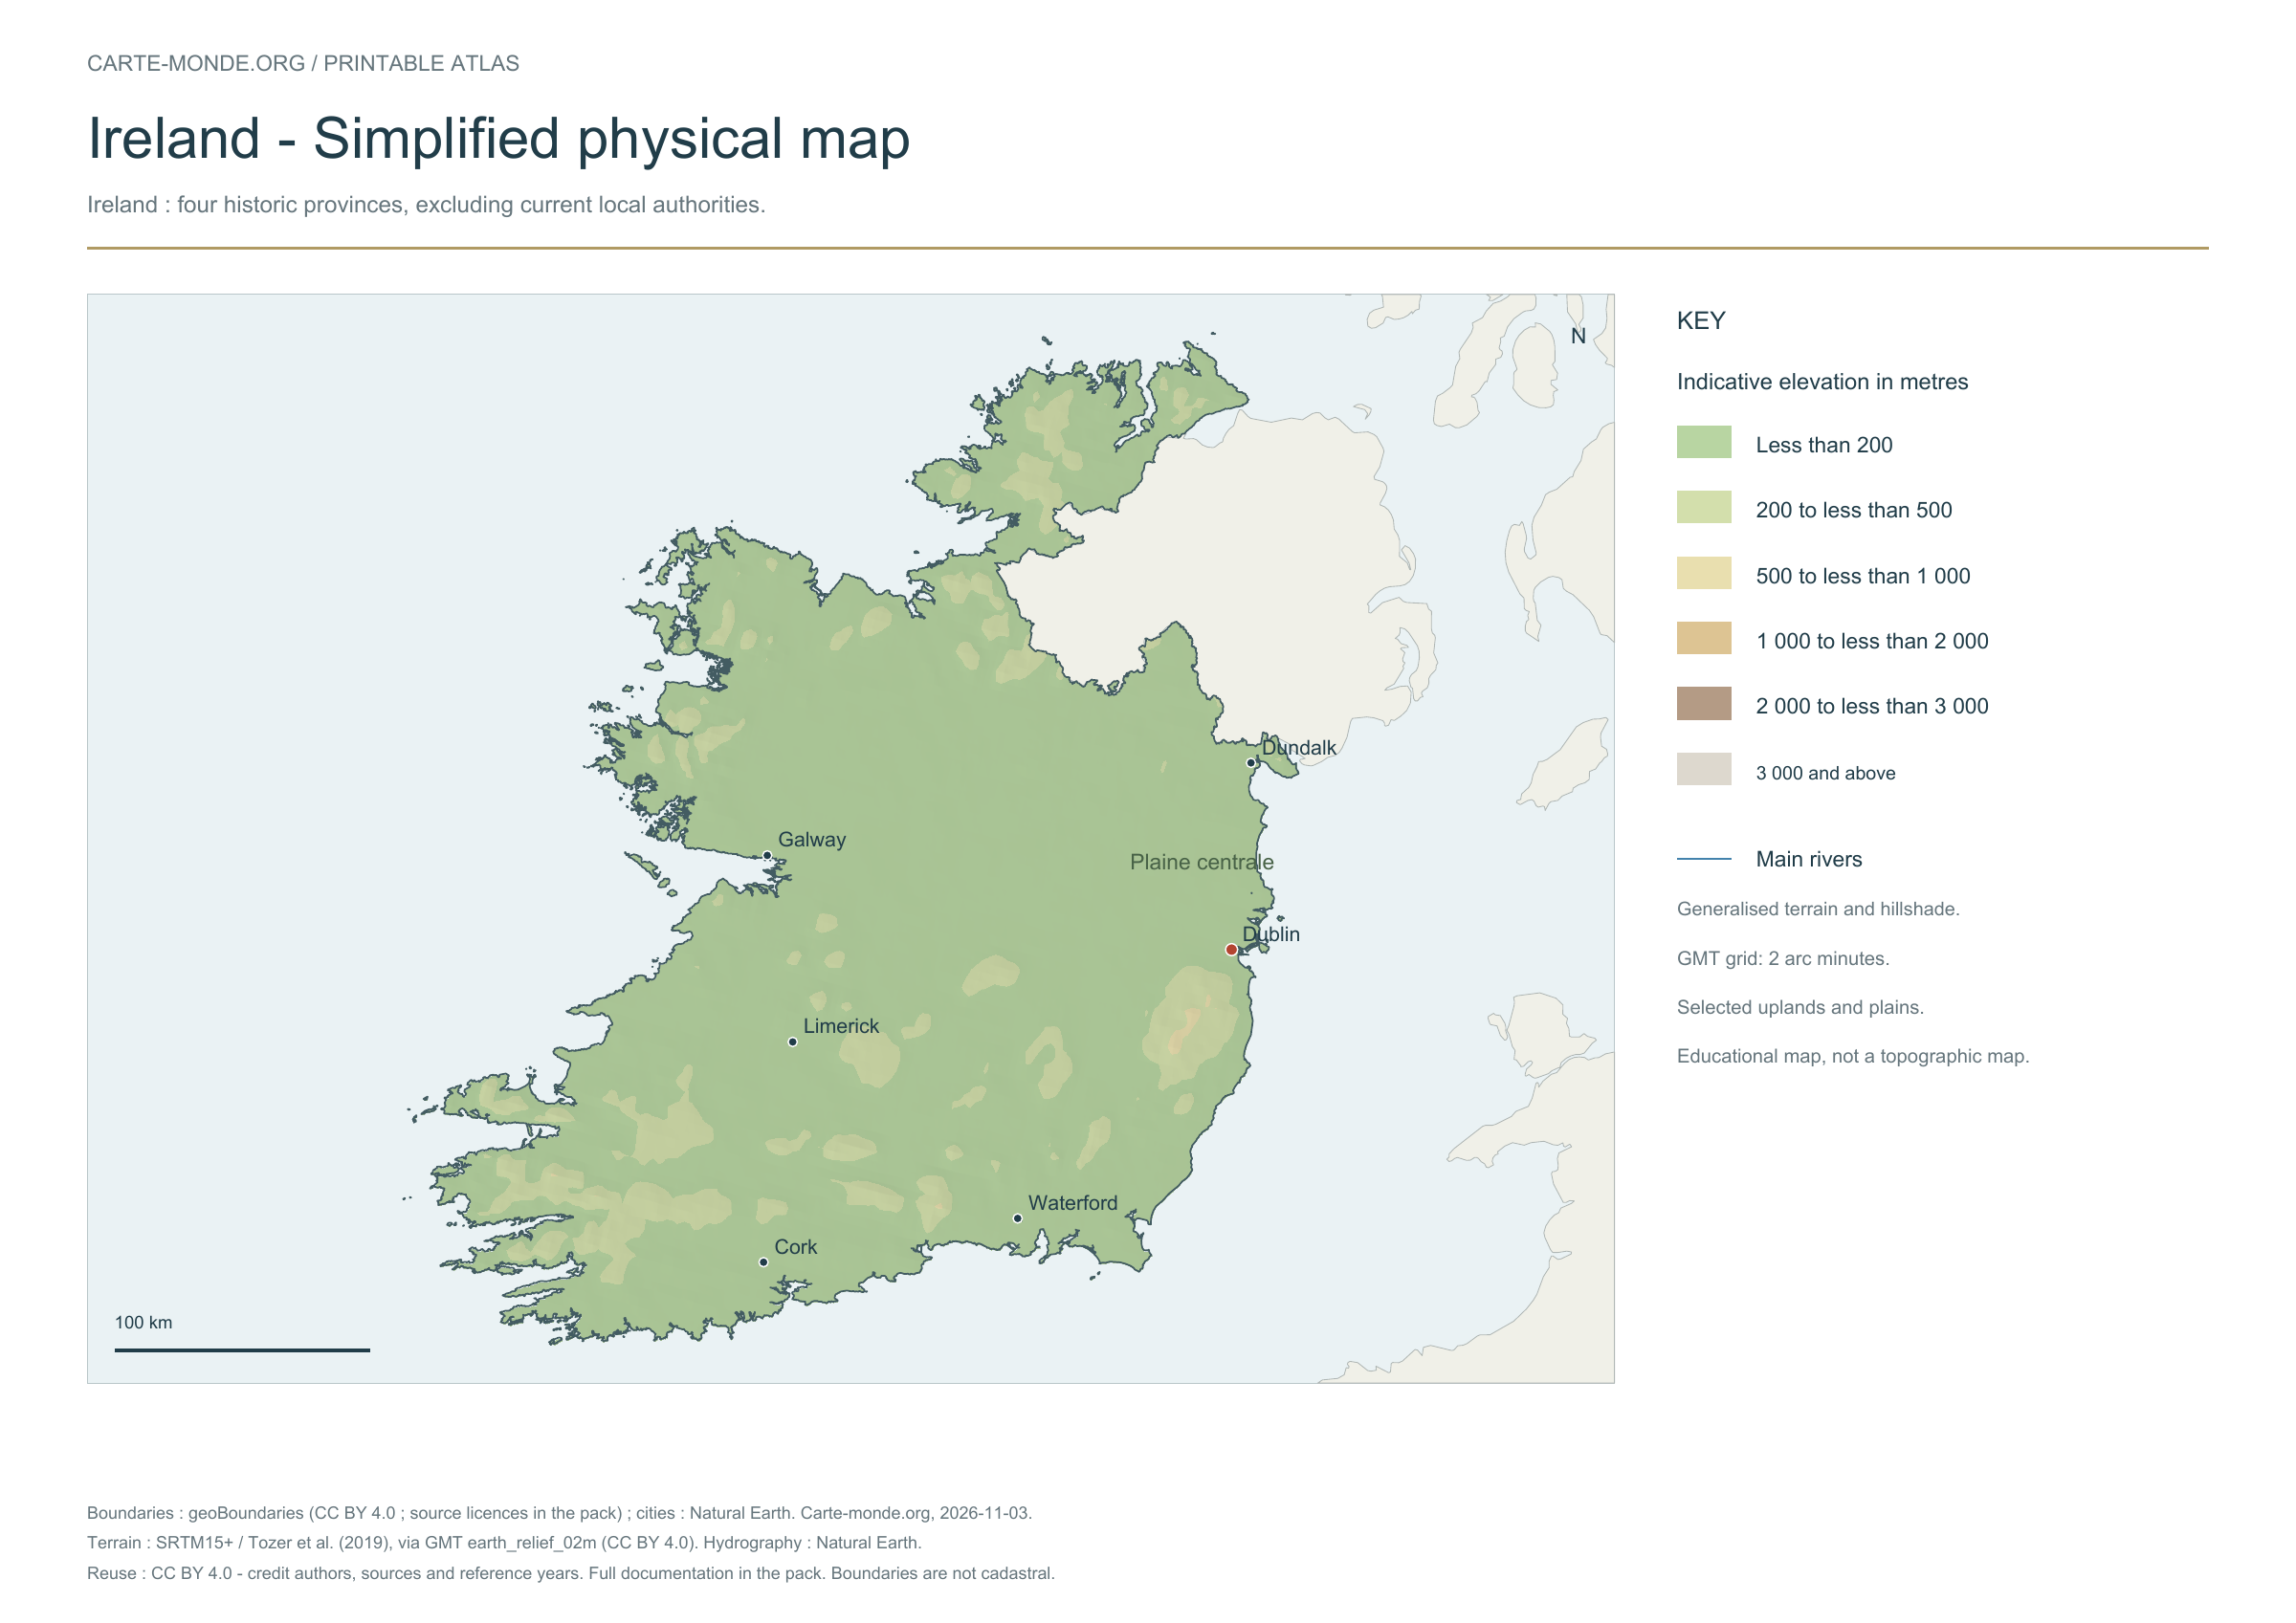
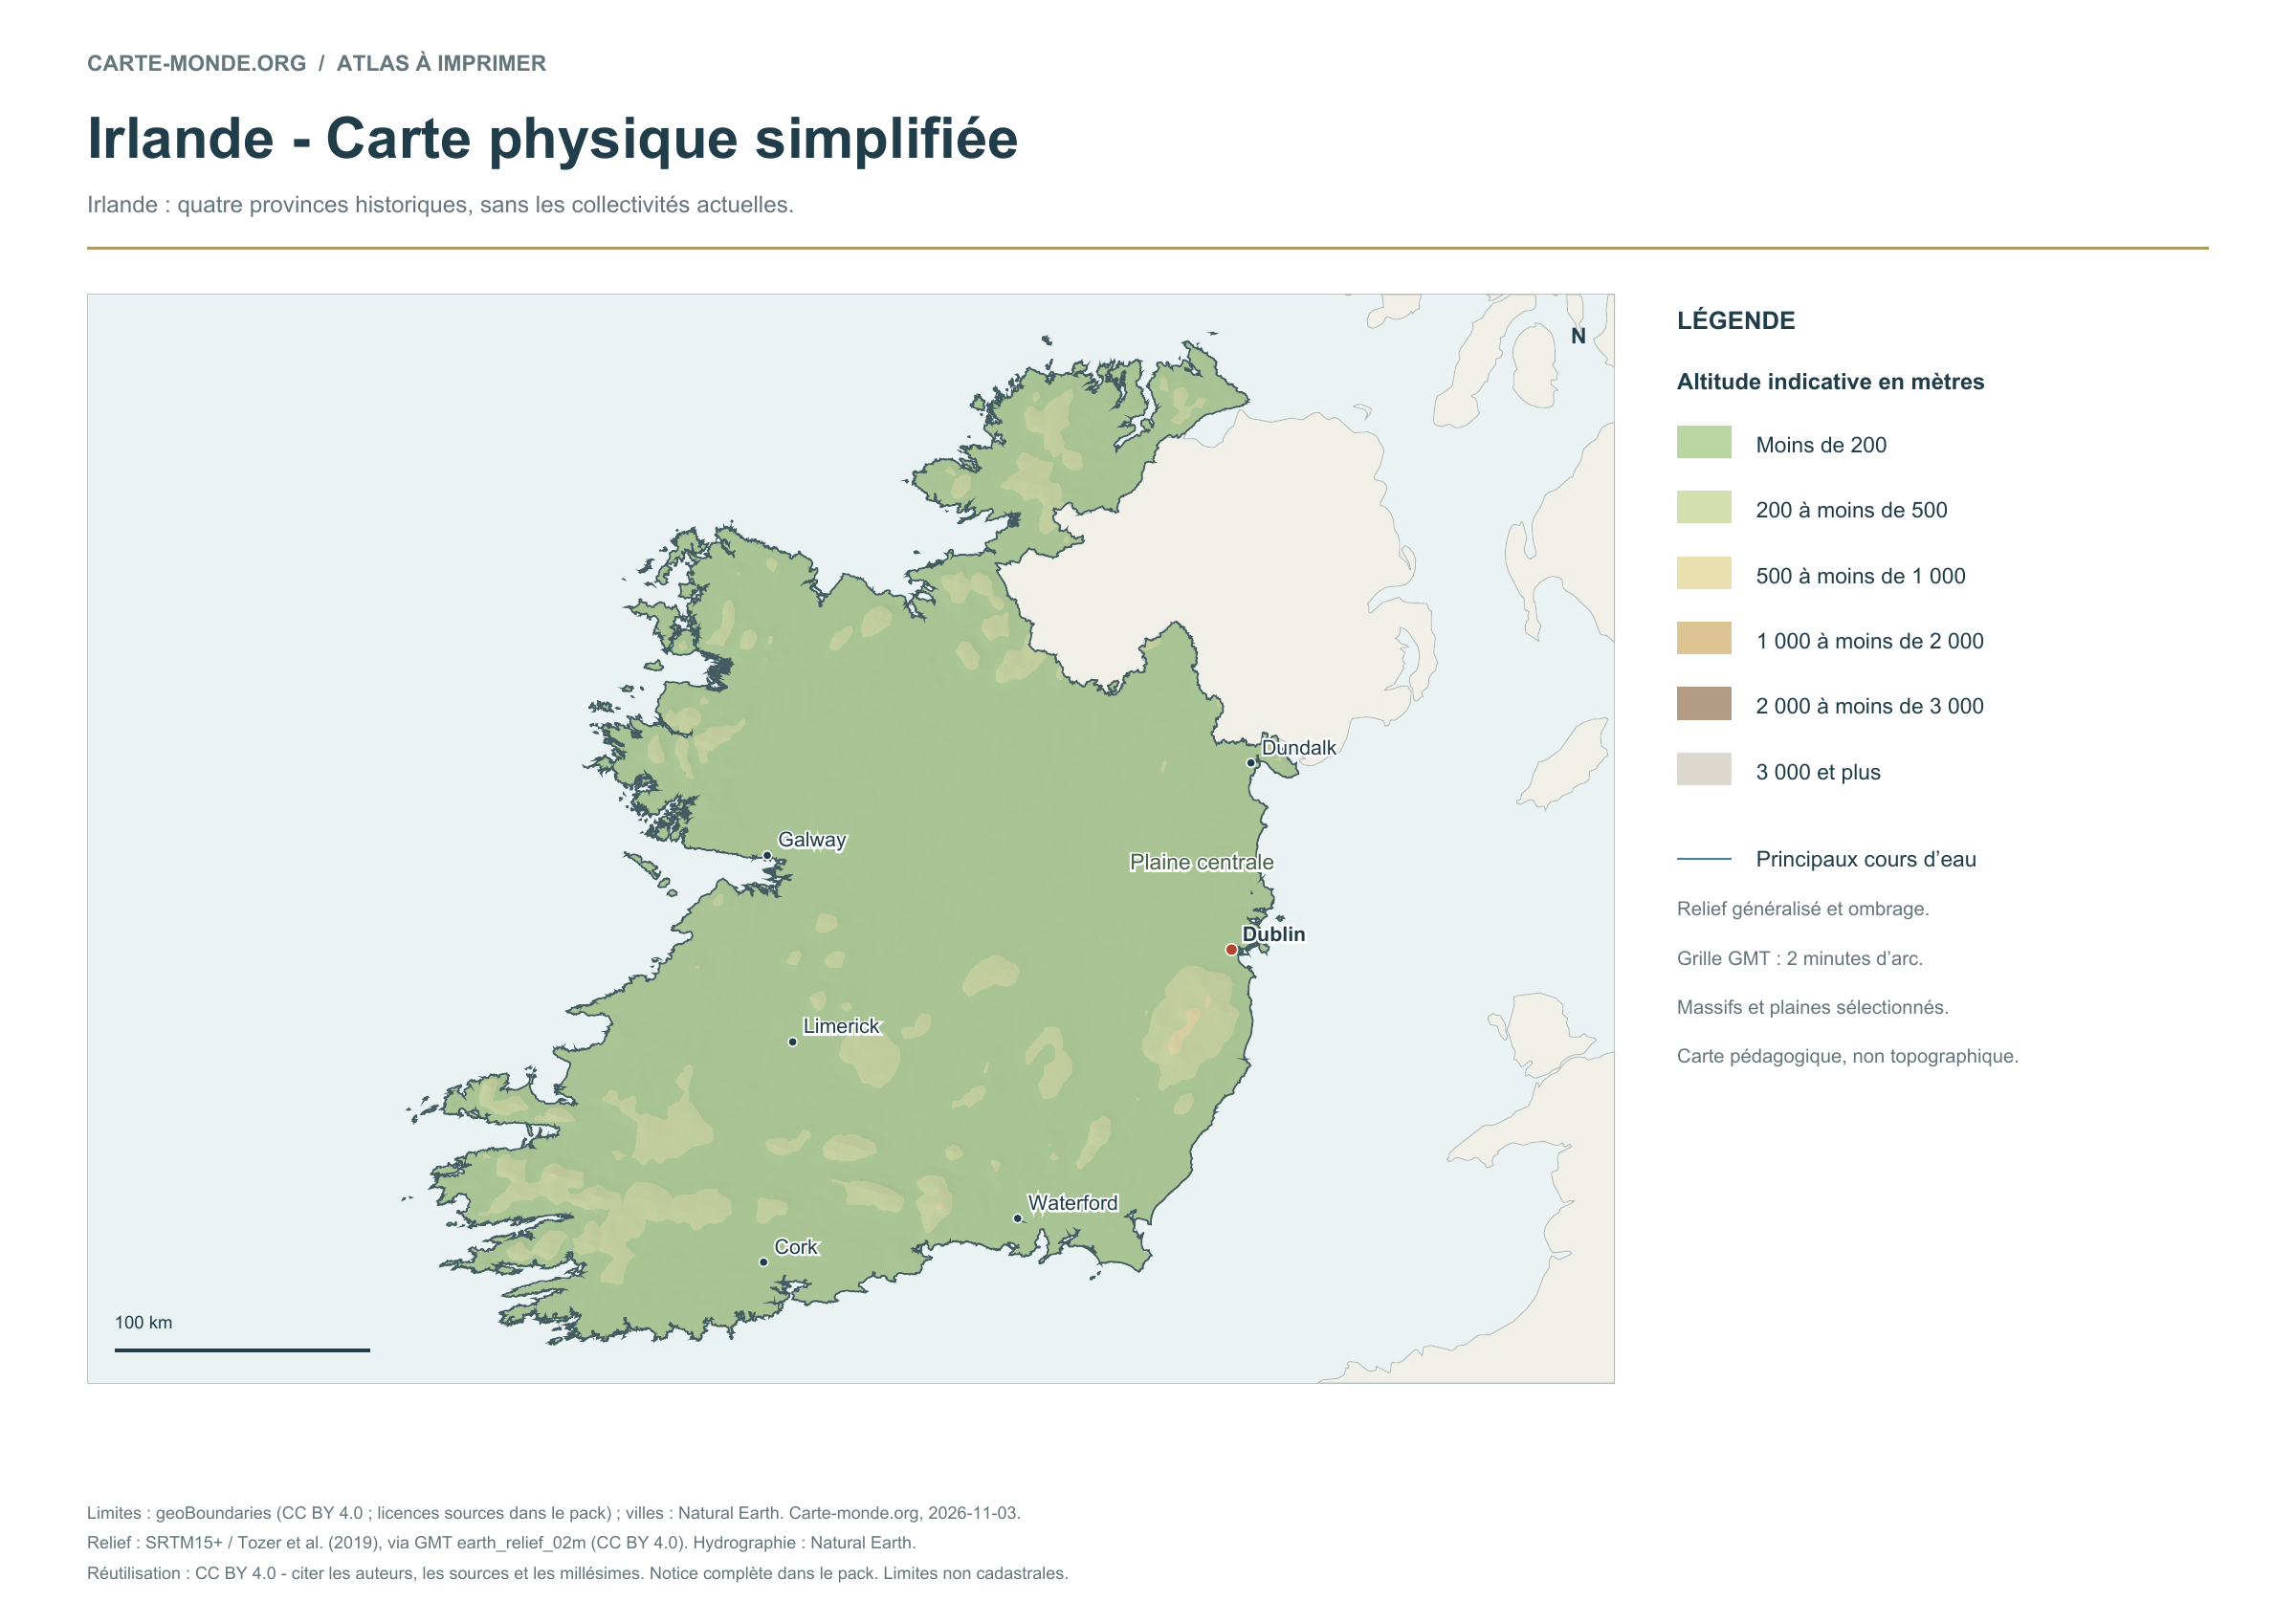
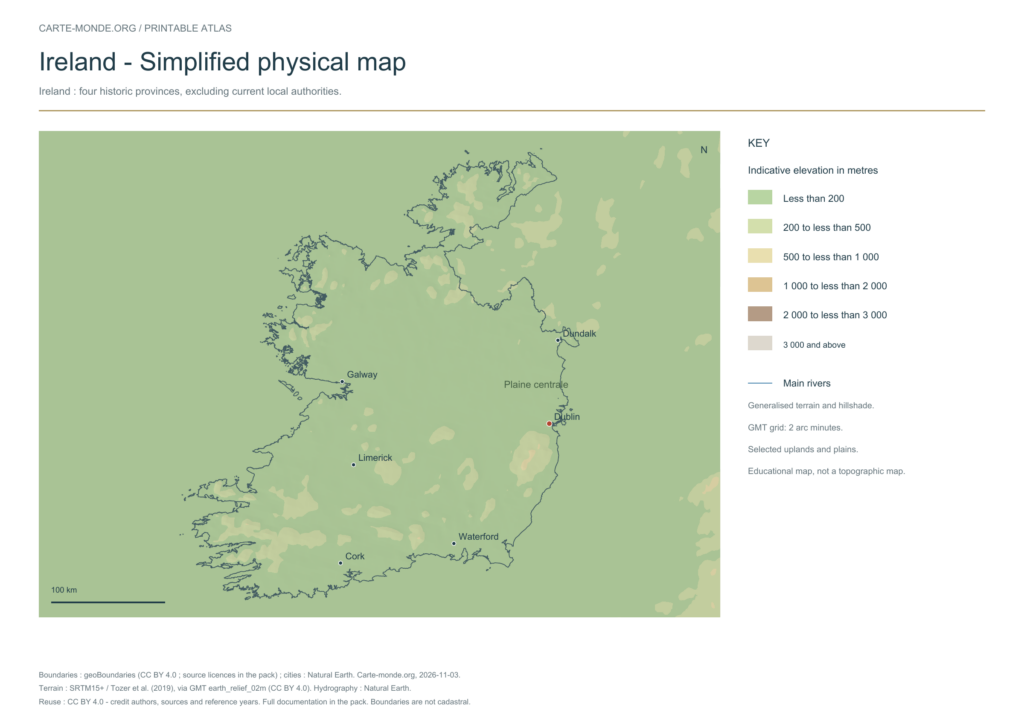
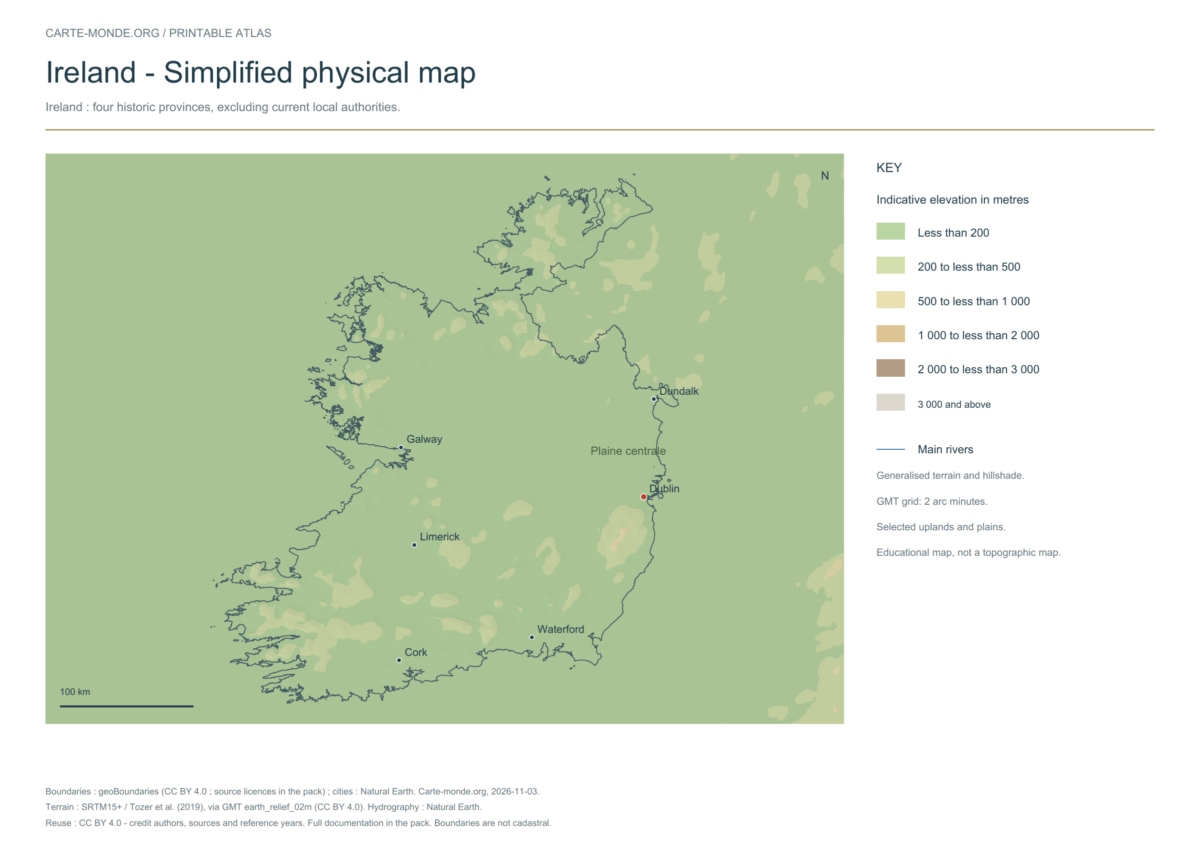
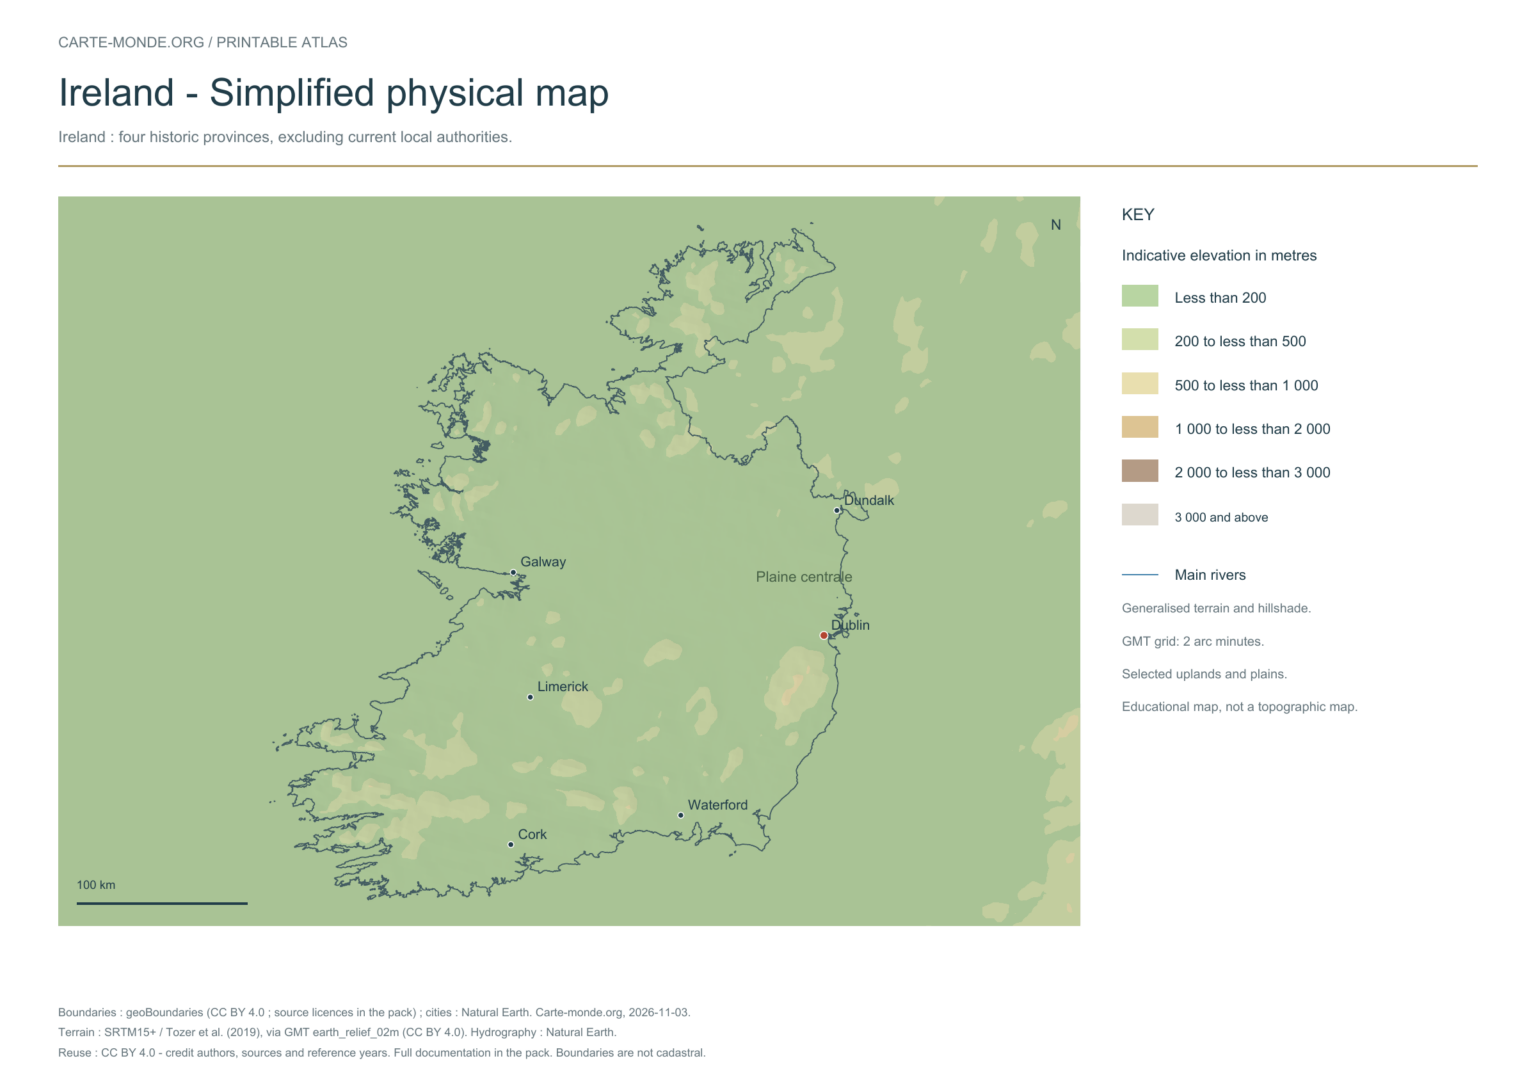
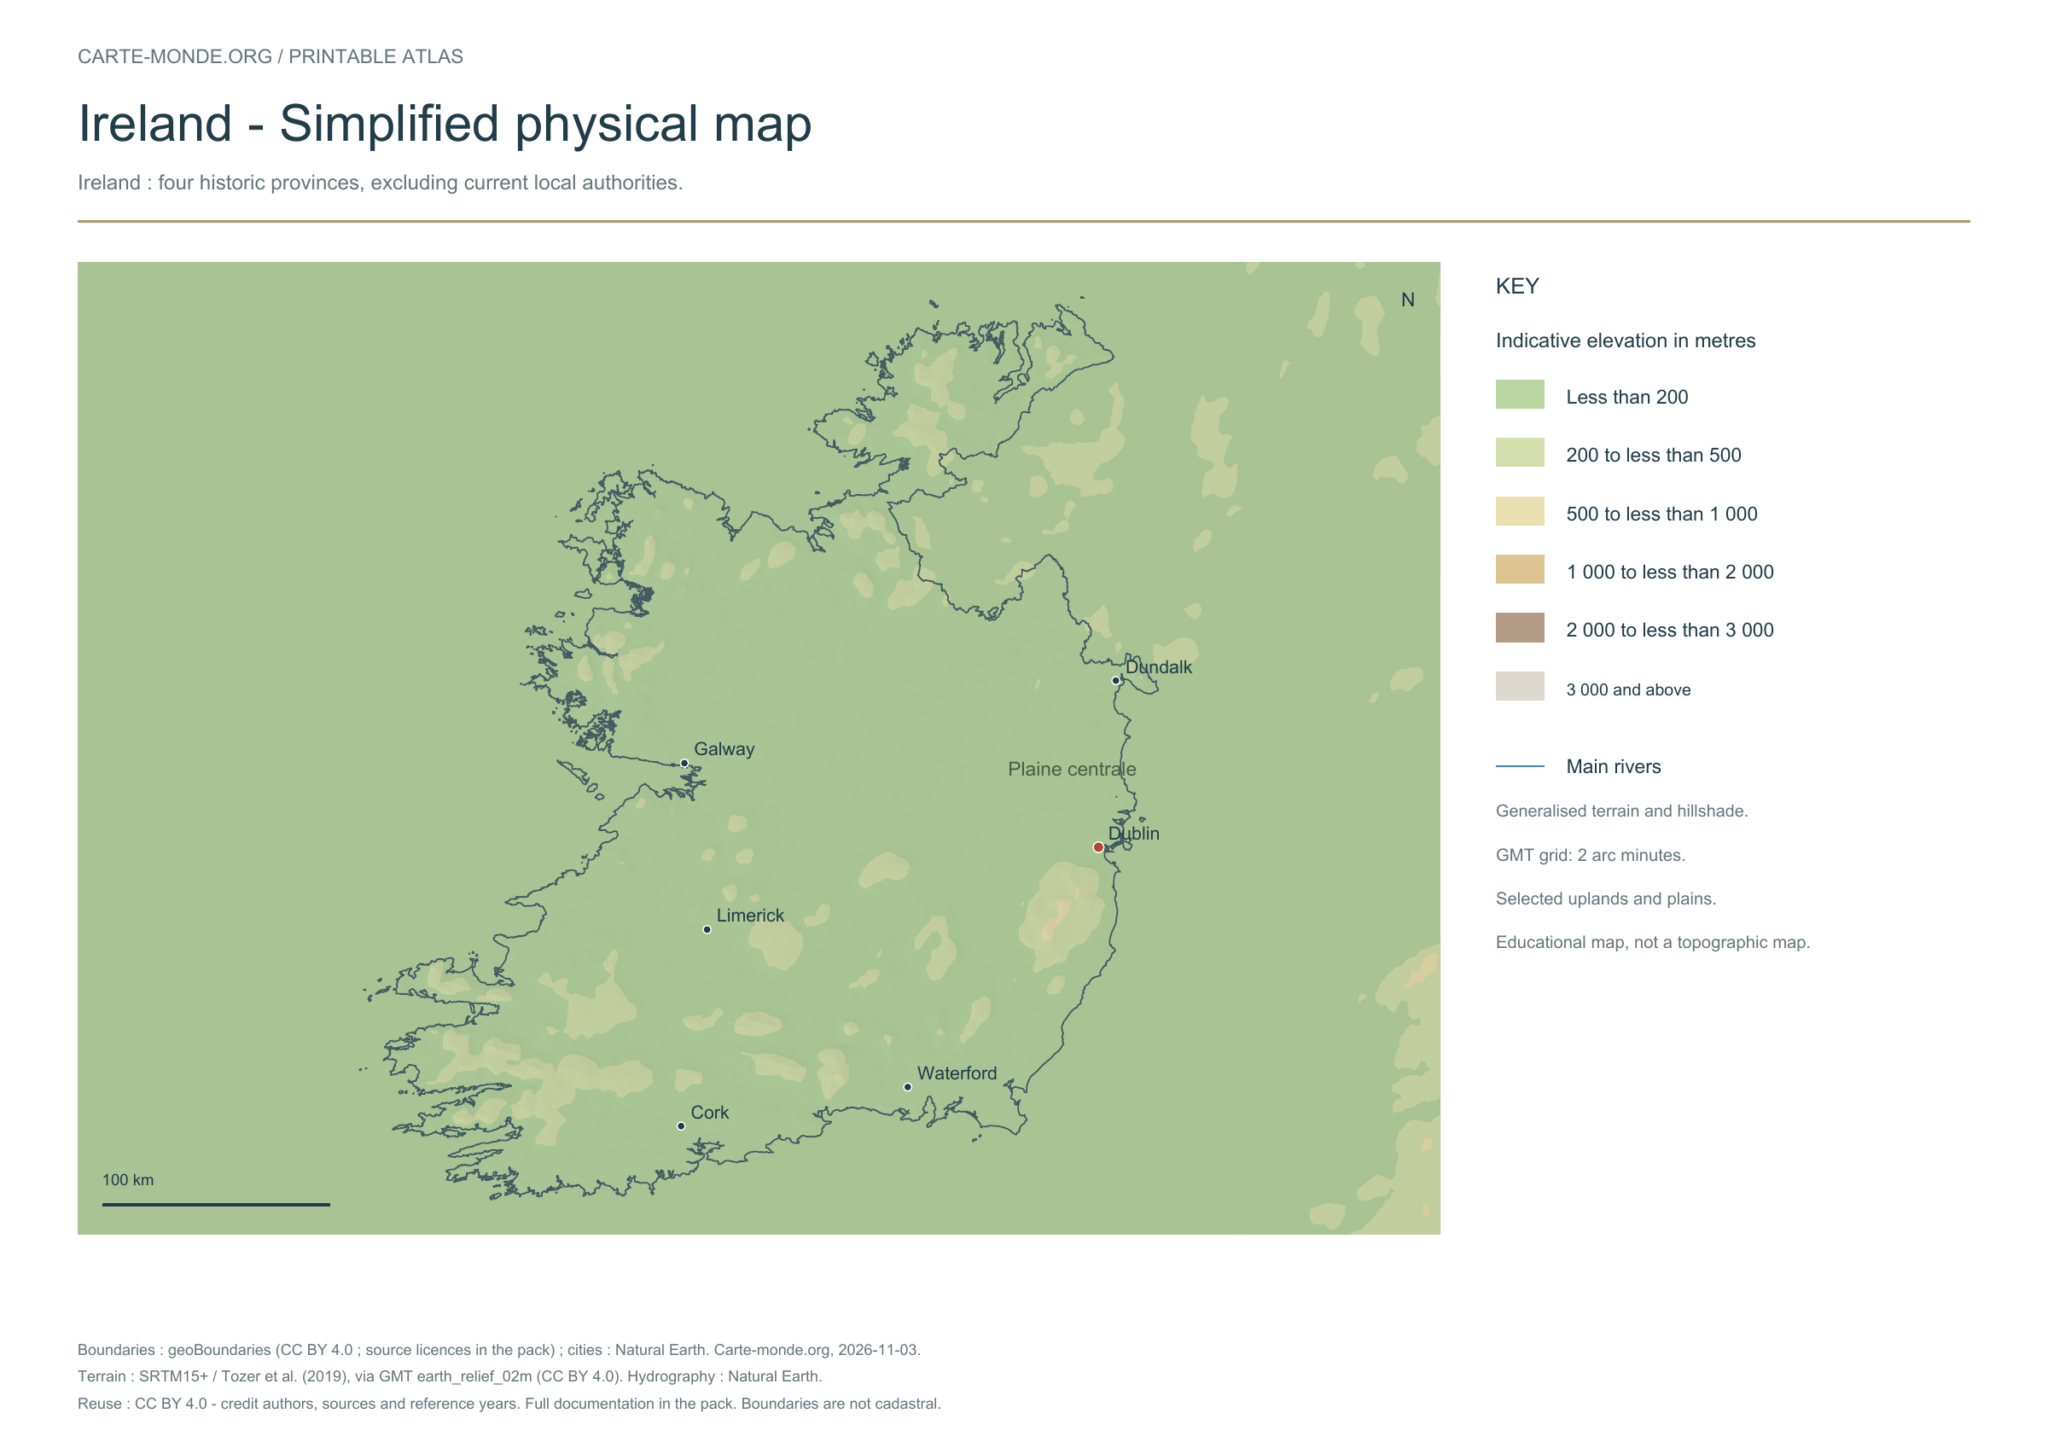
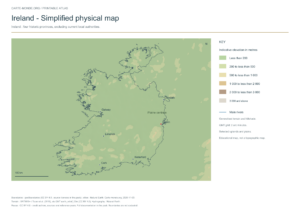
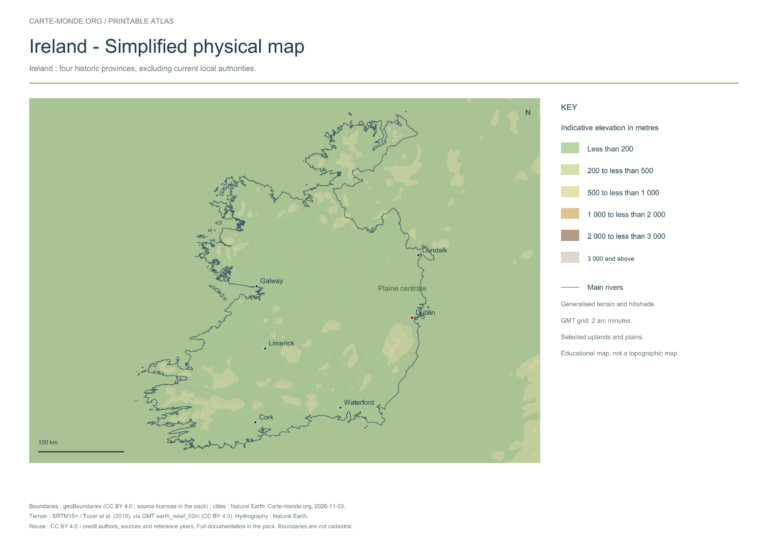
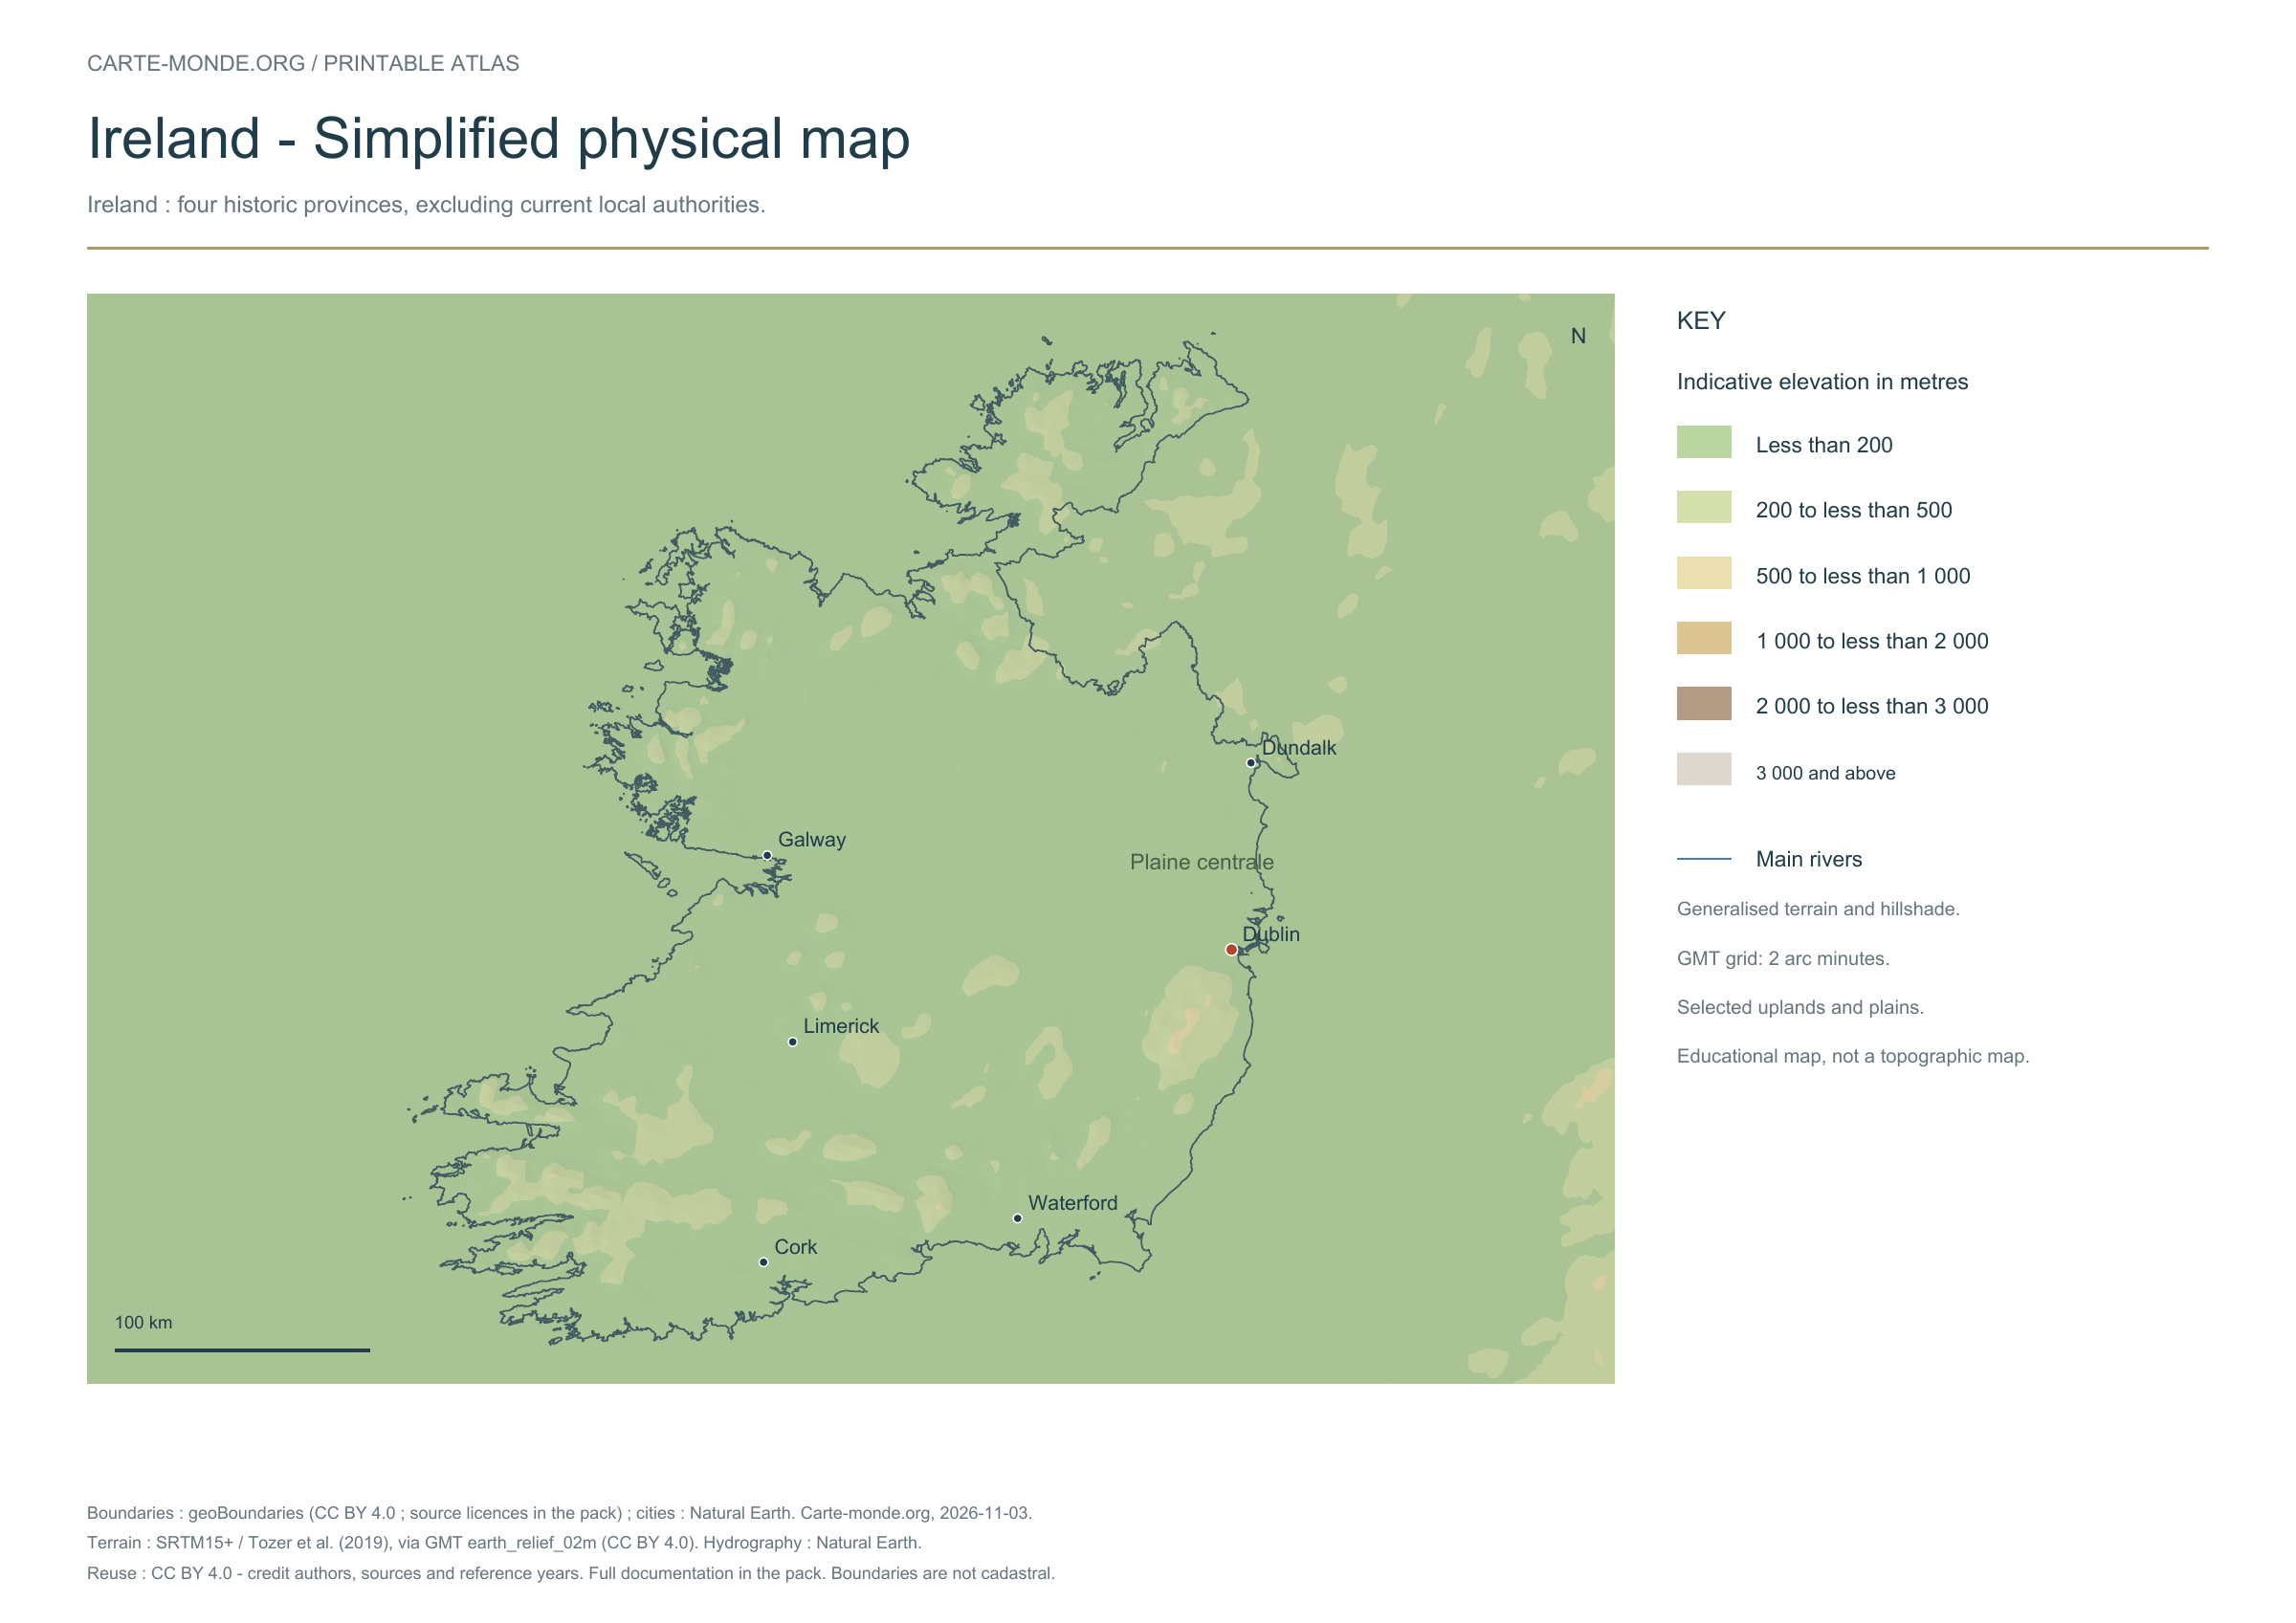
Simplified physical map — Ireland

Carte-monde.org · November 2026

Simplified elevations

Smoothed relief, elevation colours, main mountain ranges, plains and watercourses. Educational map at national scale.

A4 landscape PDF · PNG 2 400 px · CC BY 4.0

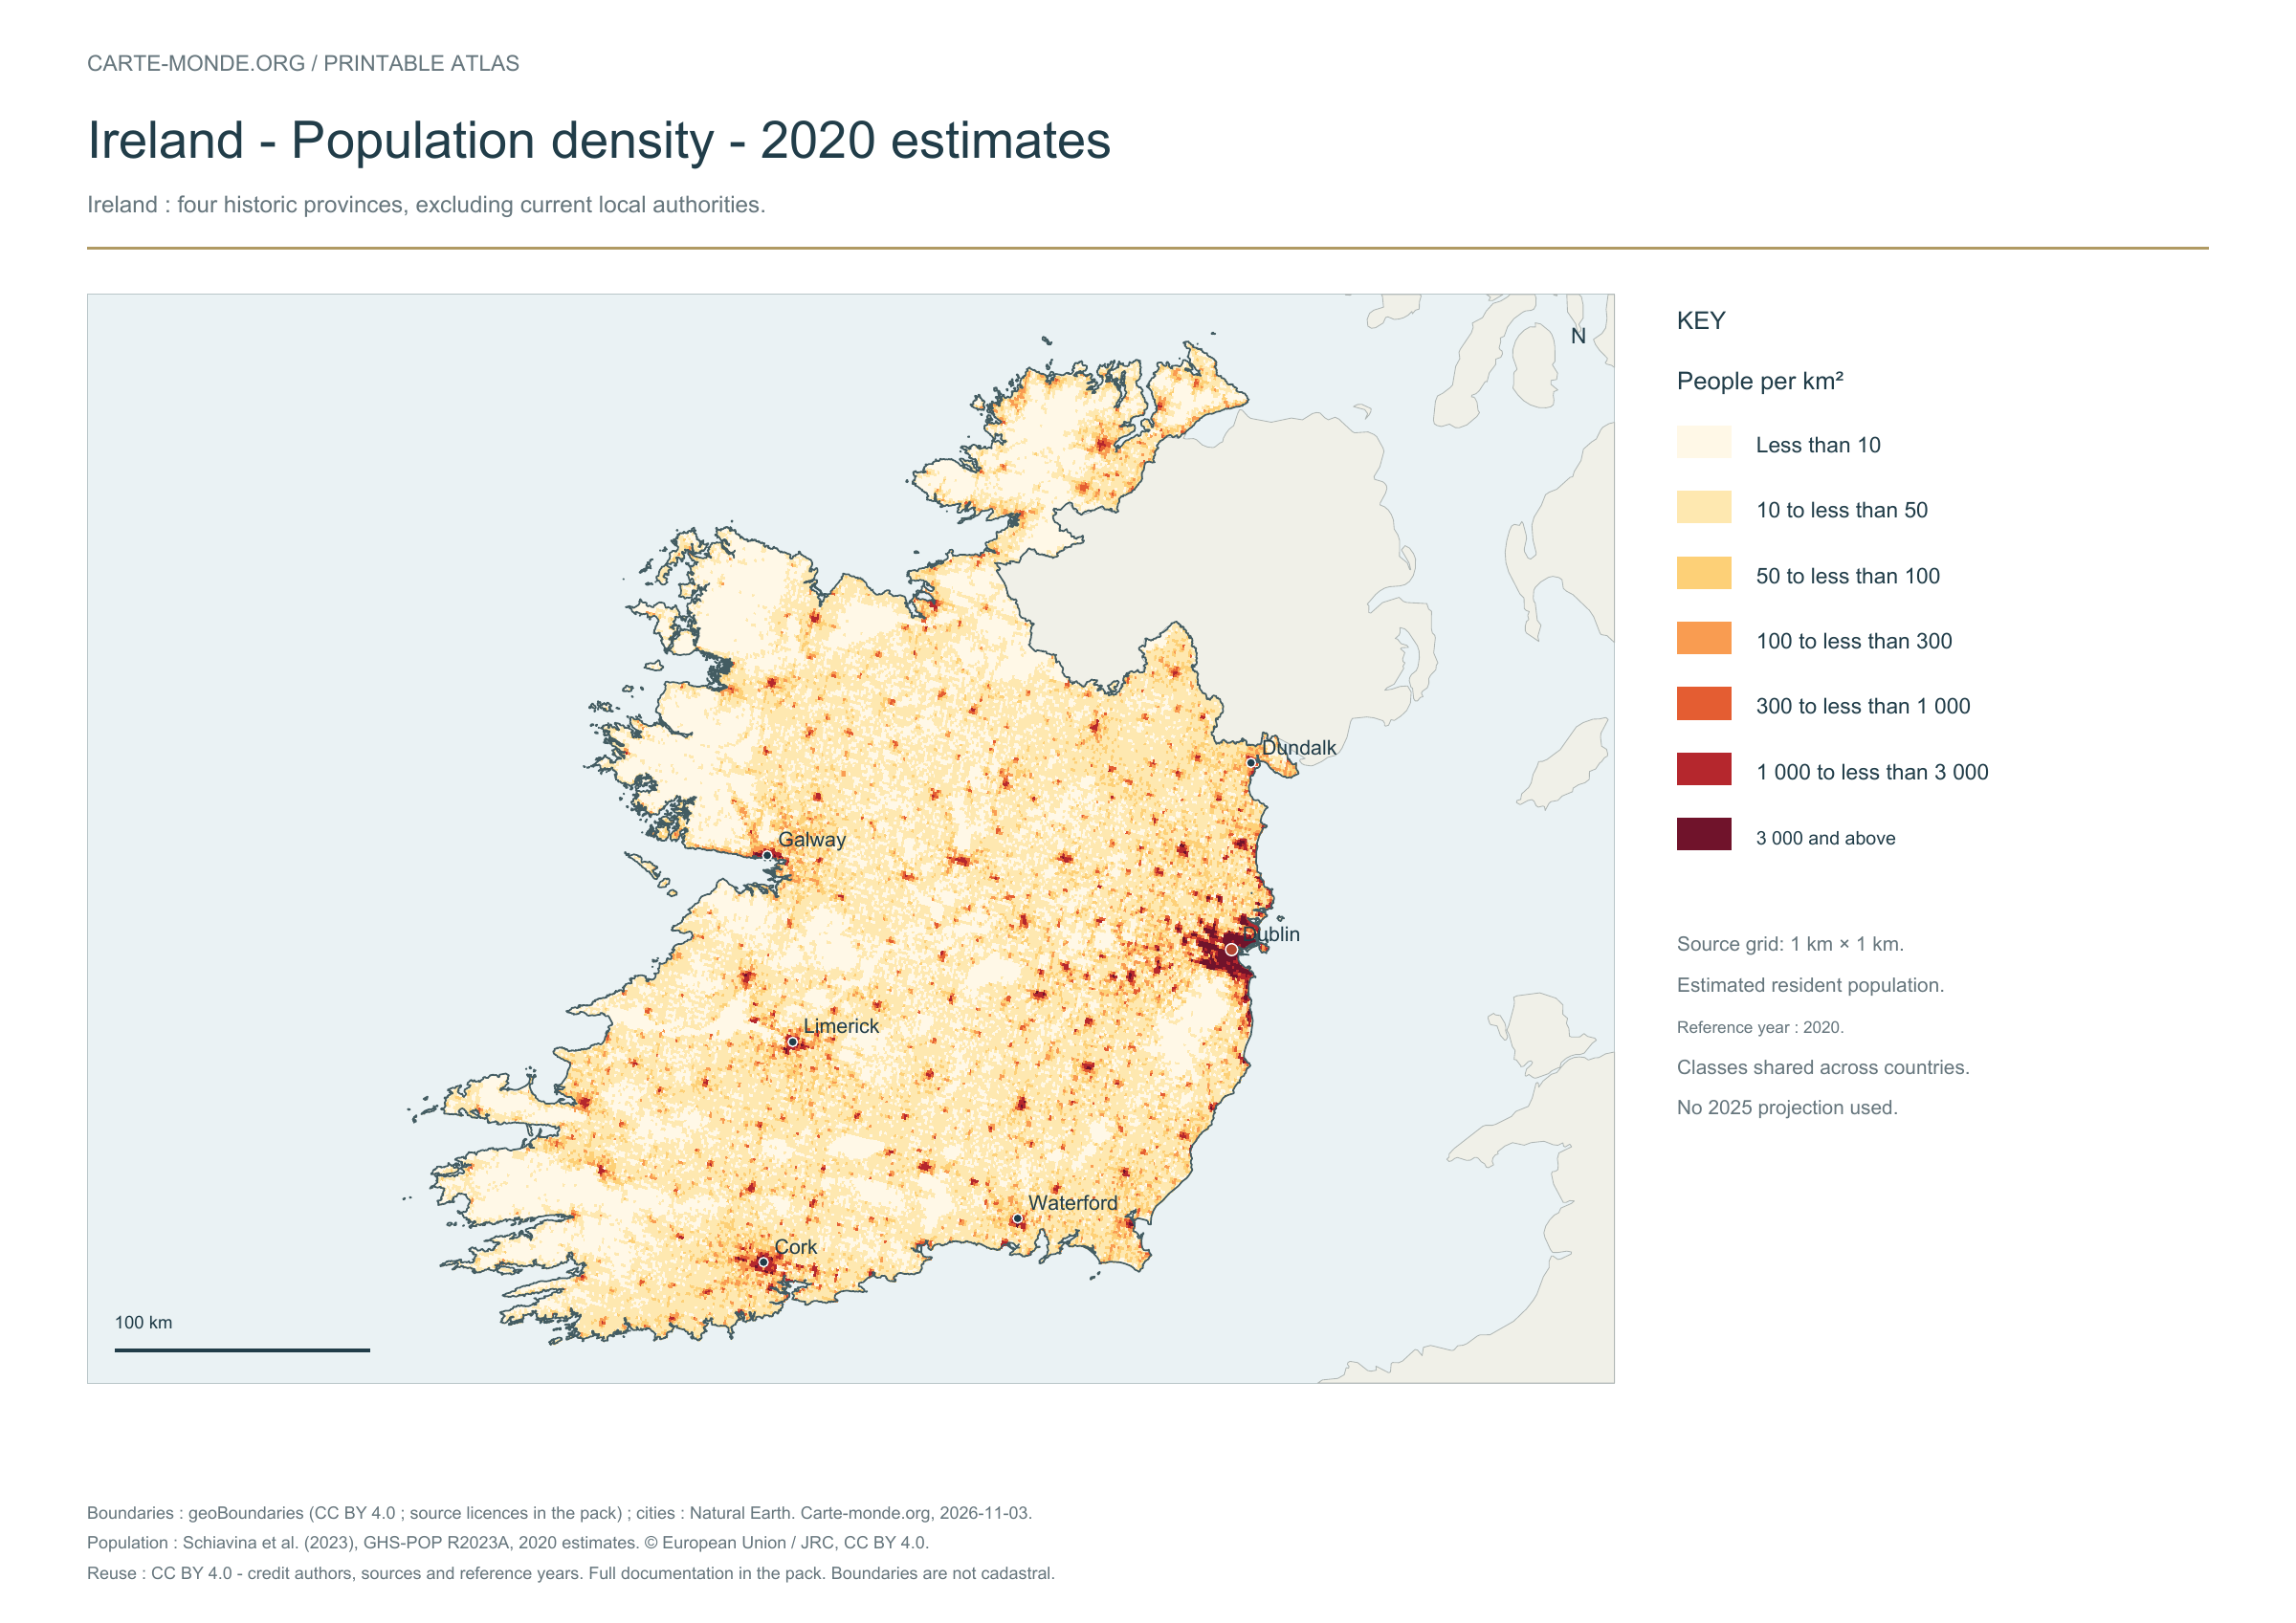
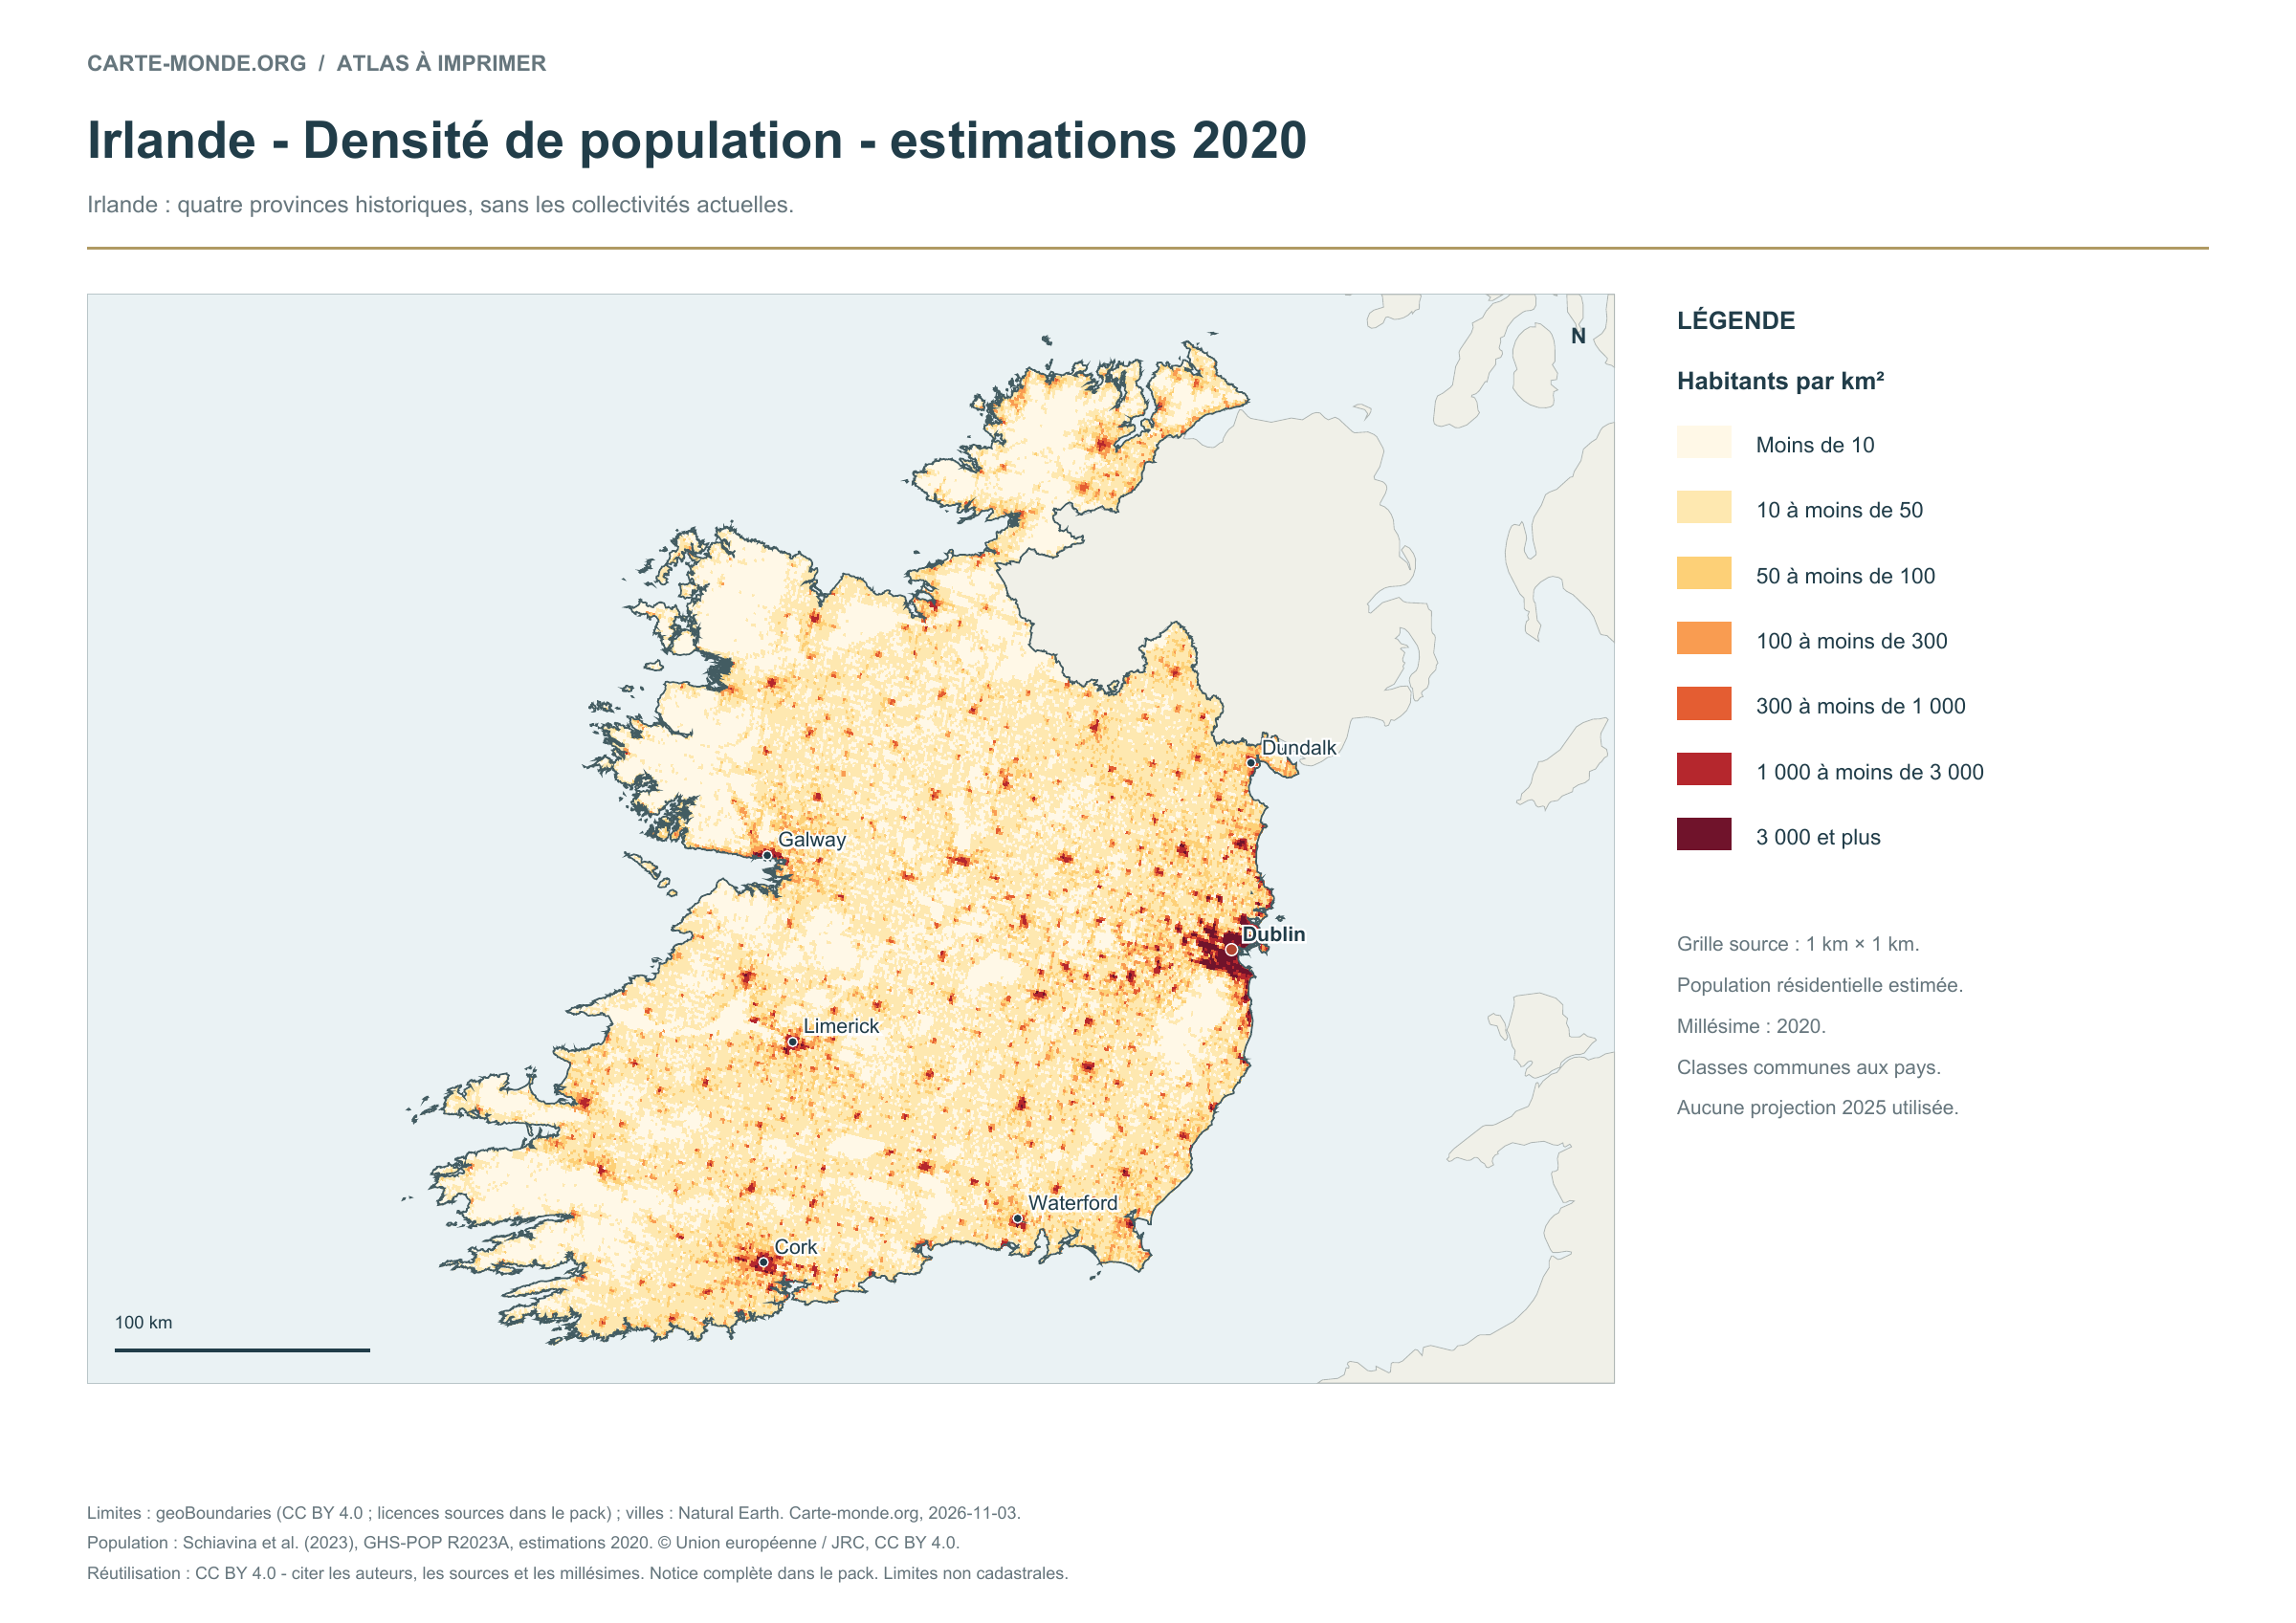
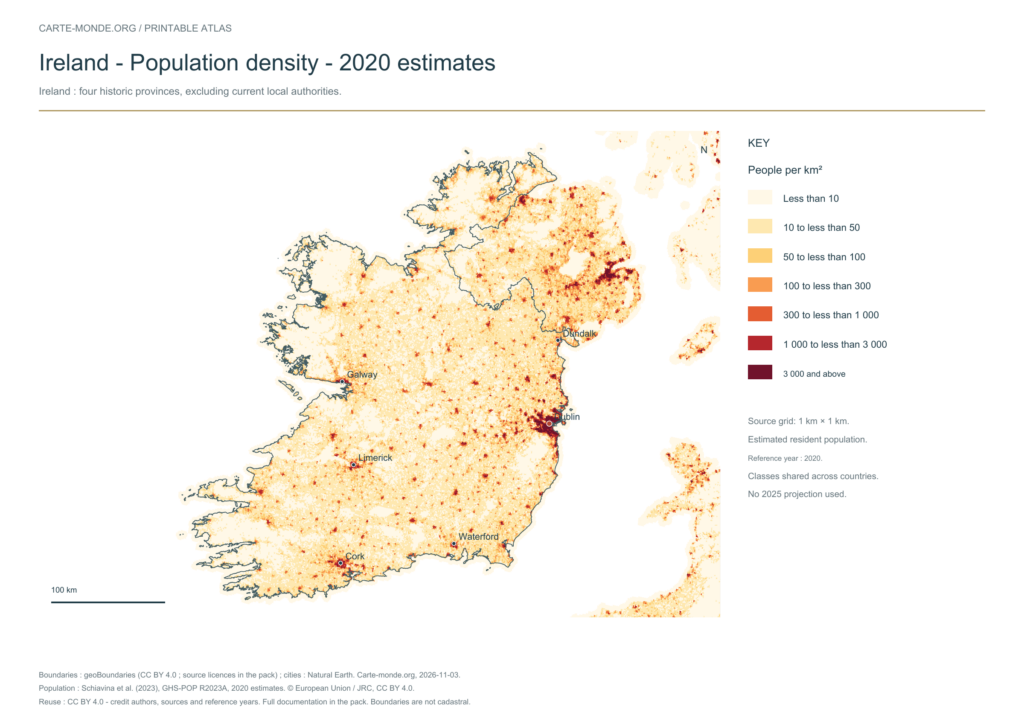
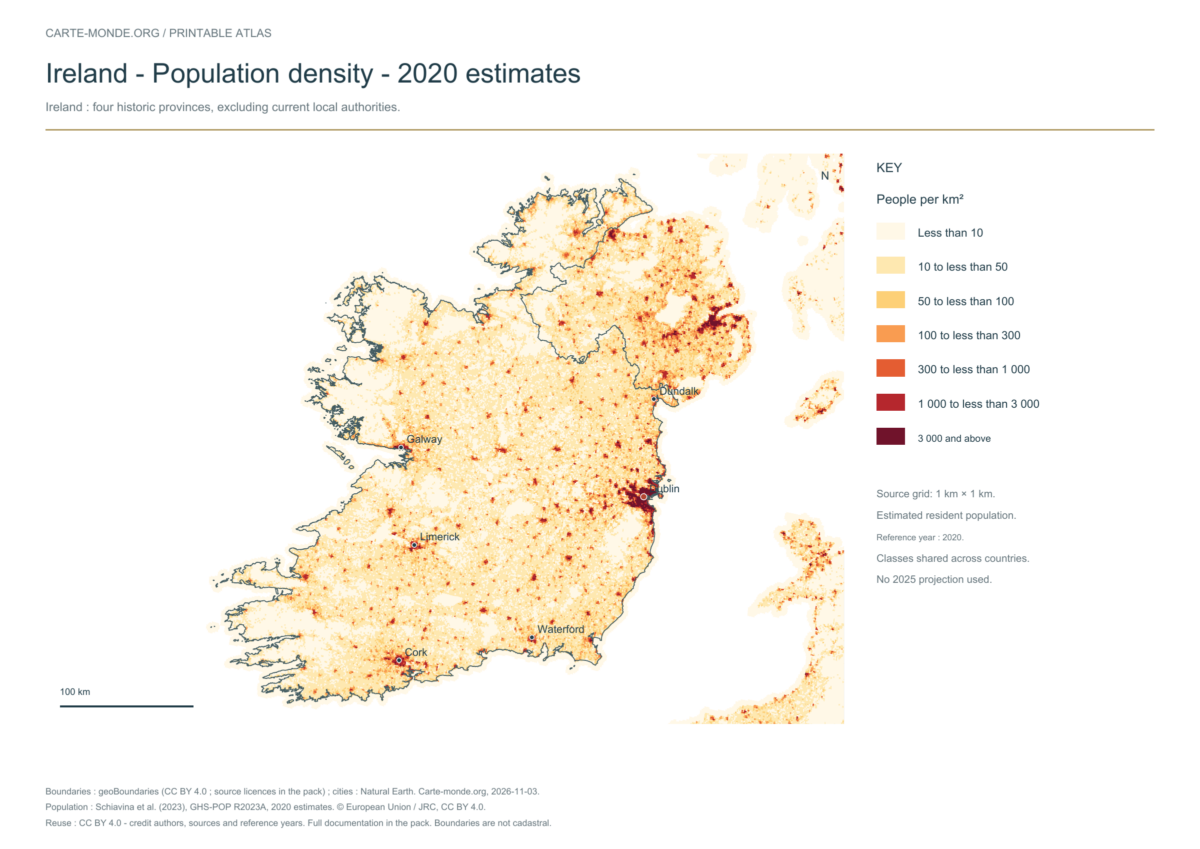
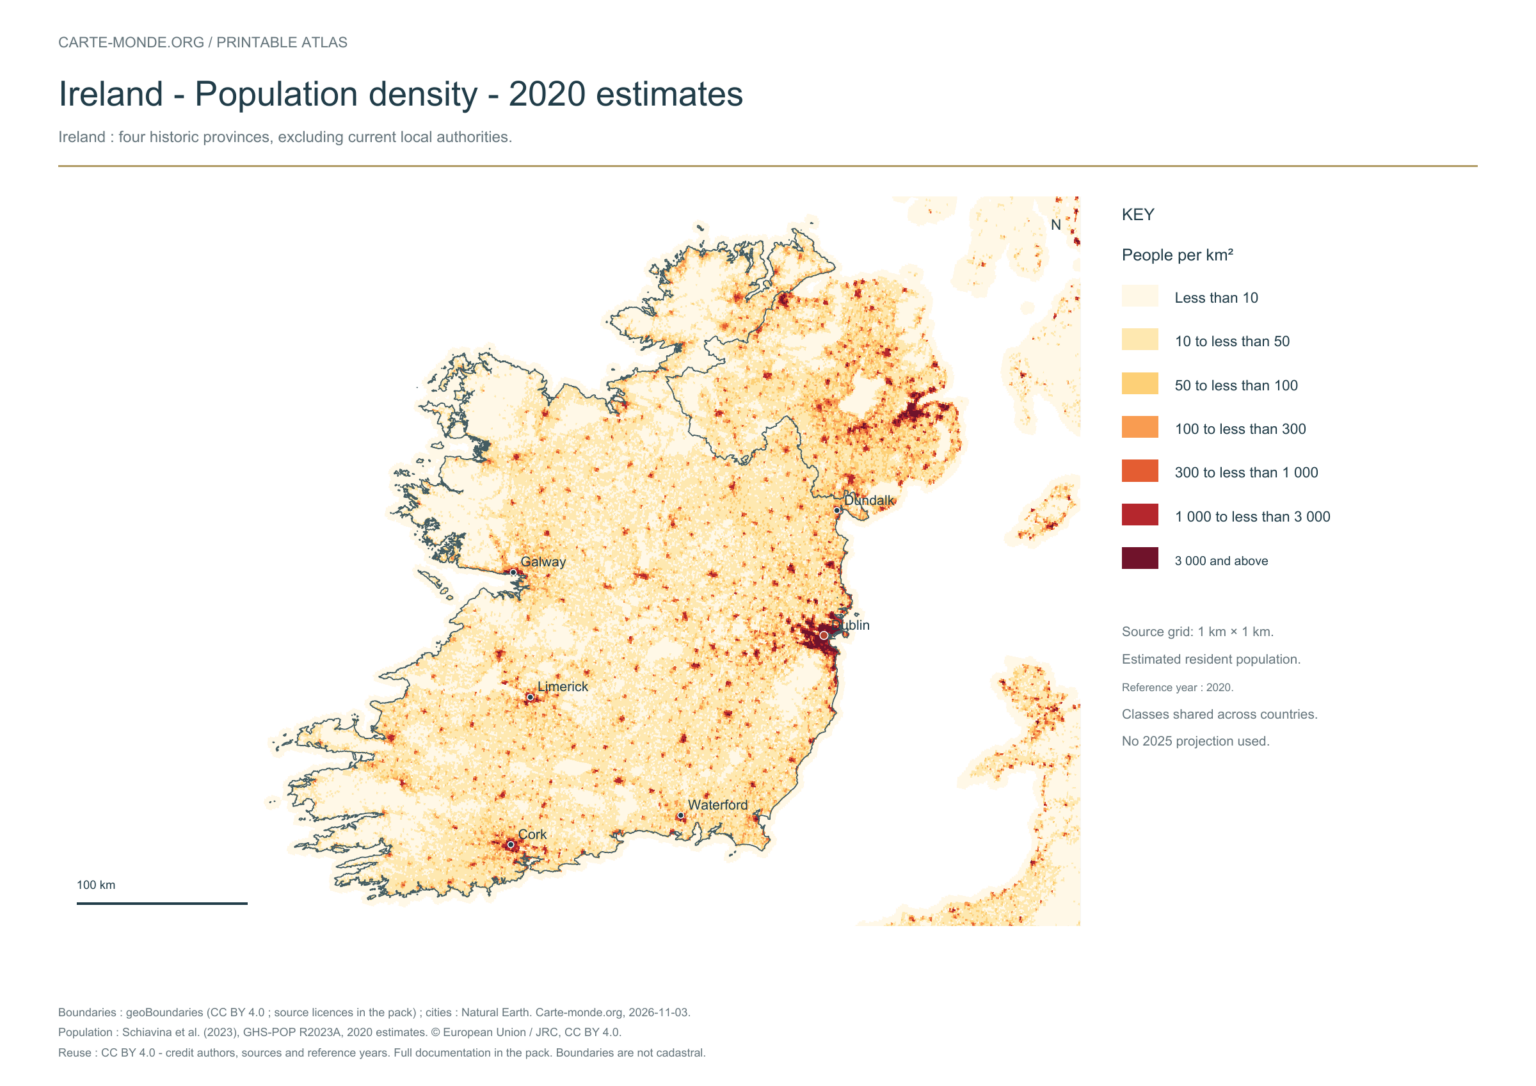
Population density: 2020 estimates

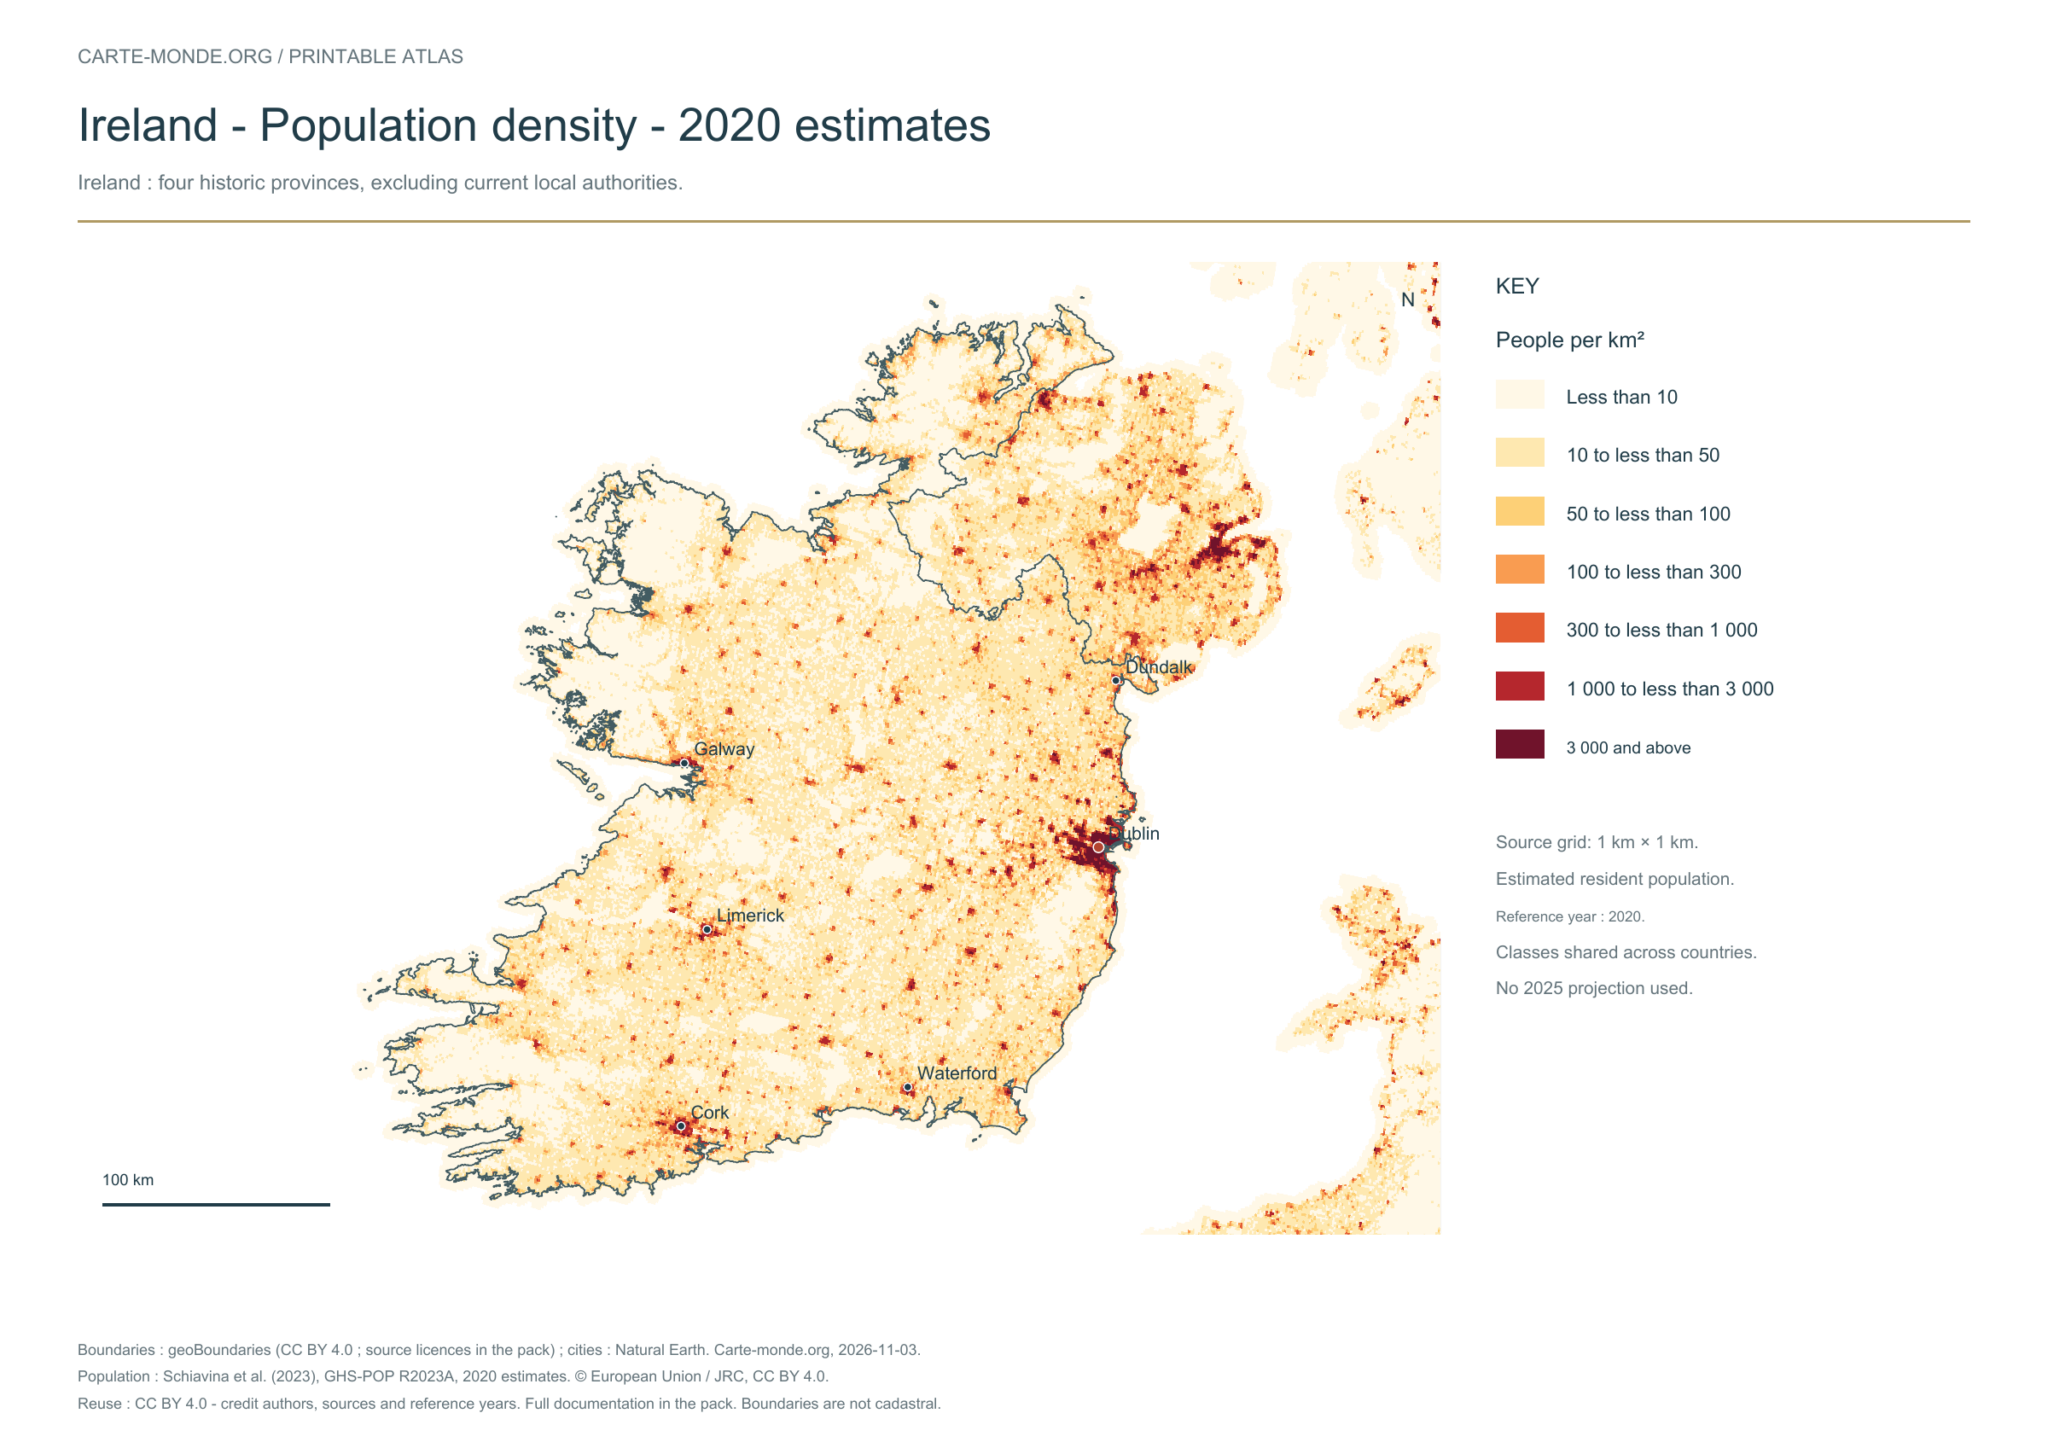
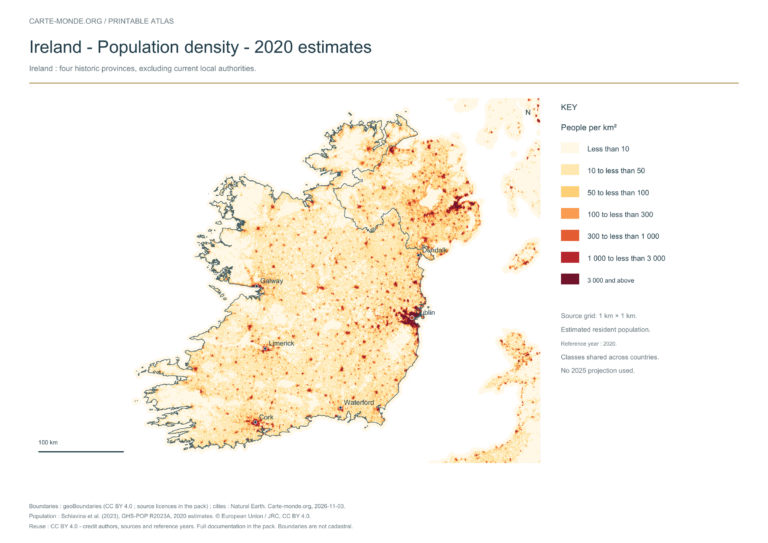
Population density — 2020 estimates — Ireland

Carte-monde.org · November 2026

Population density — 2020 estimates

Estimated residential population in 2020, on a source grid of 1 km². Inhabitants/km² classes are shared across countries; no 2025 projection.

A4 landscape PDF · PNG 2 400 px · CC BY 4.0

The data represents estimated residential population in 2020, on a 1 km² source grid. The document’s creation date does not change this reference year.

The five in-house maps in one pack

Regions and cities, location in Europe, simplified elevations, 2020 population density and shaded relief: five A4 PDFs, their PNGs and SVGs, with sources and licences.

Download the five maps — ZIP
Previous edition packs

The four maps in one pack

Four A4 PDFs, their PNGs and SVGs, with full notes. Terrain and density use an embedded image background; text and linework remain vector-based.

Download the Ireland pack — ZIP

Find the old maps of Ireland

Previously published maps remain accessible at their original URLs, with the collection’s text and credits.

Open the old maps of Ireland

Choose and print a map

Regions and cities show how the territory is organized; the location map places the country; terrain shows the main natural regions; density shows population distribution. Print the in-house PDFs in A4 landscape with “Fit to page”. Insets have their own scales.

For exercises: six blank base maps of Ireland.

Sources, reference years and reuse

Administrative boundaries: geoBoundaries / Ordce Survey Ireland. Republic of Ireland; national portions of historical provinces — Geographic data date: 2022. The file edition date does not mean that all boundaries have been updated. The provinces are historical: this blank map does not show current local authorities. Boundary source and terms. Primary license: Creative Commons Attribution 4.0 (CC BY 4.0). The geometries used and credits are included in the pack; derived databases under ODbL remain under ODbL.

Neighbouring area, cities and hydrography: Natural Earth 5.1.1, public domain, generalised boundaries not for cadastral use.

Relief: SRTM15+ / Tozer et al. (2019), reference publication, via GMT earth_relief_02m derived from SRTM15+V2.7. Grid smoothed to two arc minutes, suitable for a national overview, without topographic precision.

Population: Schiavina et al. (2023), GHS-POP R2023A, 2020 residential estimates, © European Union / JRC, CC BY 4.0. The 1 km² Mollweide cells are expressed in inhabitants/km². Methodology: Pesaresi et al. (2024).

The four new maps: created by Carte-monde.org, November 2026, under CC BY 4.0. Cite authors, sources and reference years, and indicate adaptations. Additional and older maps retain their own rights.

Country maps · Other maps and archives

Previous versions: maps and files preserved

These files remain available at their original URLs. For corrected maps, use the main links above. Each edition retains its credits and date.

Raster base map, cities, rivers and lakes: Natural Earth, public domain. Other boundary credits and licences are retained in the pack. Cartographic work CC BY 4.0; ODbL-derived data retains its licence. No topographic accuracy is claimed.

Previous collection — original files preserved
Flag of Ireland
Flag of Ireland
Ireland downloadable maps
administrative map of Ireland
Map of Ireland
Map of Ireland
Original French files
Previous language edition

Maps of Italy: regions, cities, relief and population

Flag of Italy
Flag of Italy

ITALY · PRINTABLE MAPS

Five printable maps of Italy: regions and cities, location in Europe, two views of the relief and population. PDFs, images and sources are available below.

Our five maps have English labels. Maps from other publishers retain their original language.

Regions, cities and location in Europe

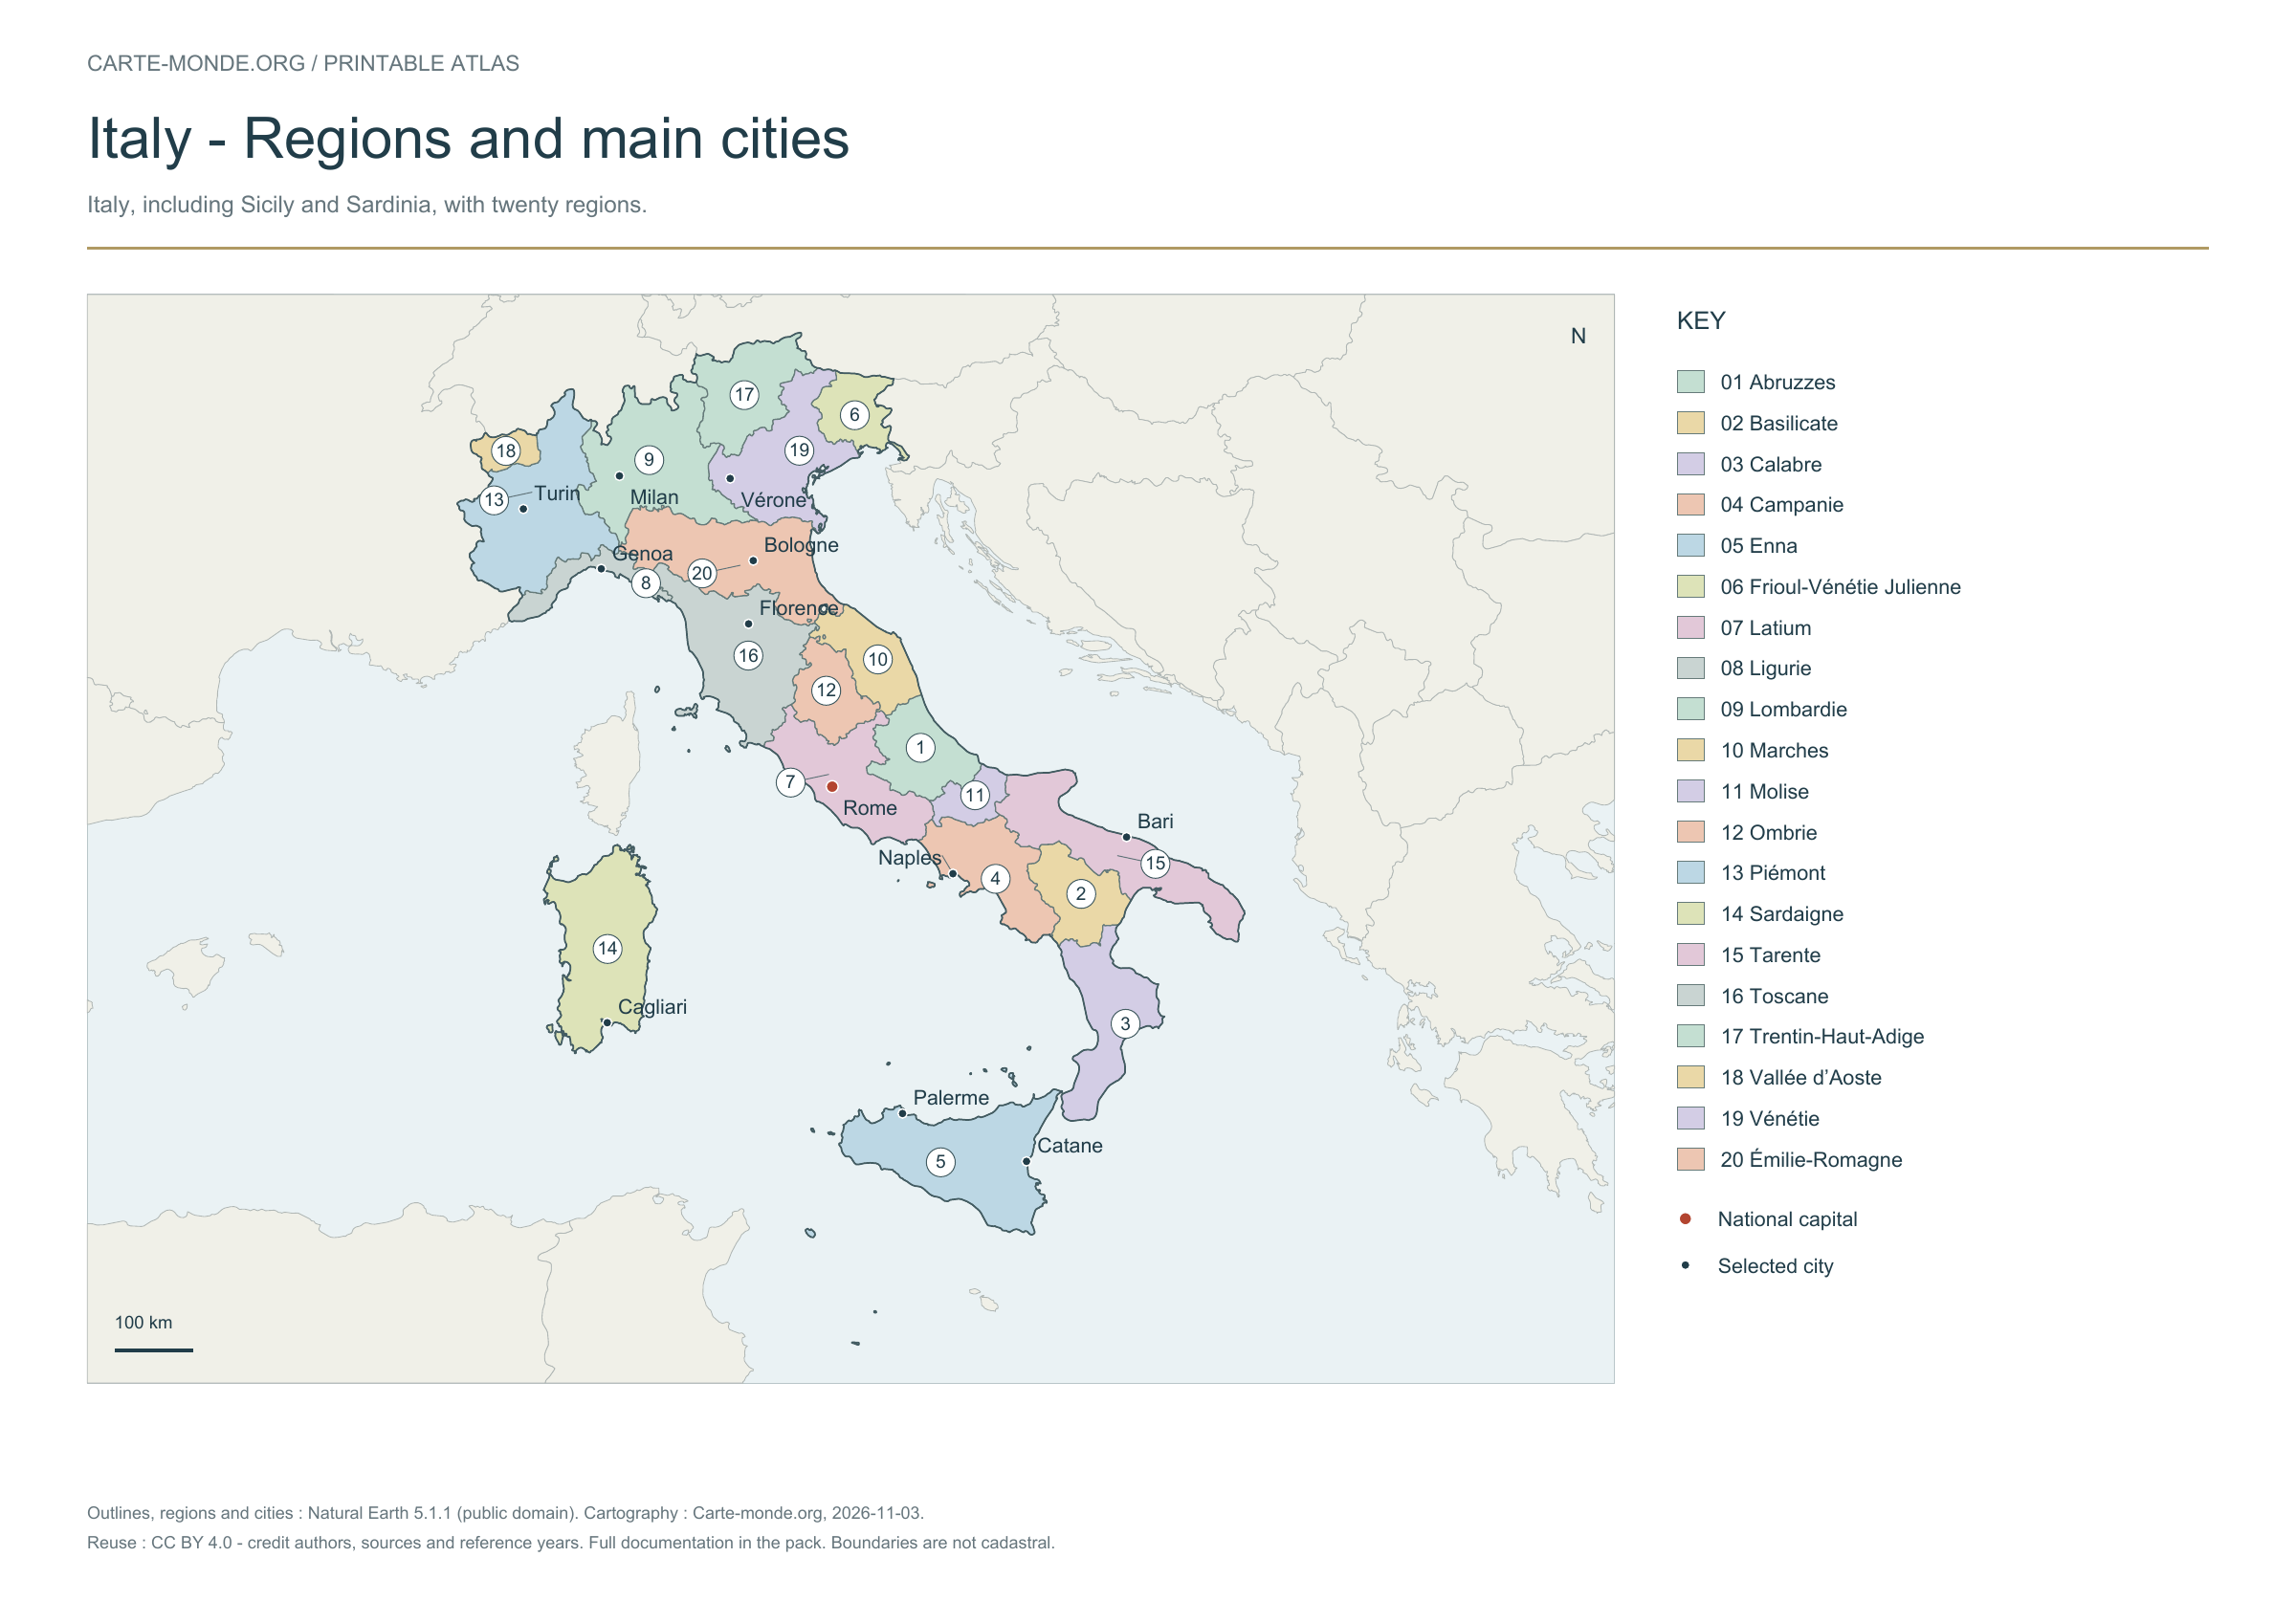
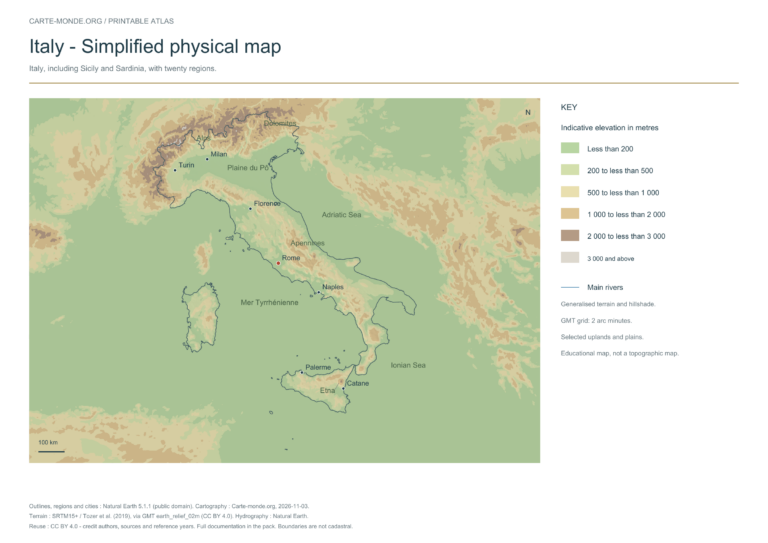
Italy, including Sicily and Sardinia; twenty regions.

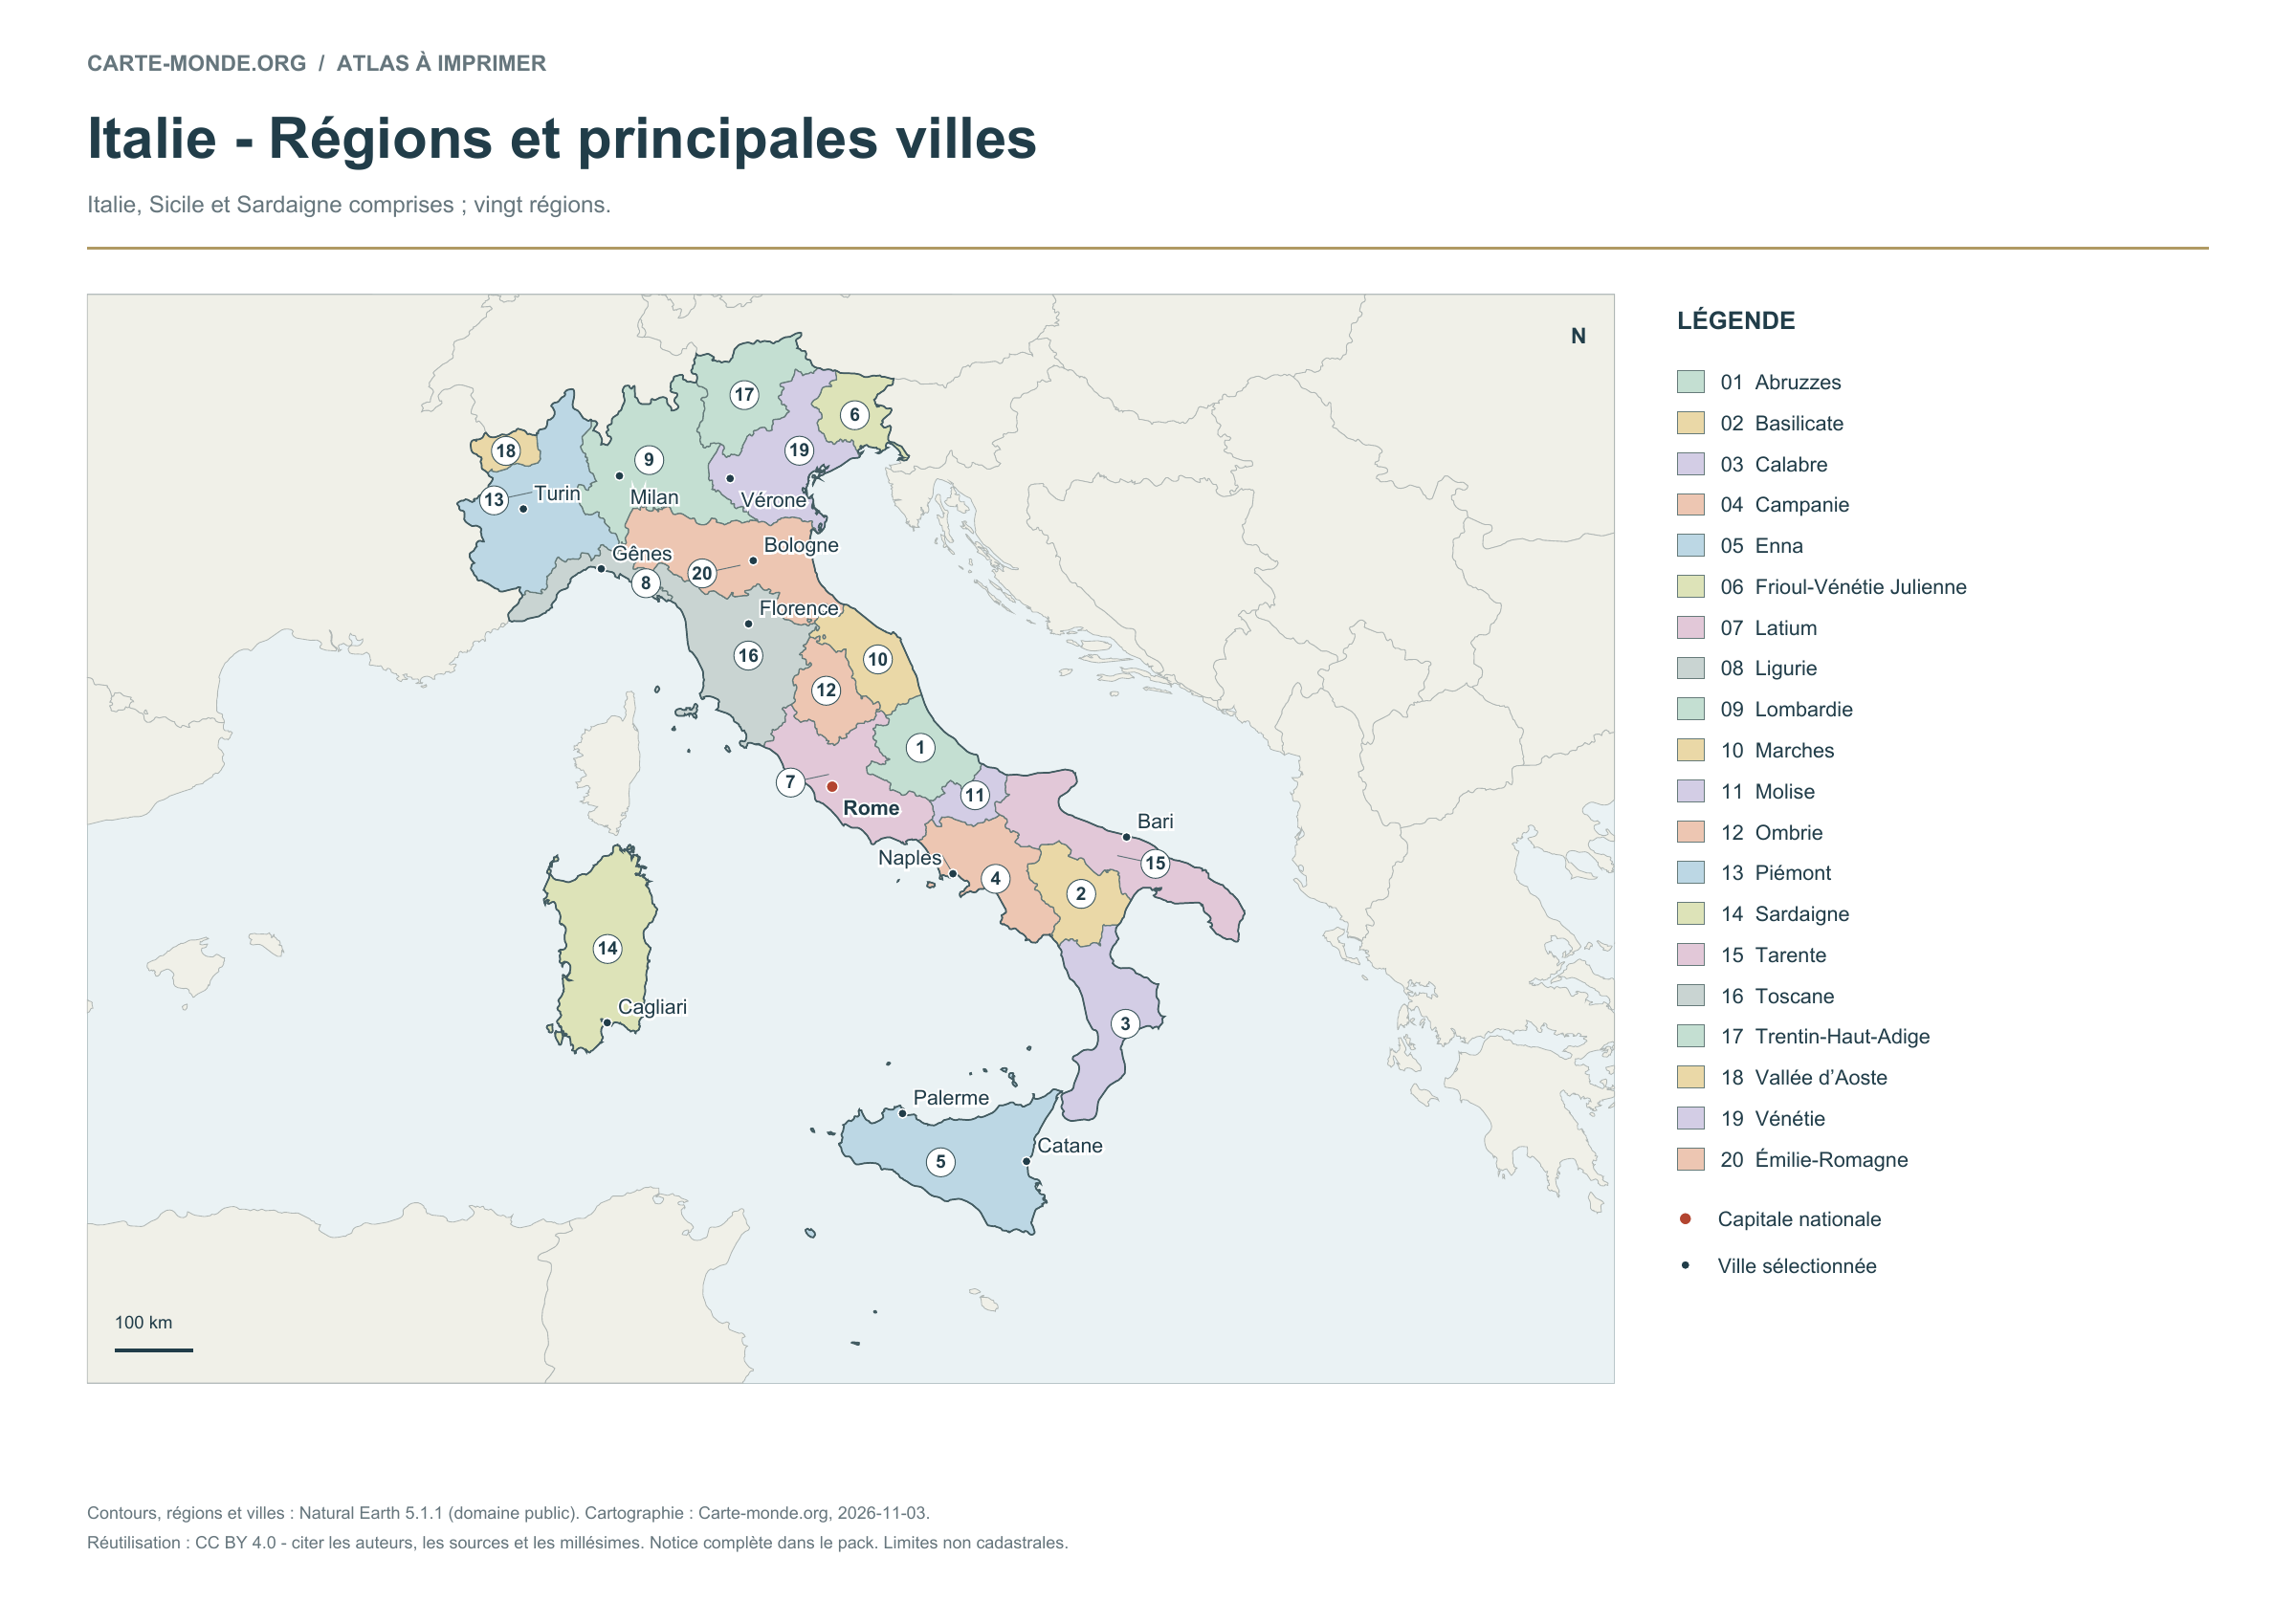
Regions and main cities — Italy

Carte-monde.org · November 2026

Regions and main cities

The 20 regions are numbered and named in the legend, with selected cities and the capital.

A4 landscape PDF · PNG 2 400 px · CC BY 4.0

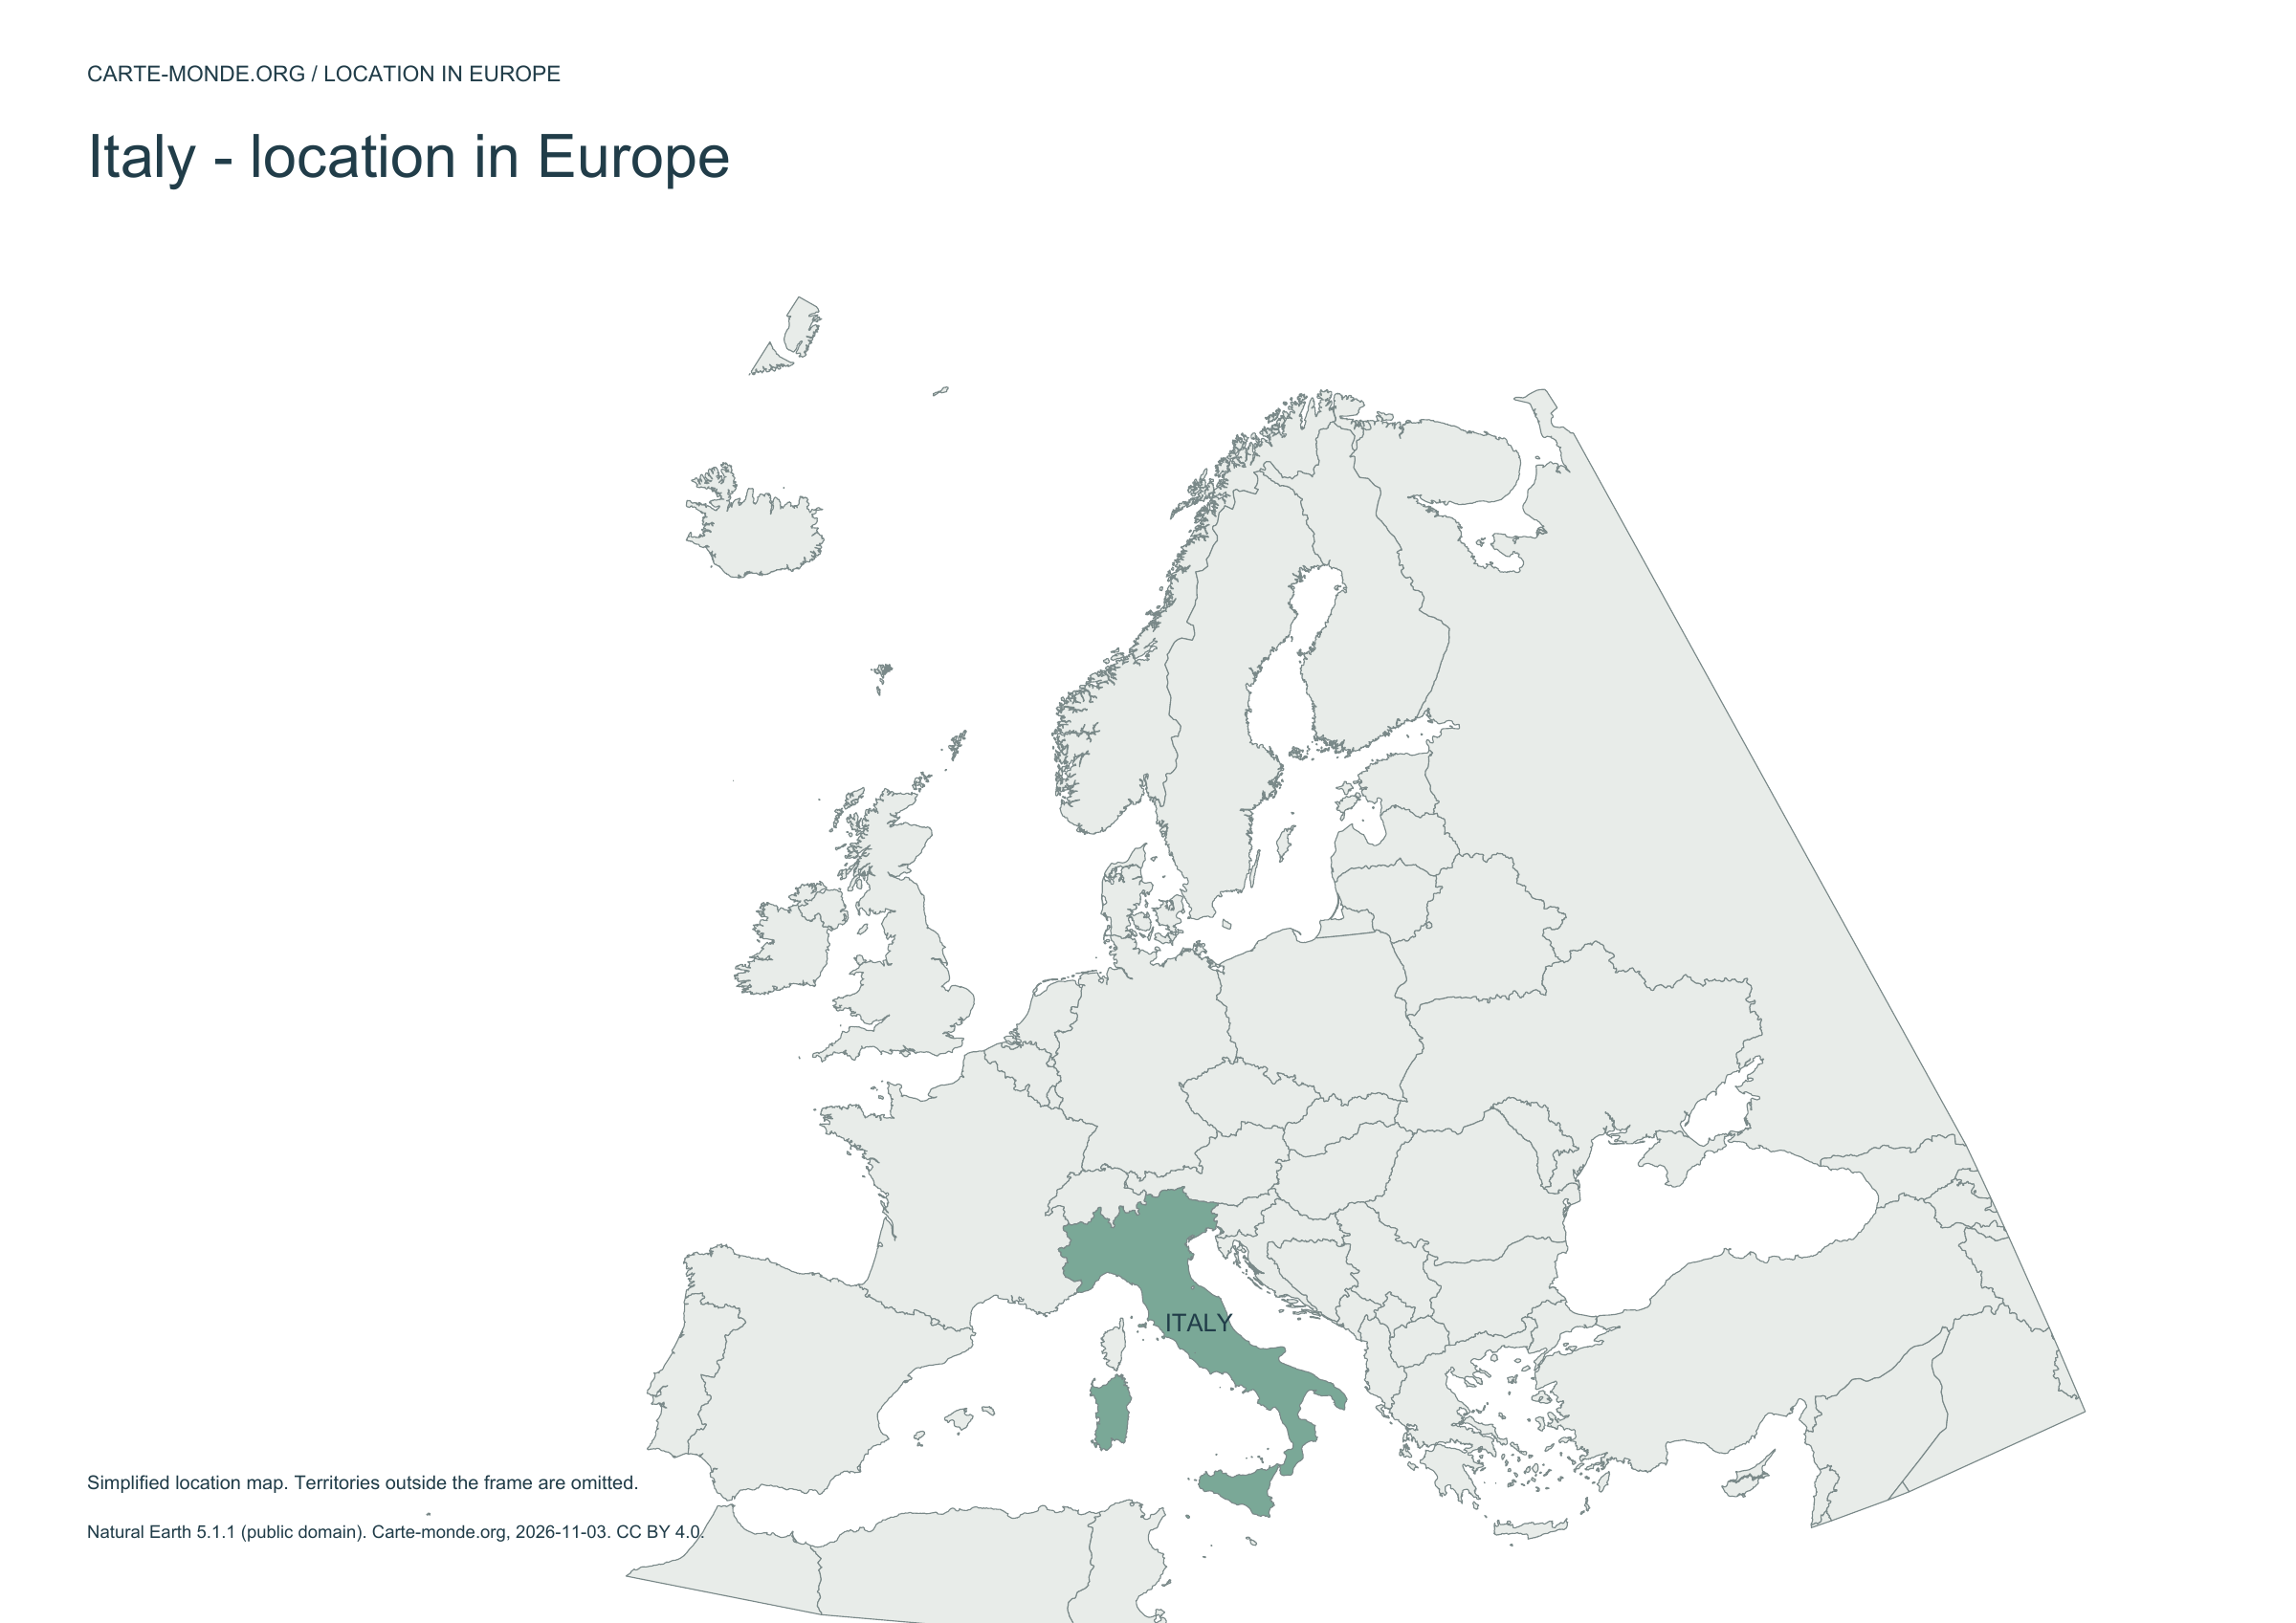
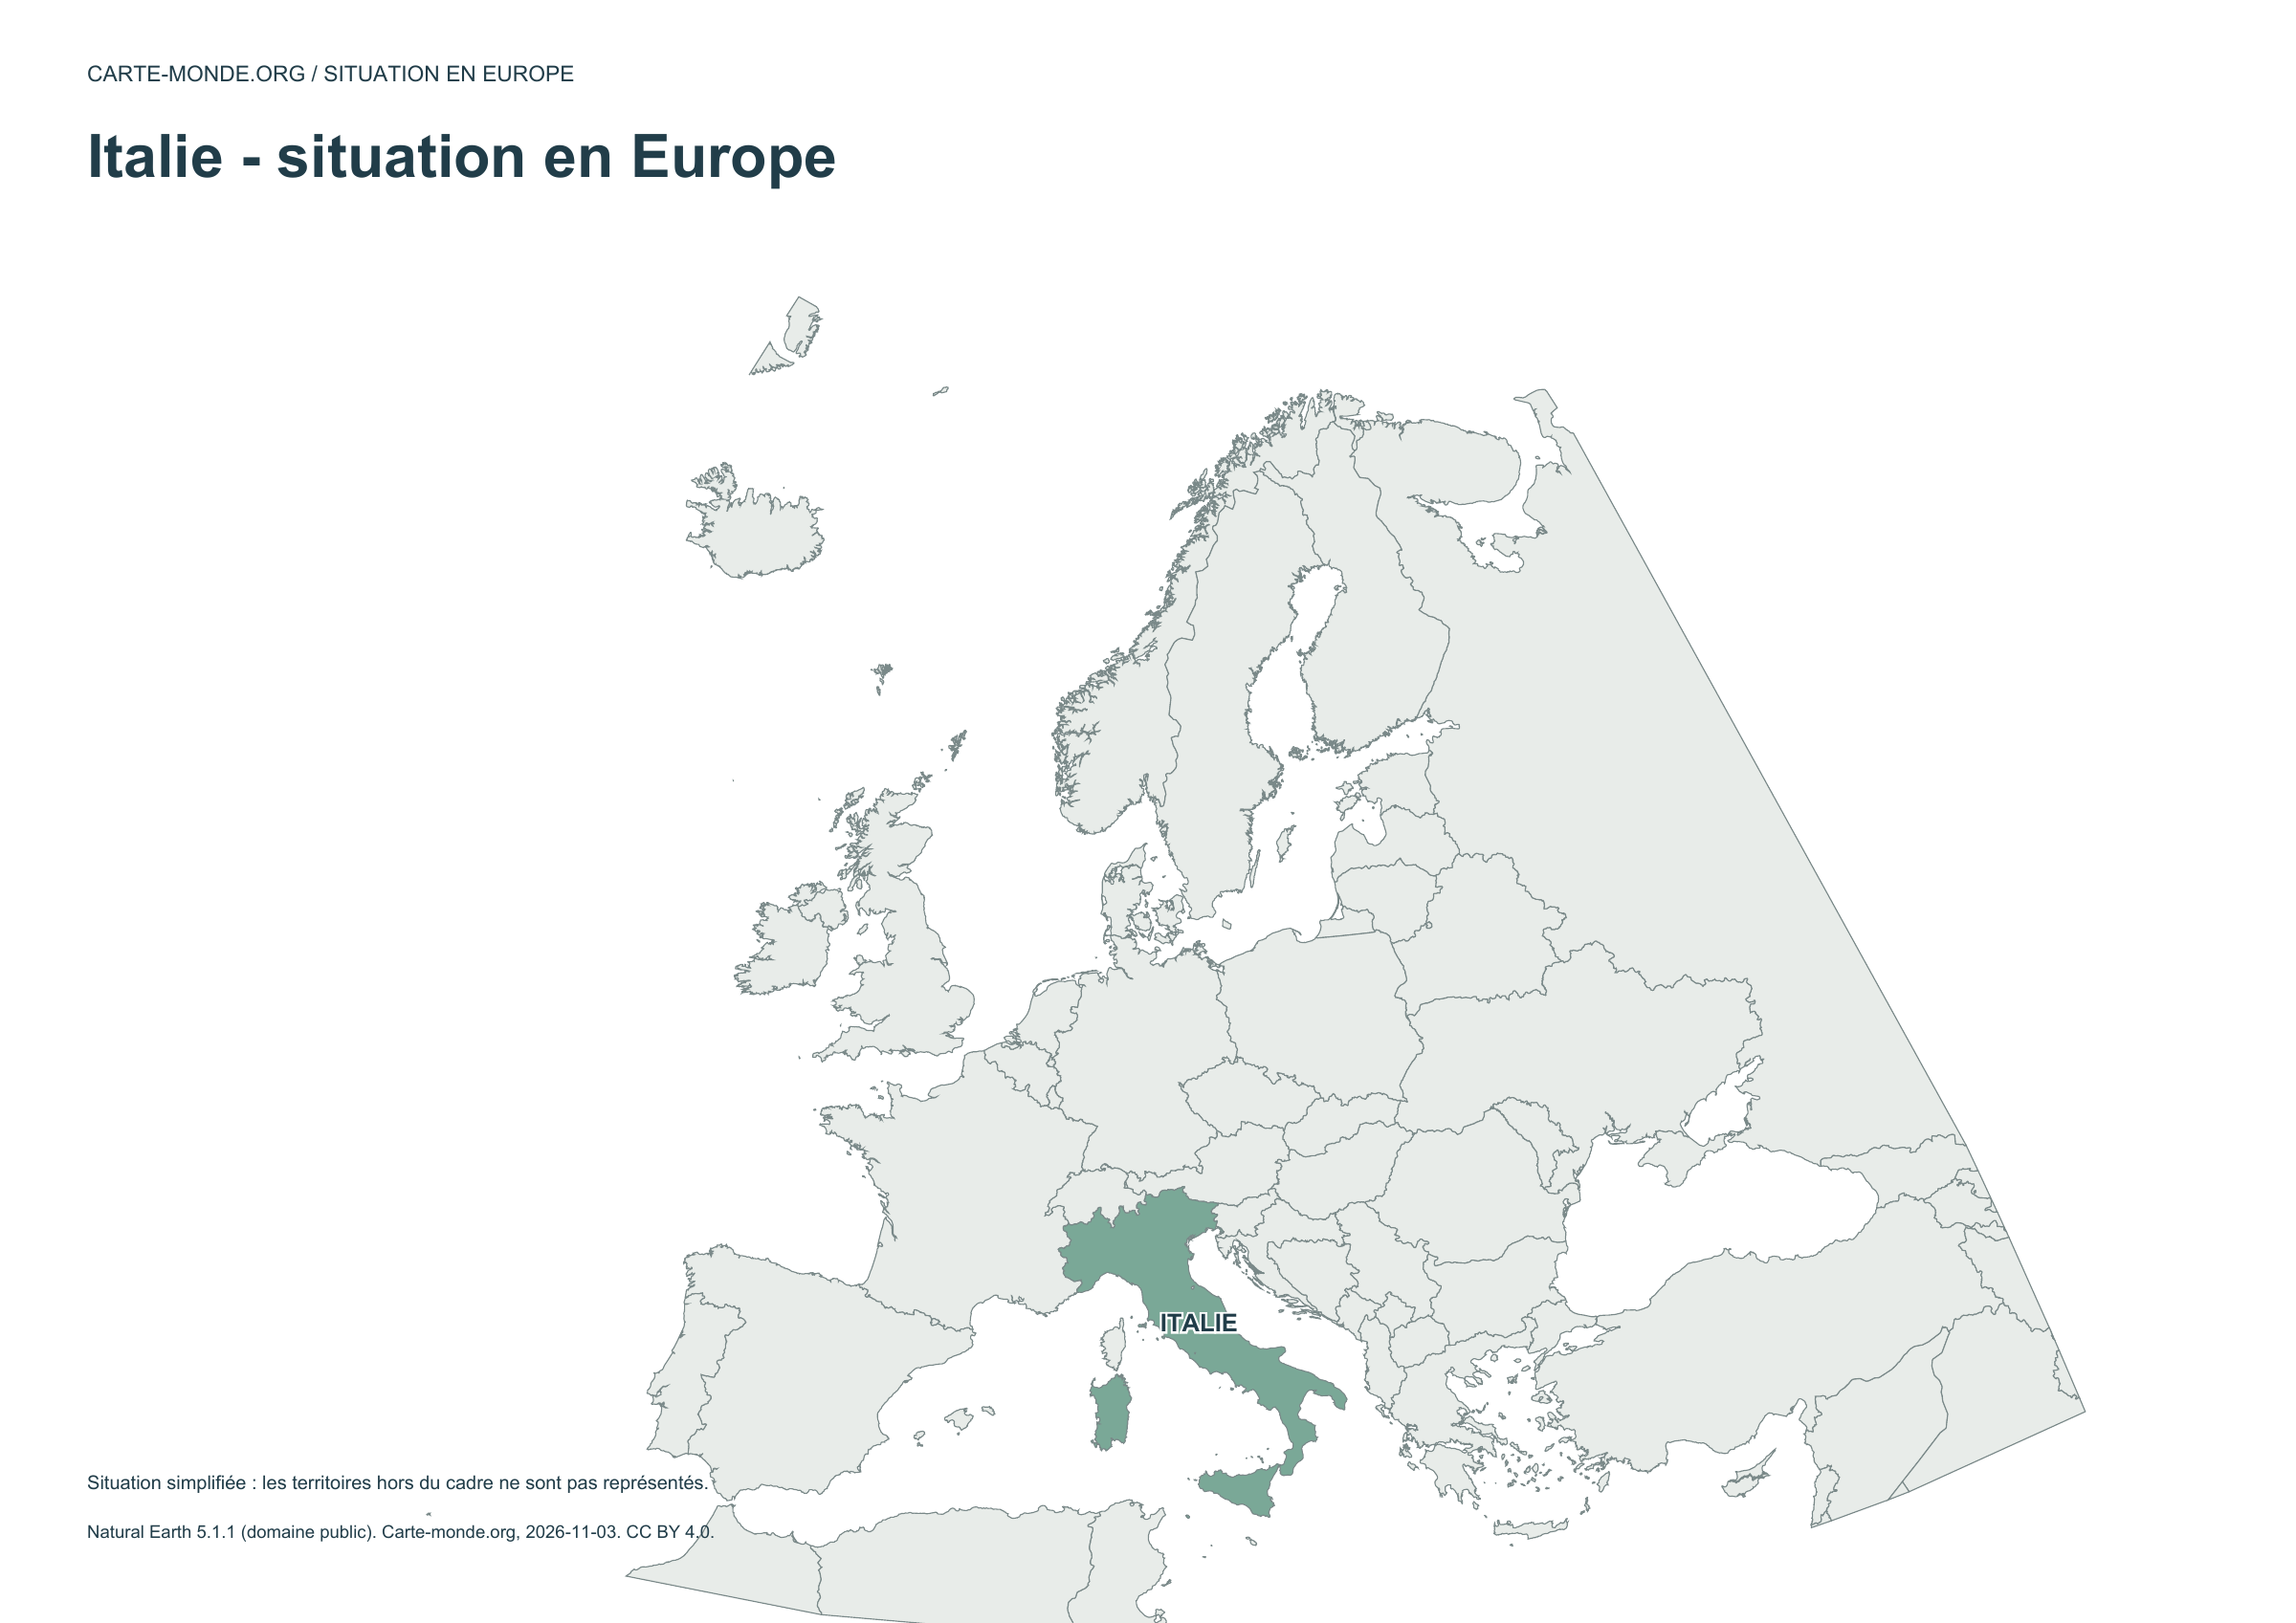
Location in Europe — Italy

Carte-monde.org · November 2026

Location in Europe

The country is highlighted within a simplified European frame; territories outside this frame are not shown.

A4 landscape PDF · PNG 2 400 px · CC BY 4.0

Two maps to understand the relief

Choose shaded relief for an overview, or elevation classes for school use.

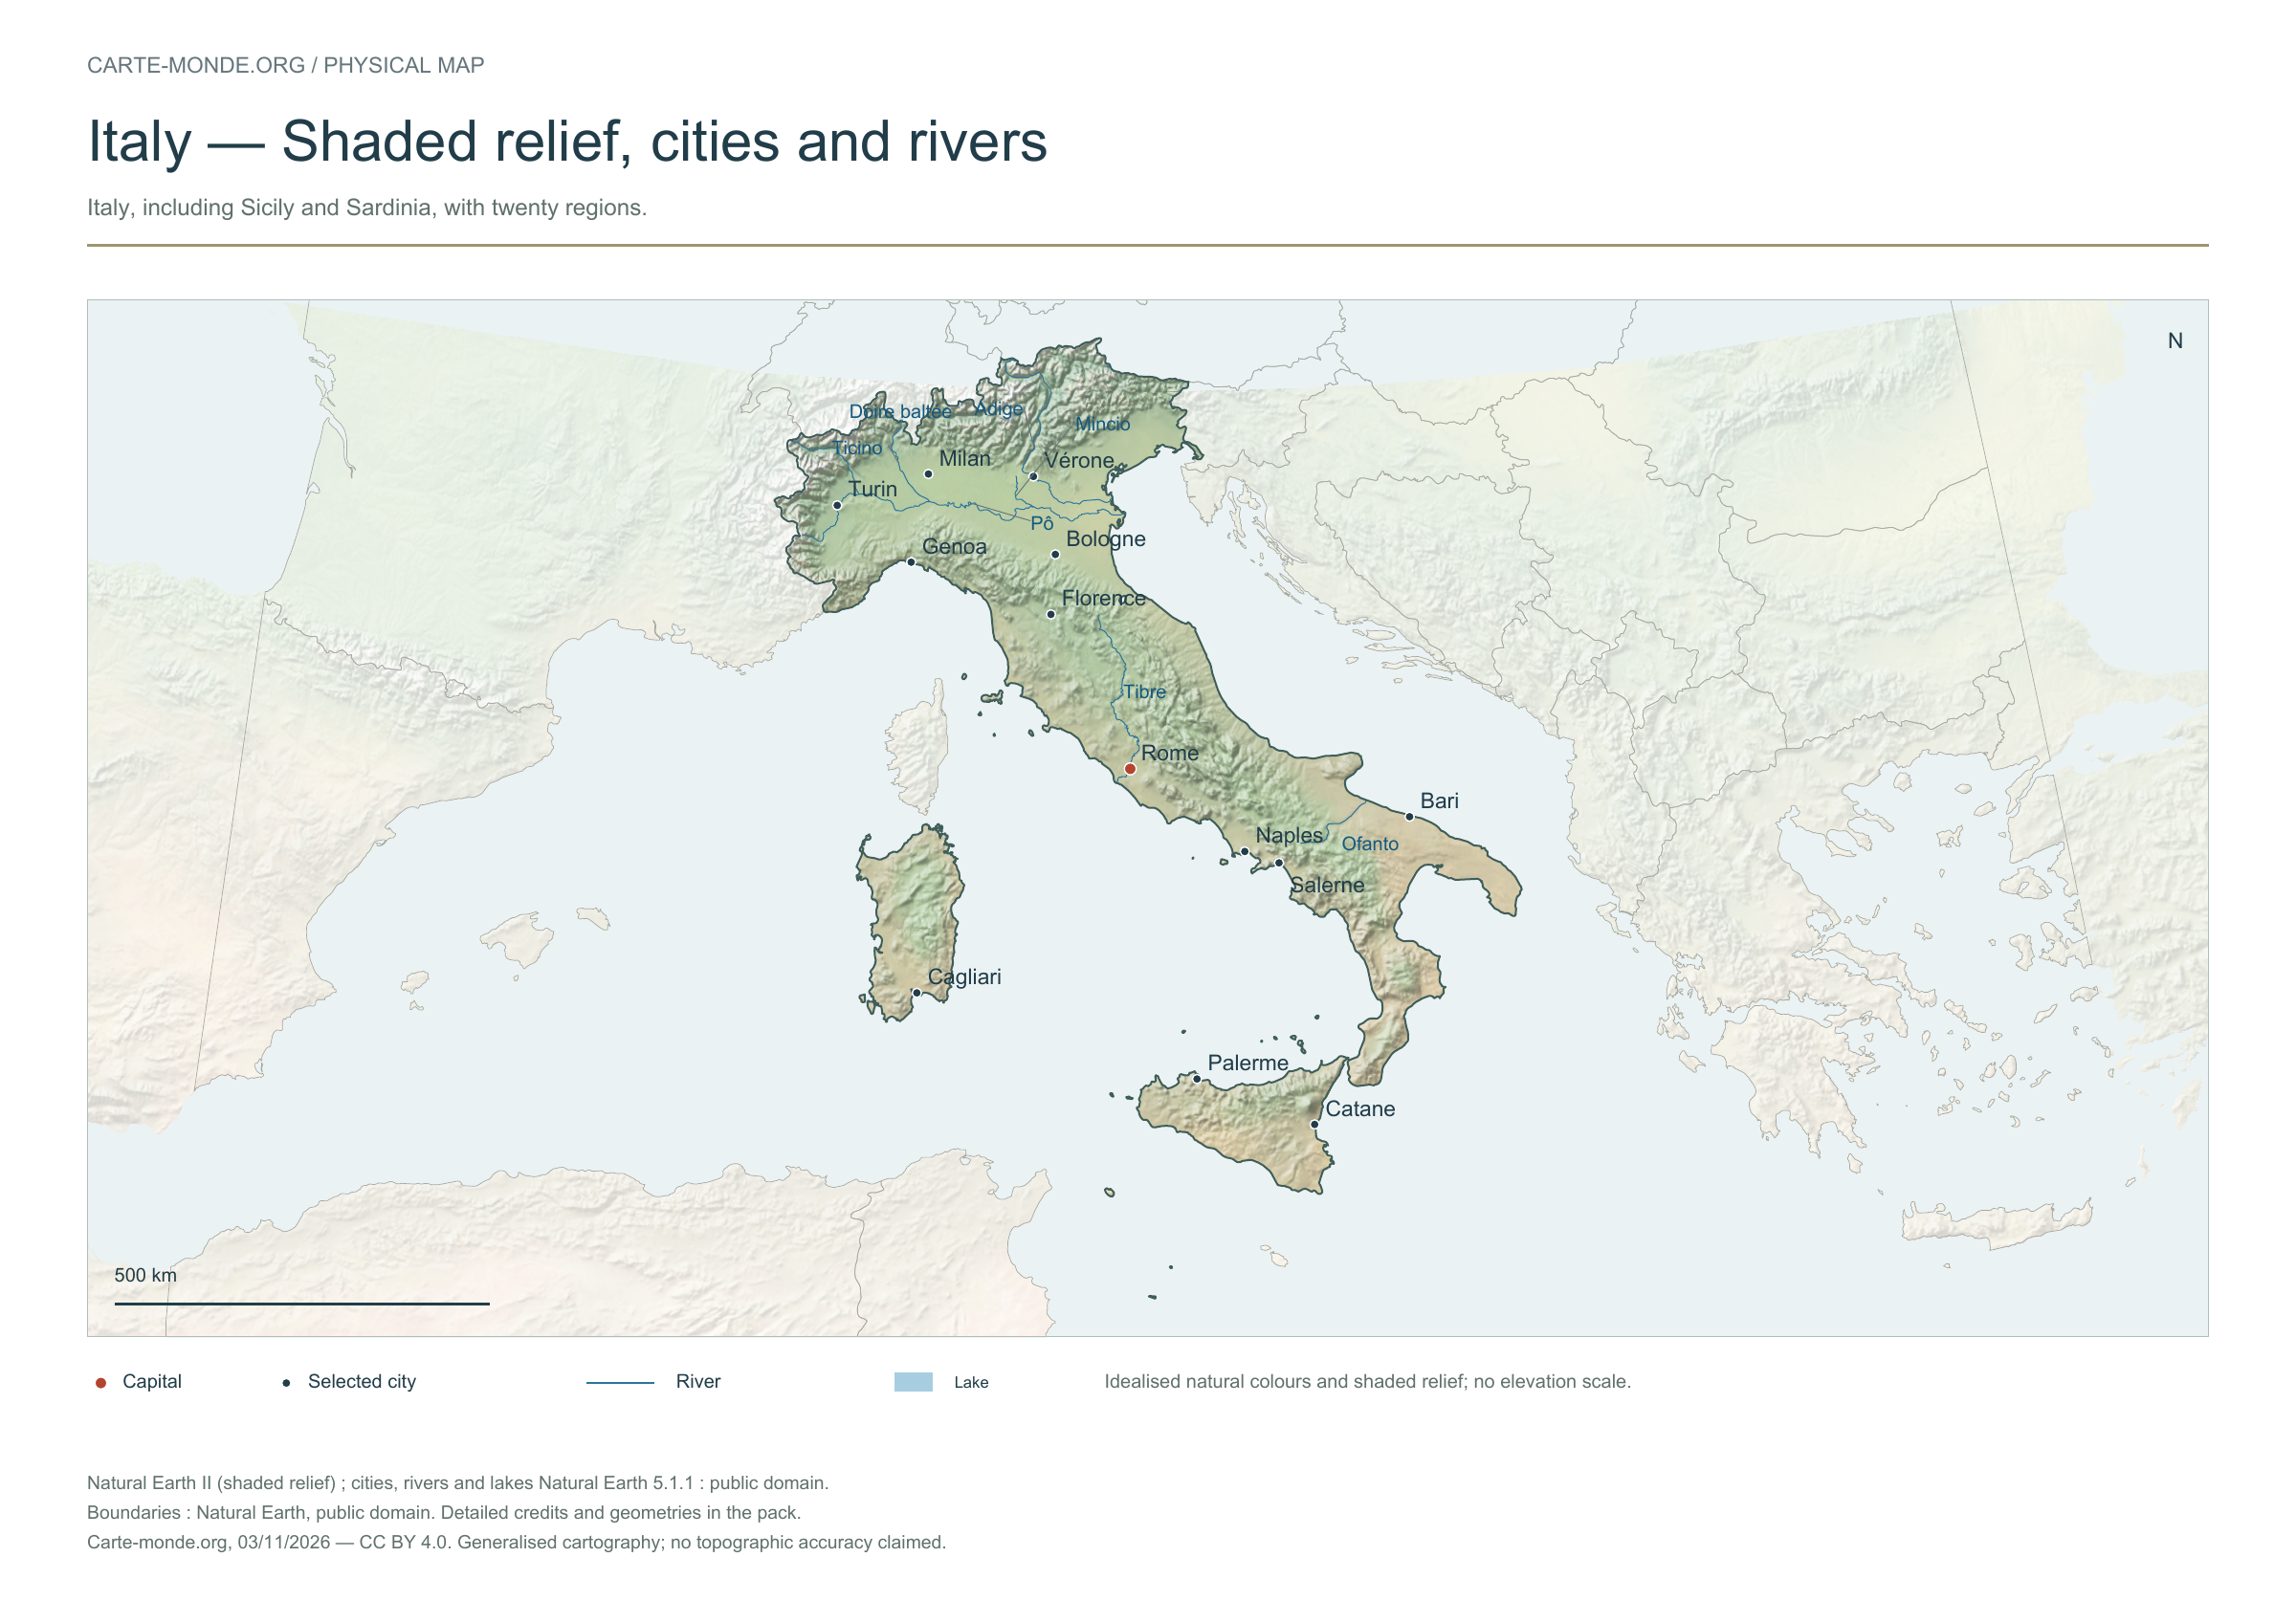
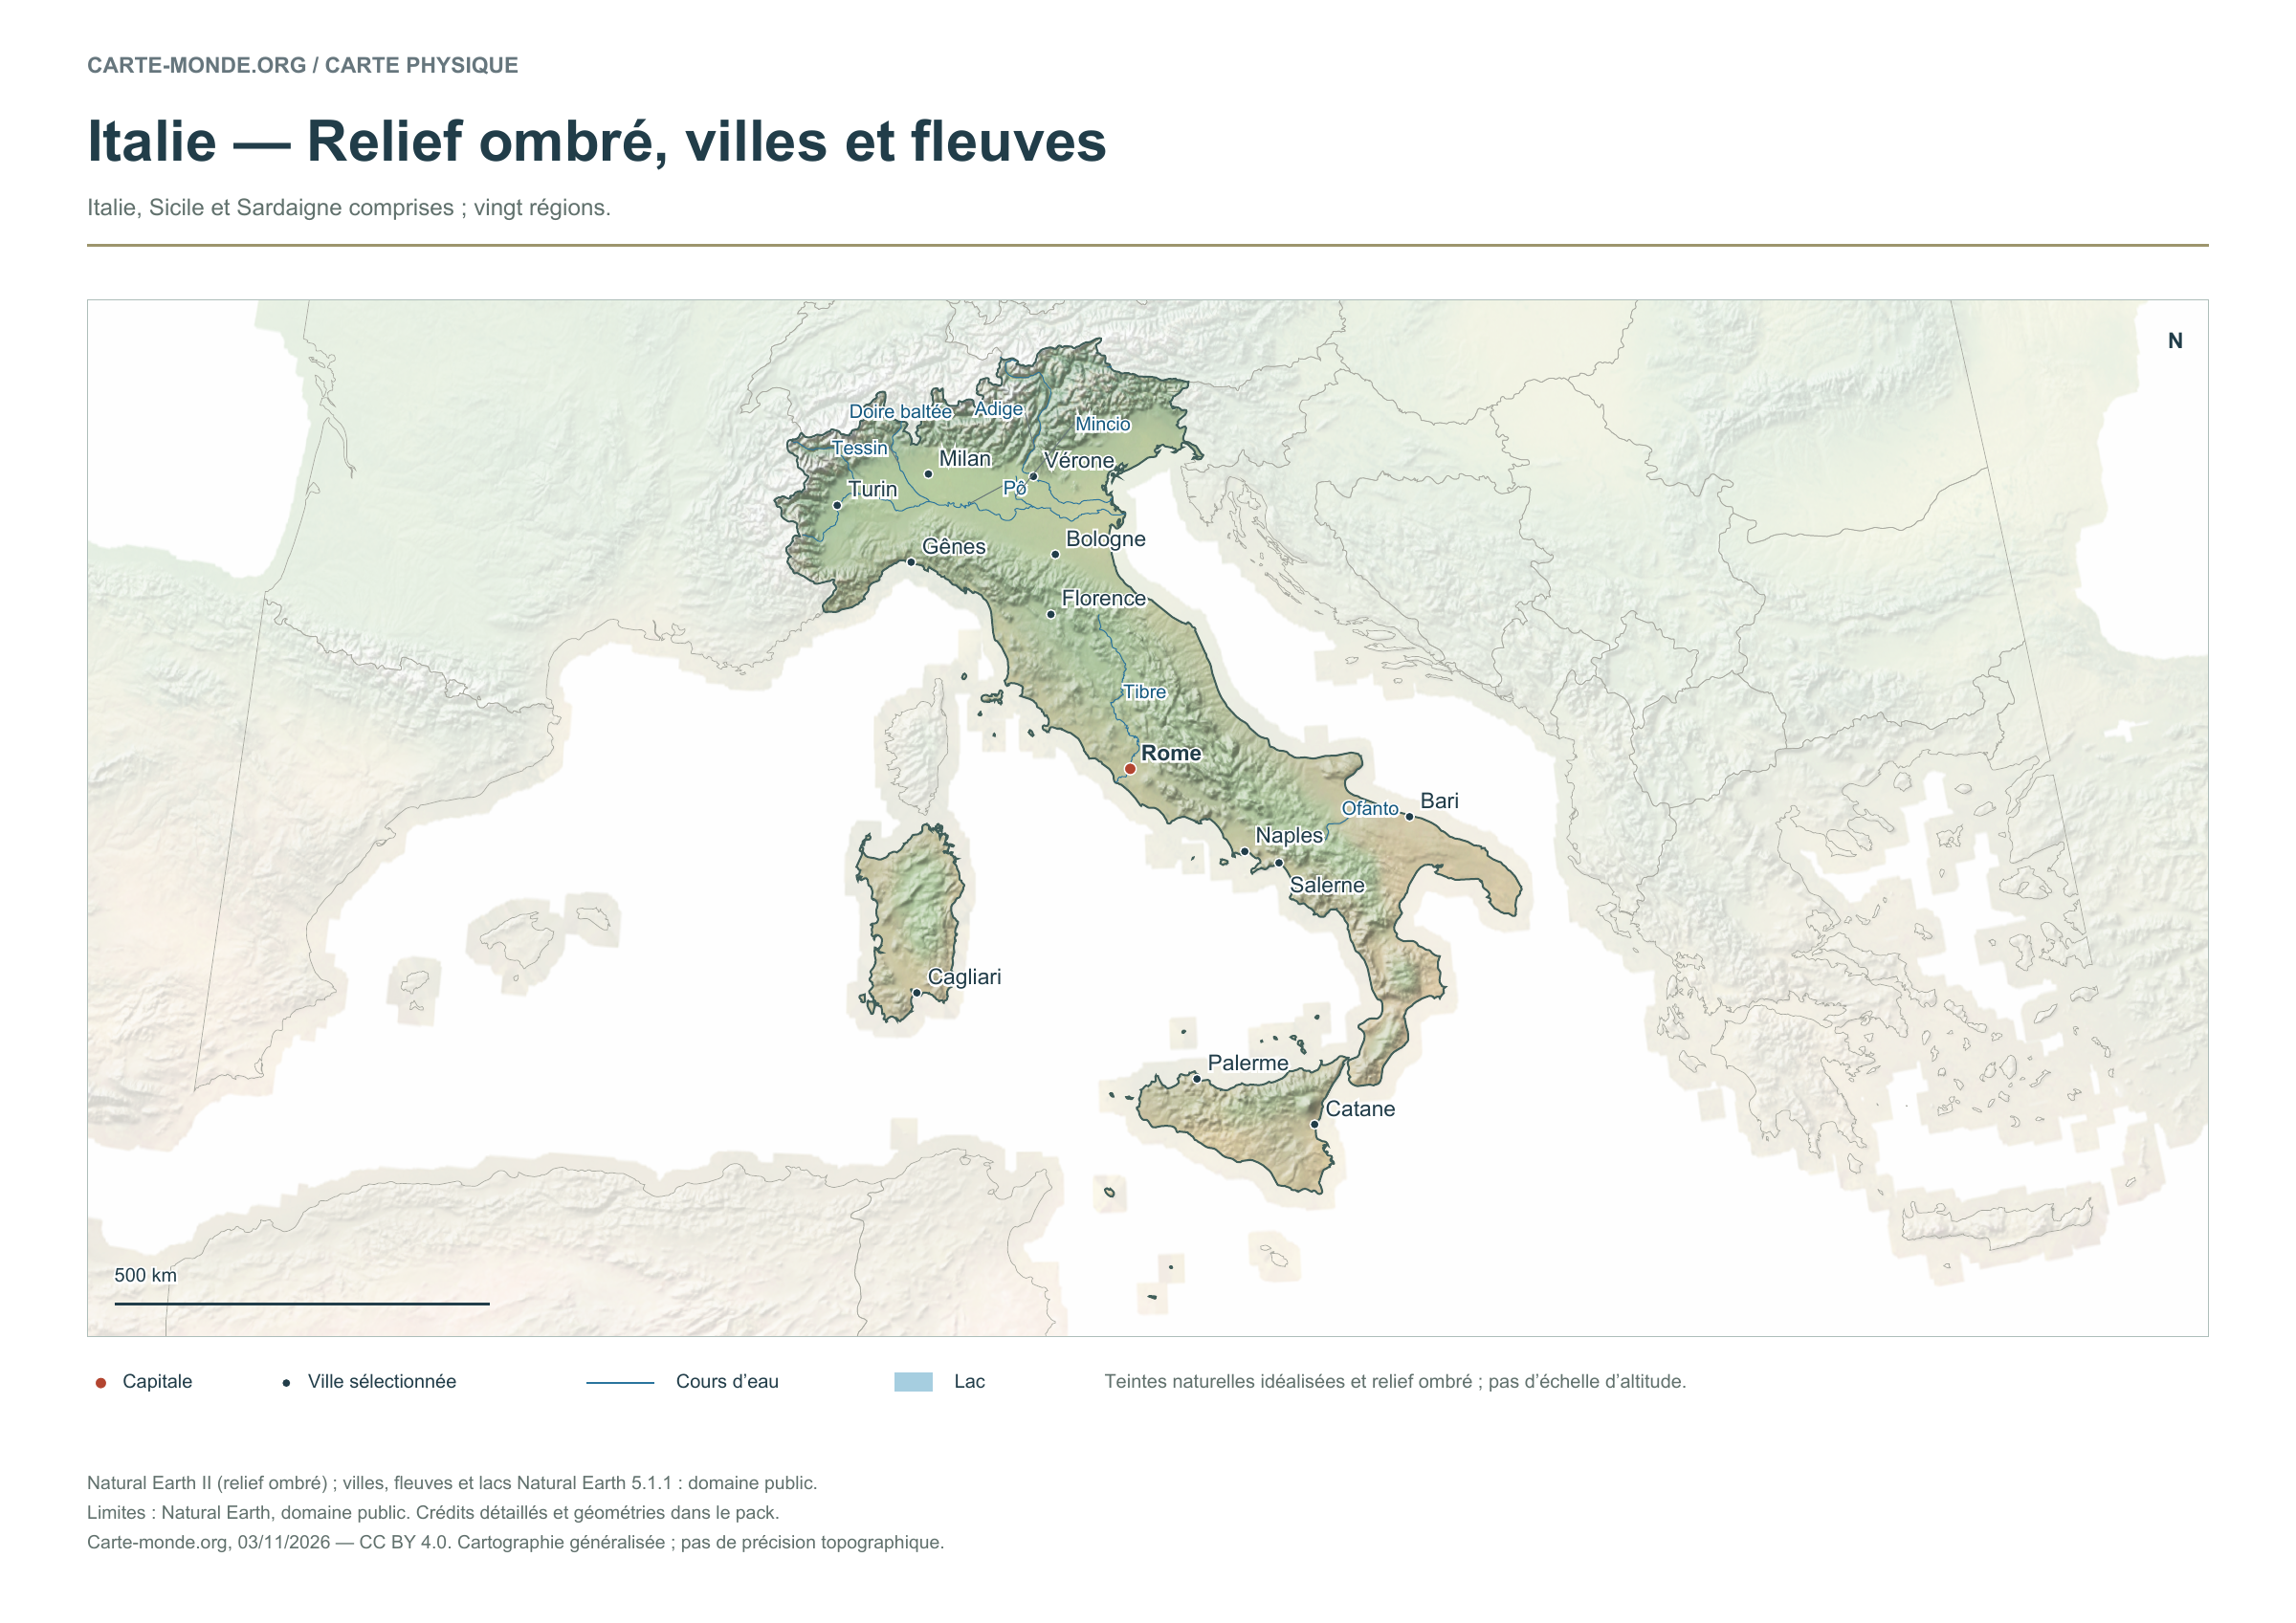
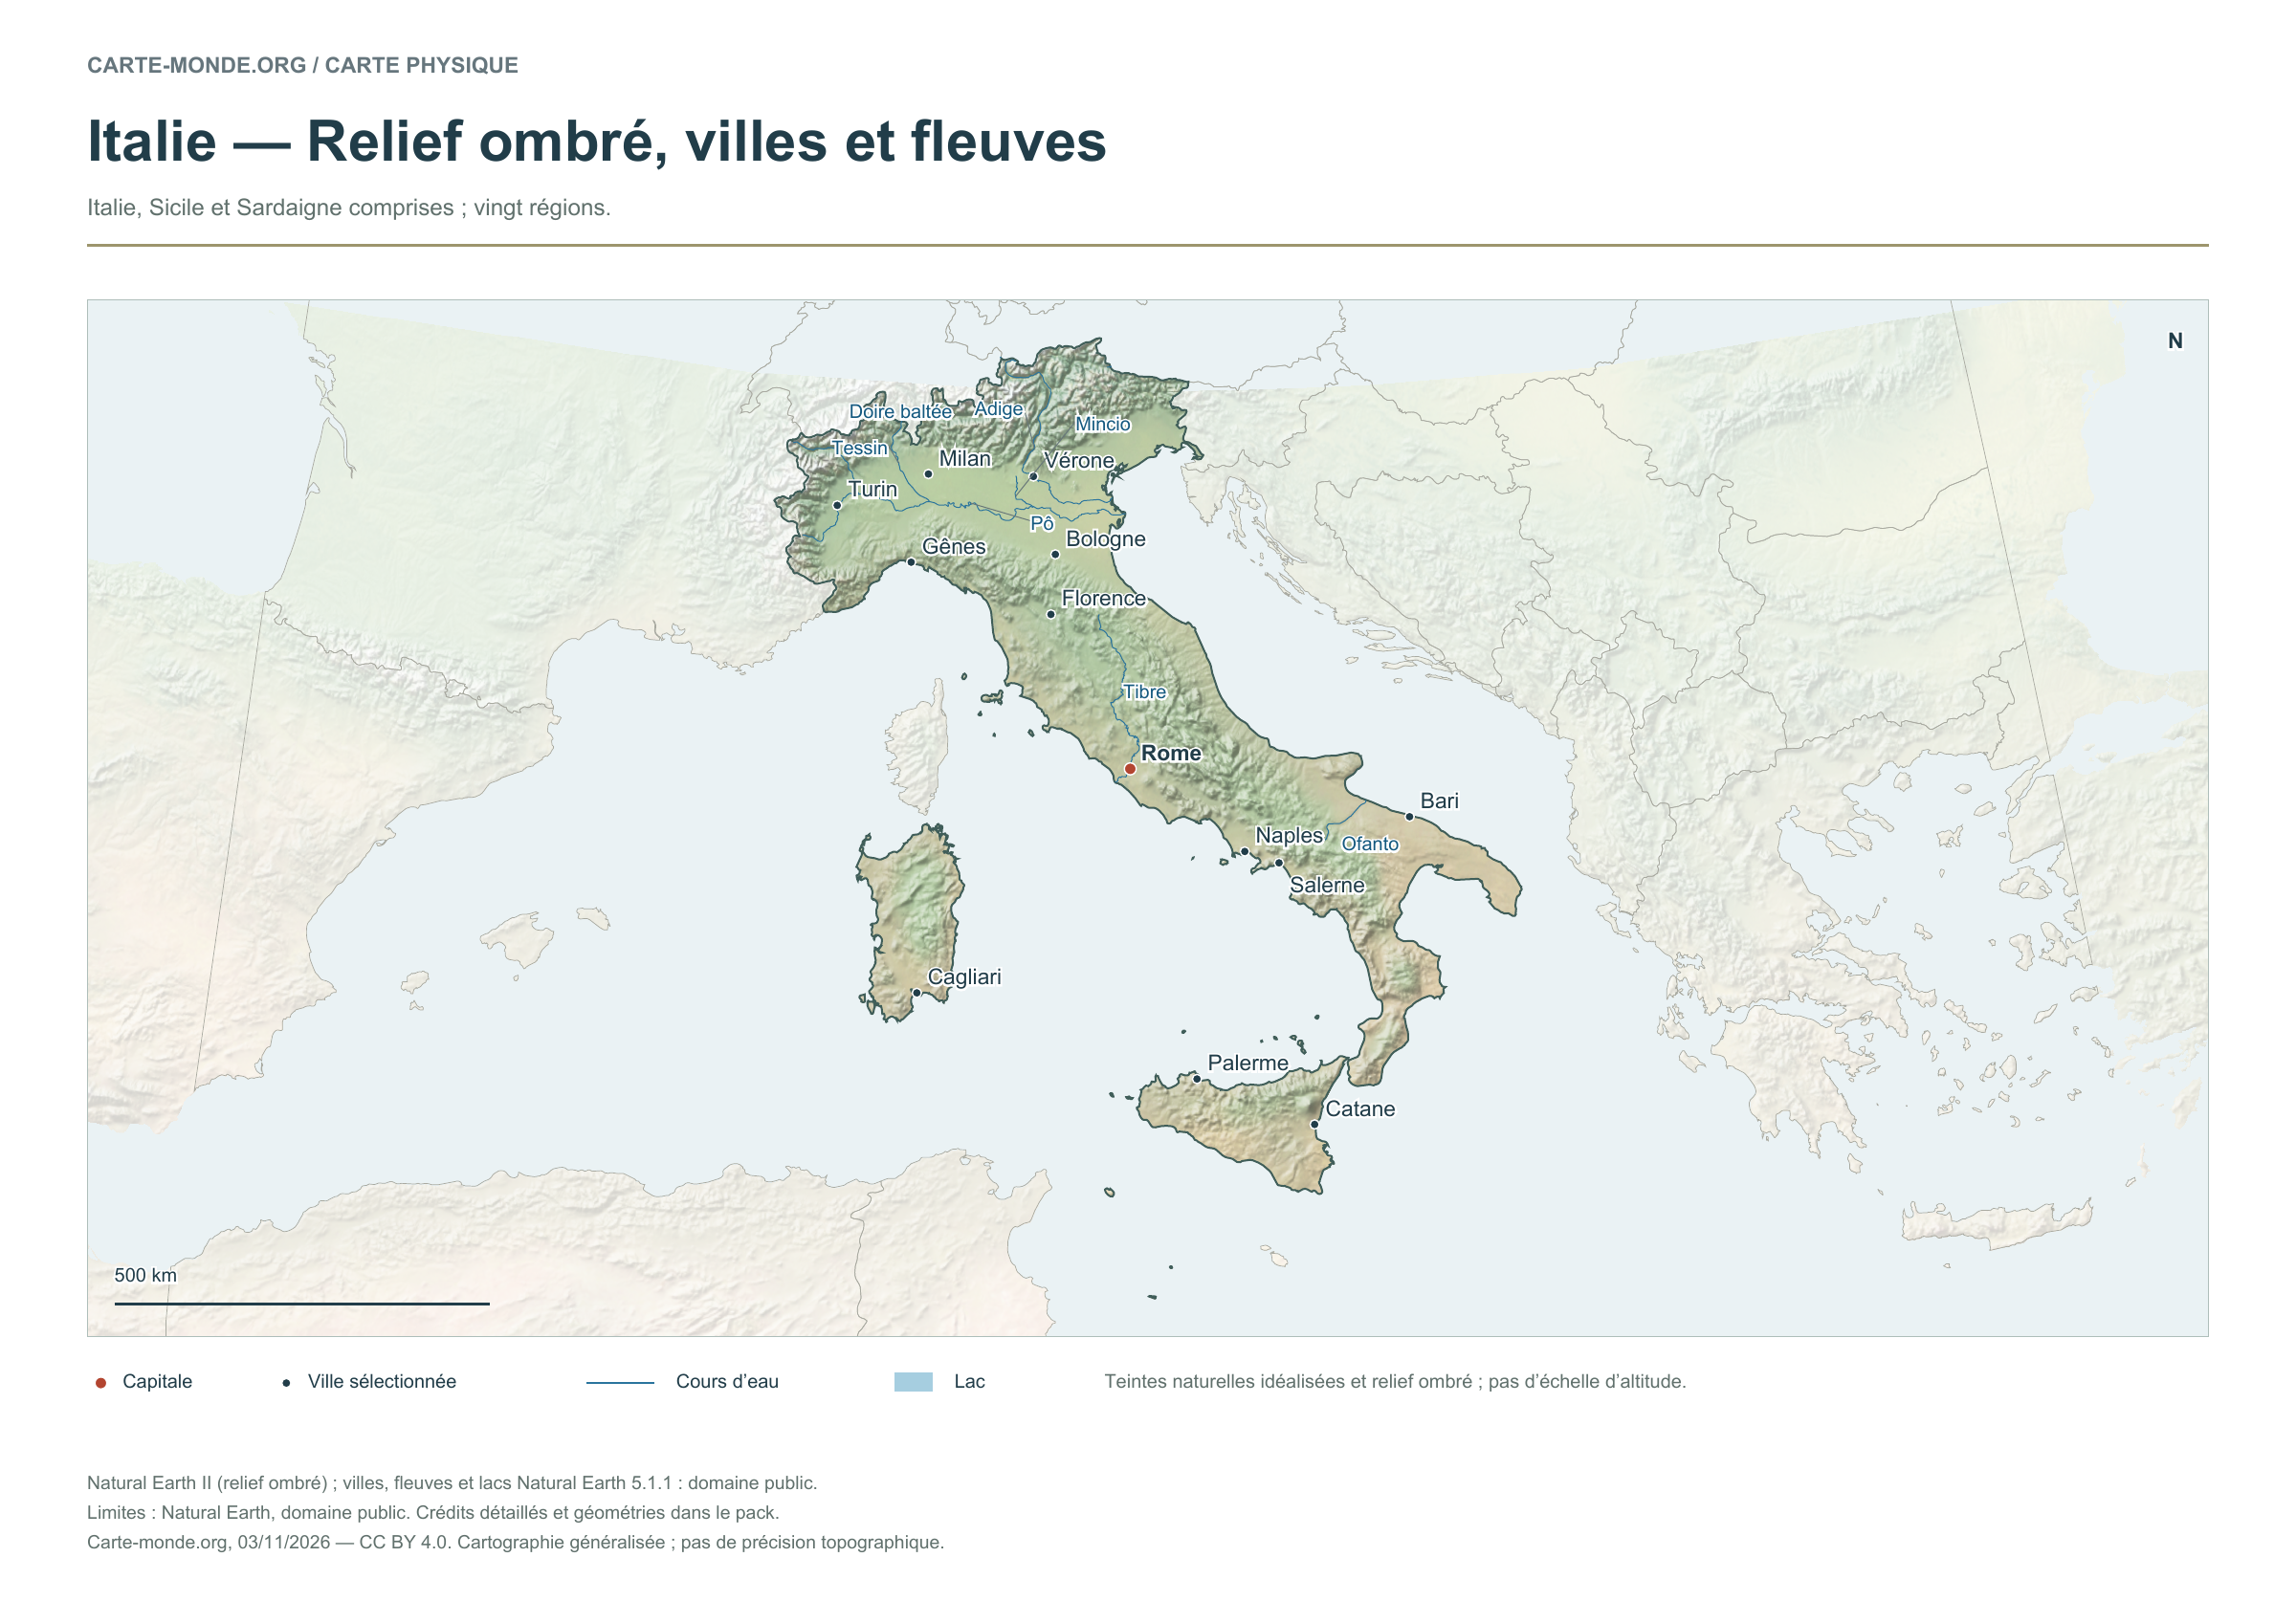
Italy — Shaded relief, cities and rivers

Carte-monde.org · November 2026

Shaded relief, cities and rivers

To identify major landforms, cities and the river network. The natural colours are not an elevation scale.

Raster base map, cities, rivers and lakes: Natural Earth, public domain. Other boundary credits and licences are retained in the pack. Cartographic work CC BY 4.0; ODbL-derived data retains its licence. No topographic accuracy is claimed.

Territory, data and selection of names

Italy, including Sicily and Sardinia; twenty regions.

Natural Earth II shaded relief background, 13 selected cities. Named rivers: Adige, Doire baltée, Mincio, Ofanto, Pô, Tessin, Tibre.

The colours represent idealised natural cover; they do not correspond to elevation classes. This global background remains generalised, particularly for small states.

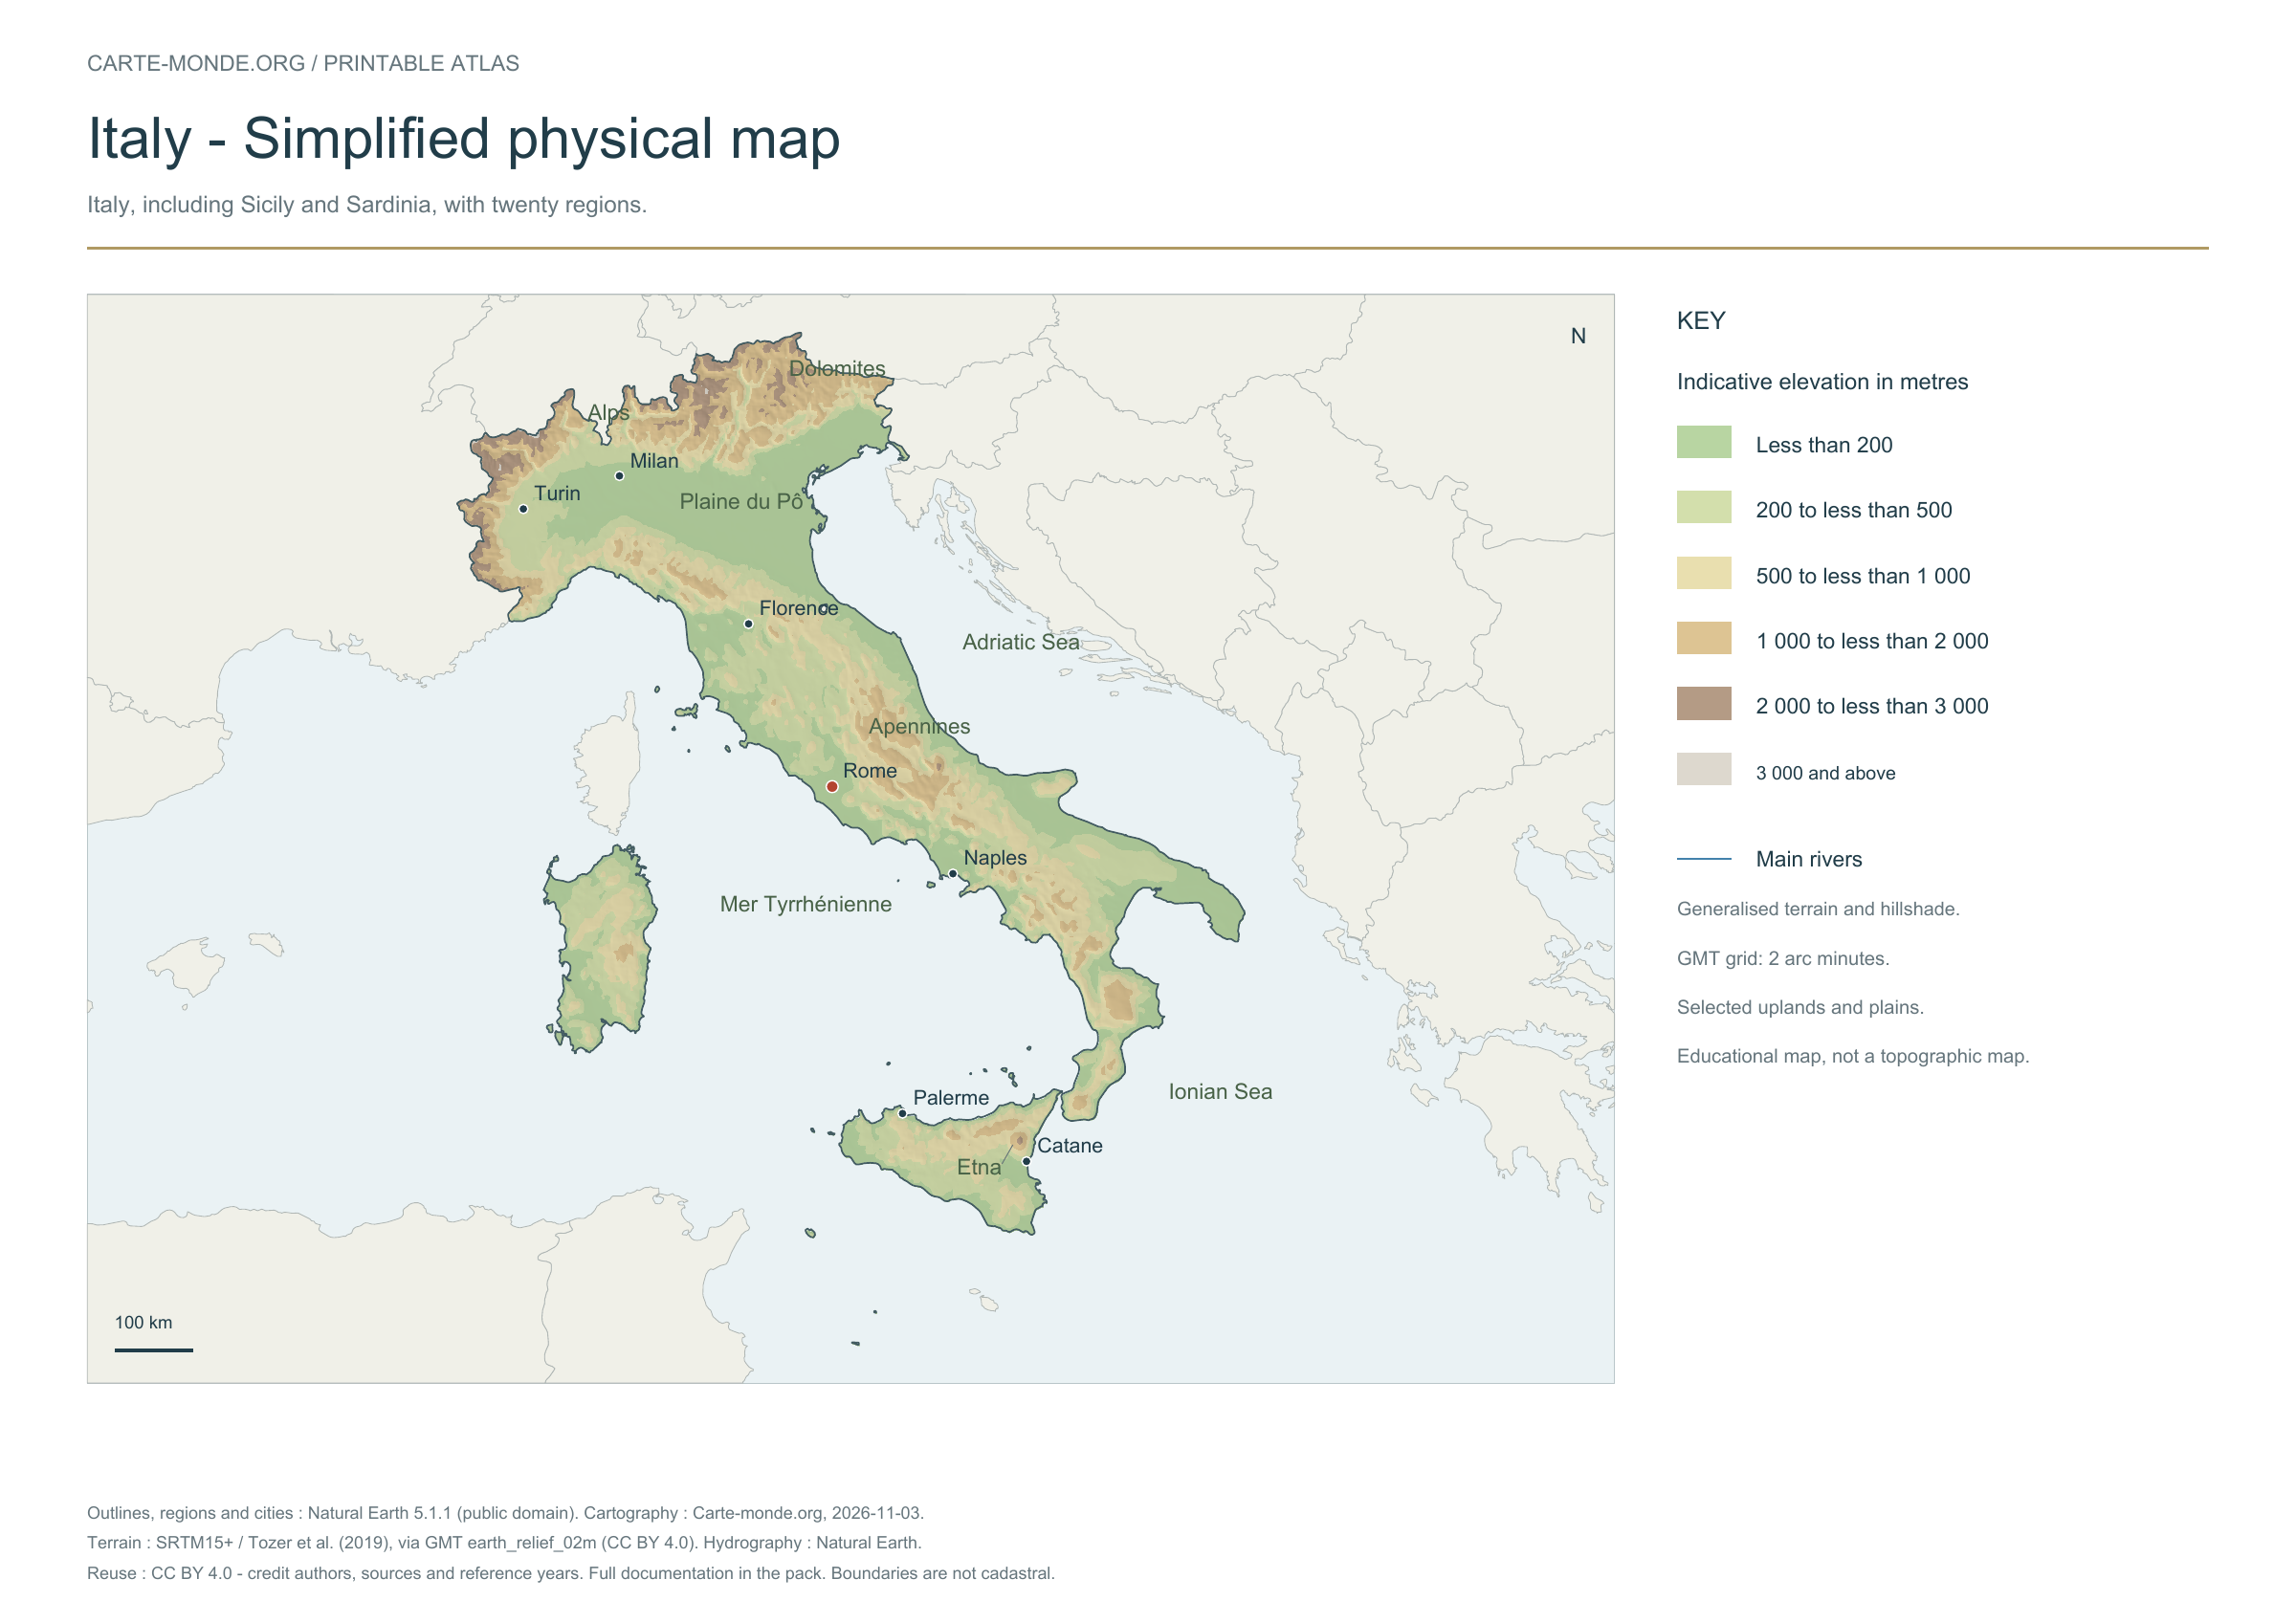
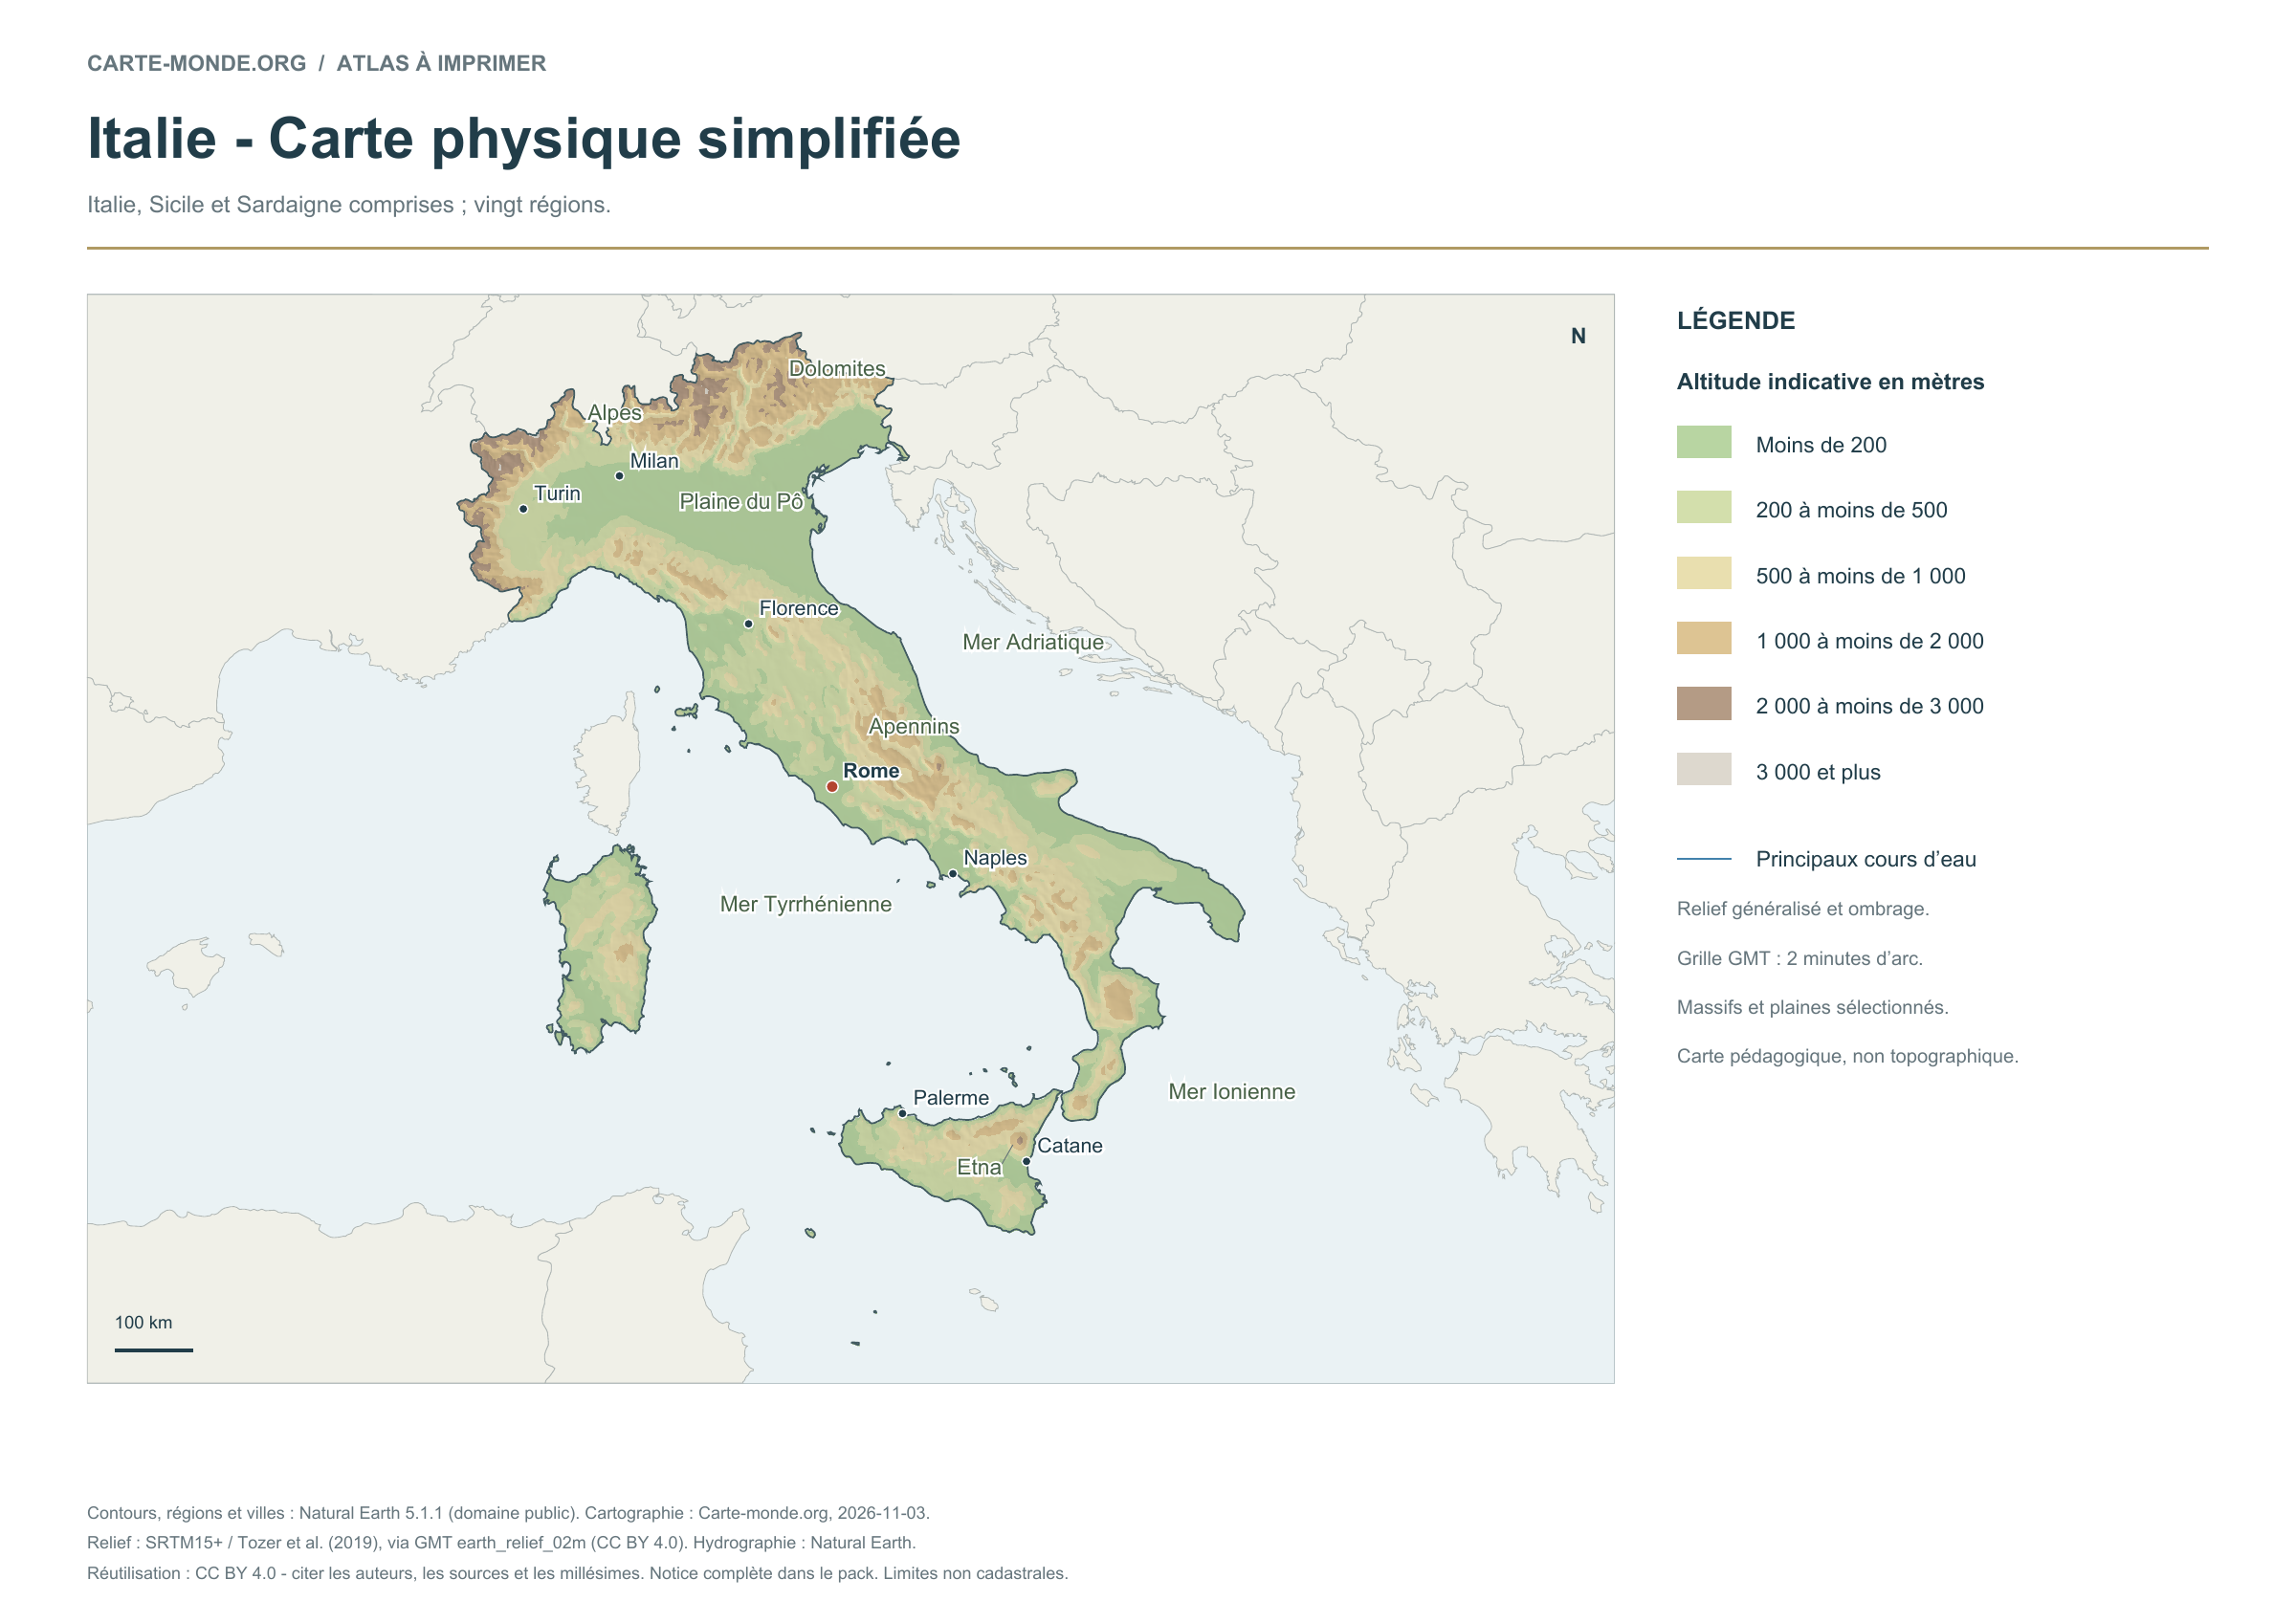
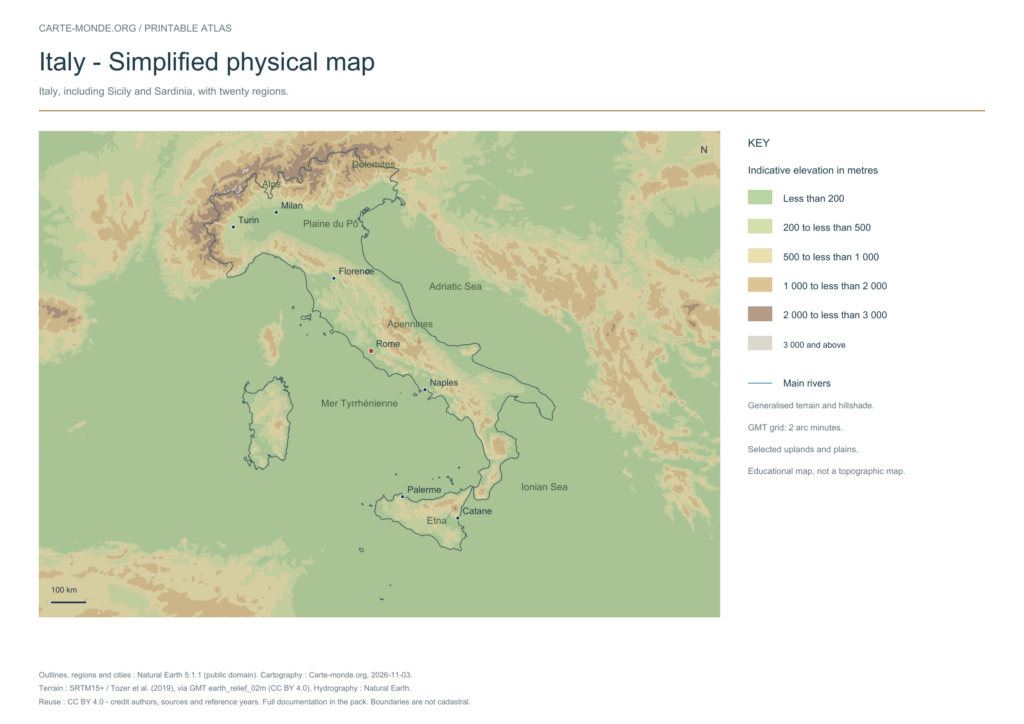
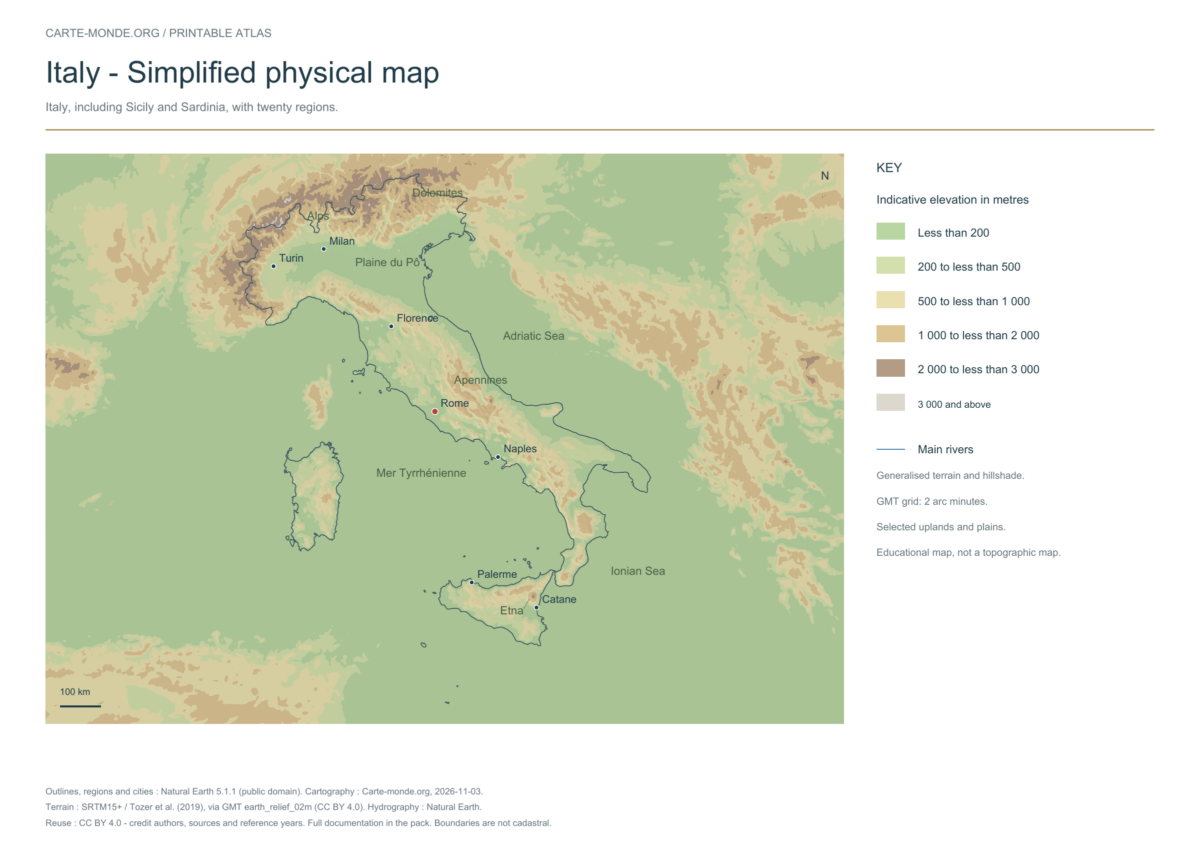
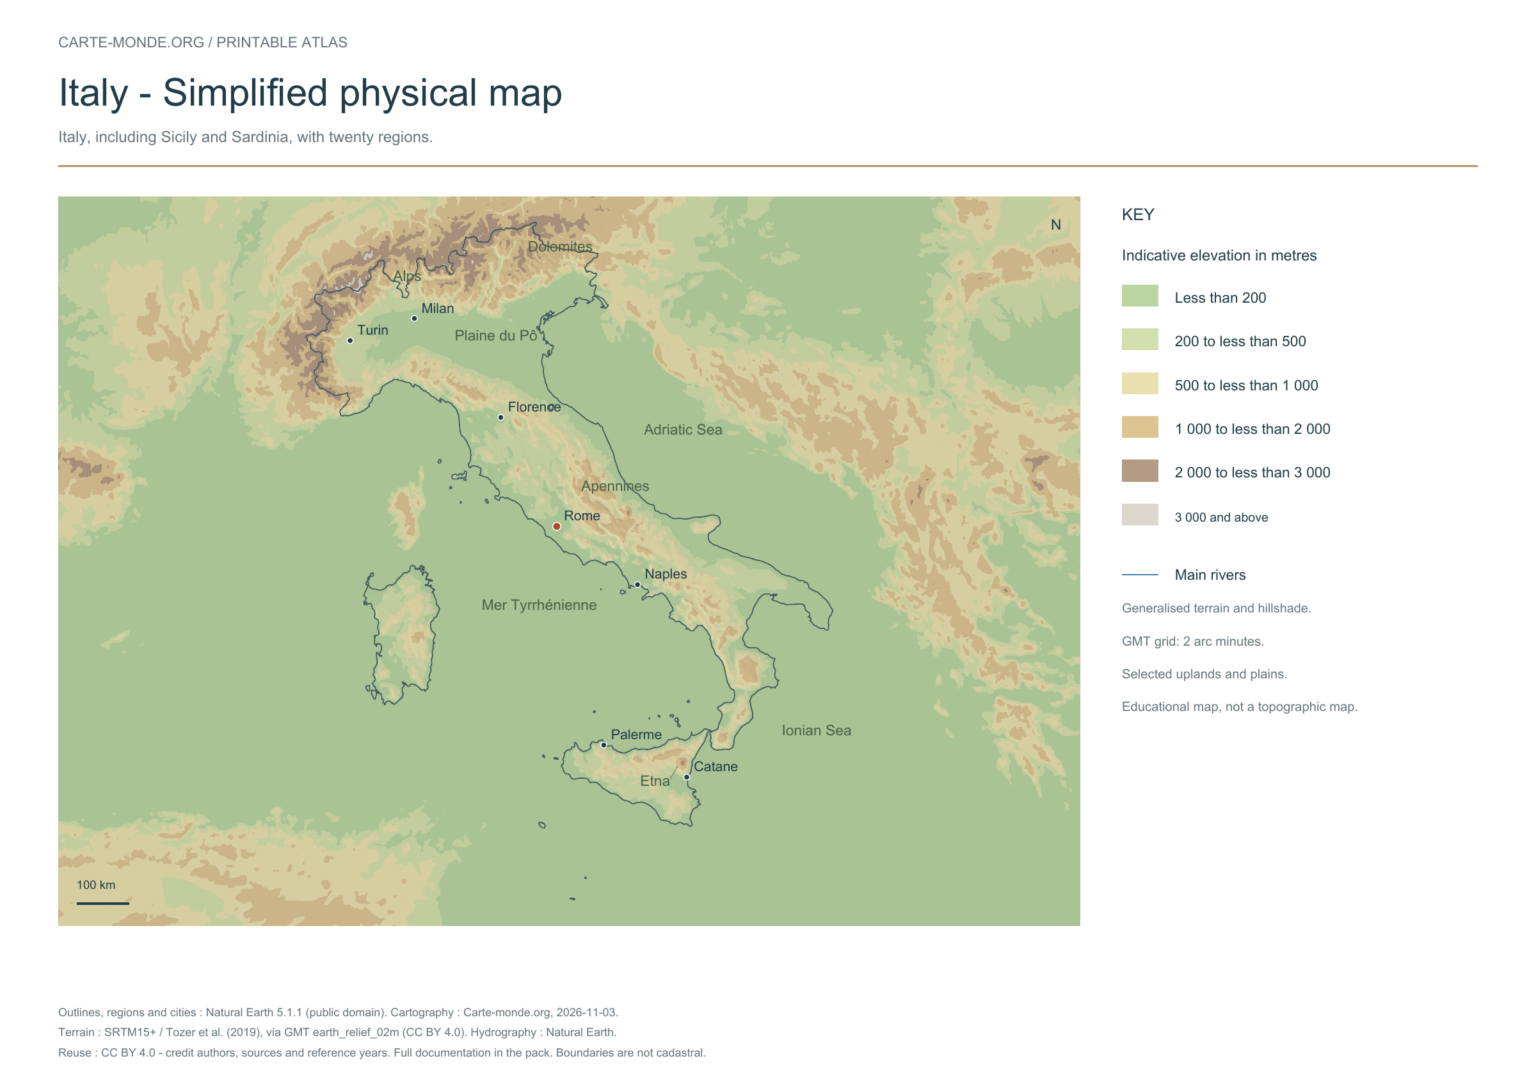
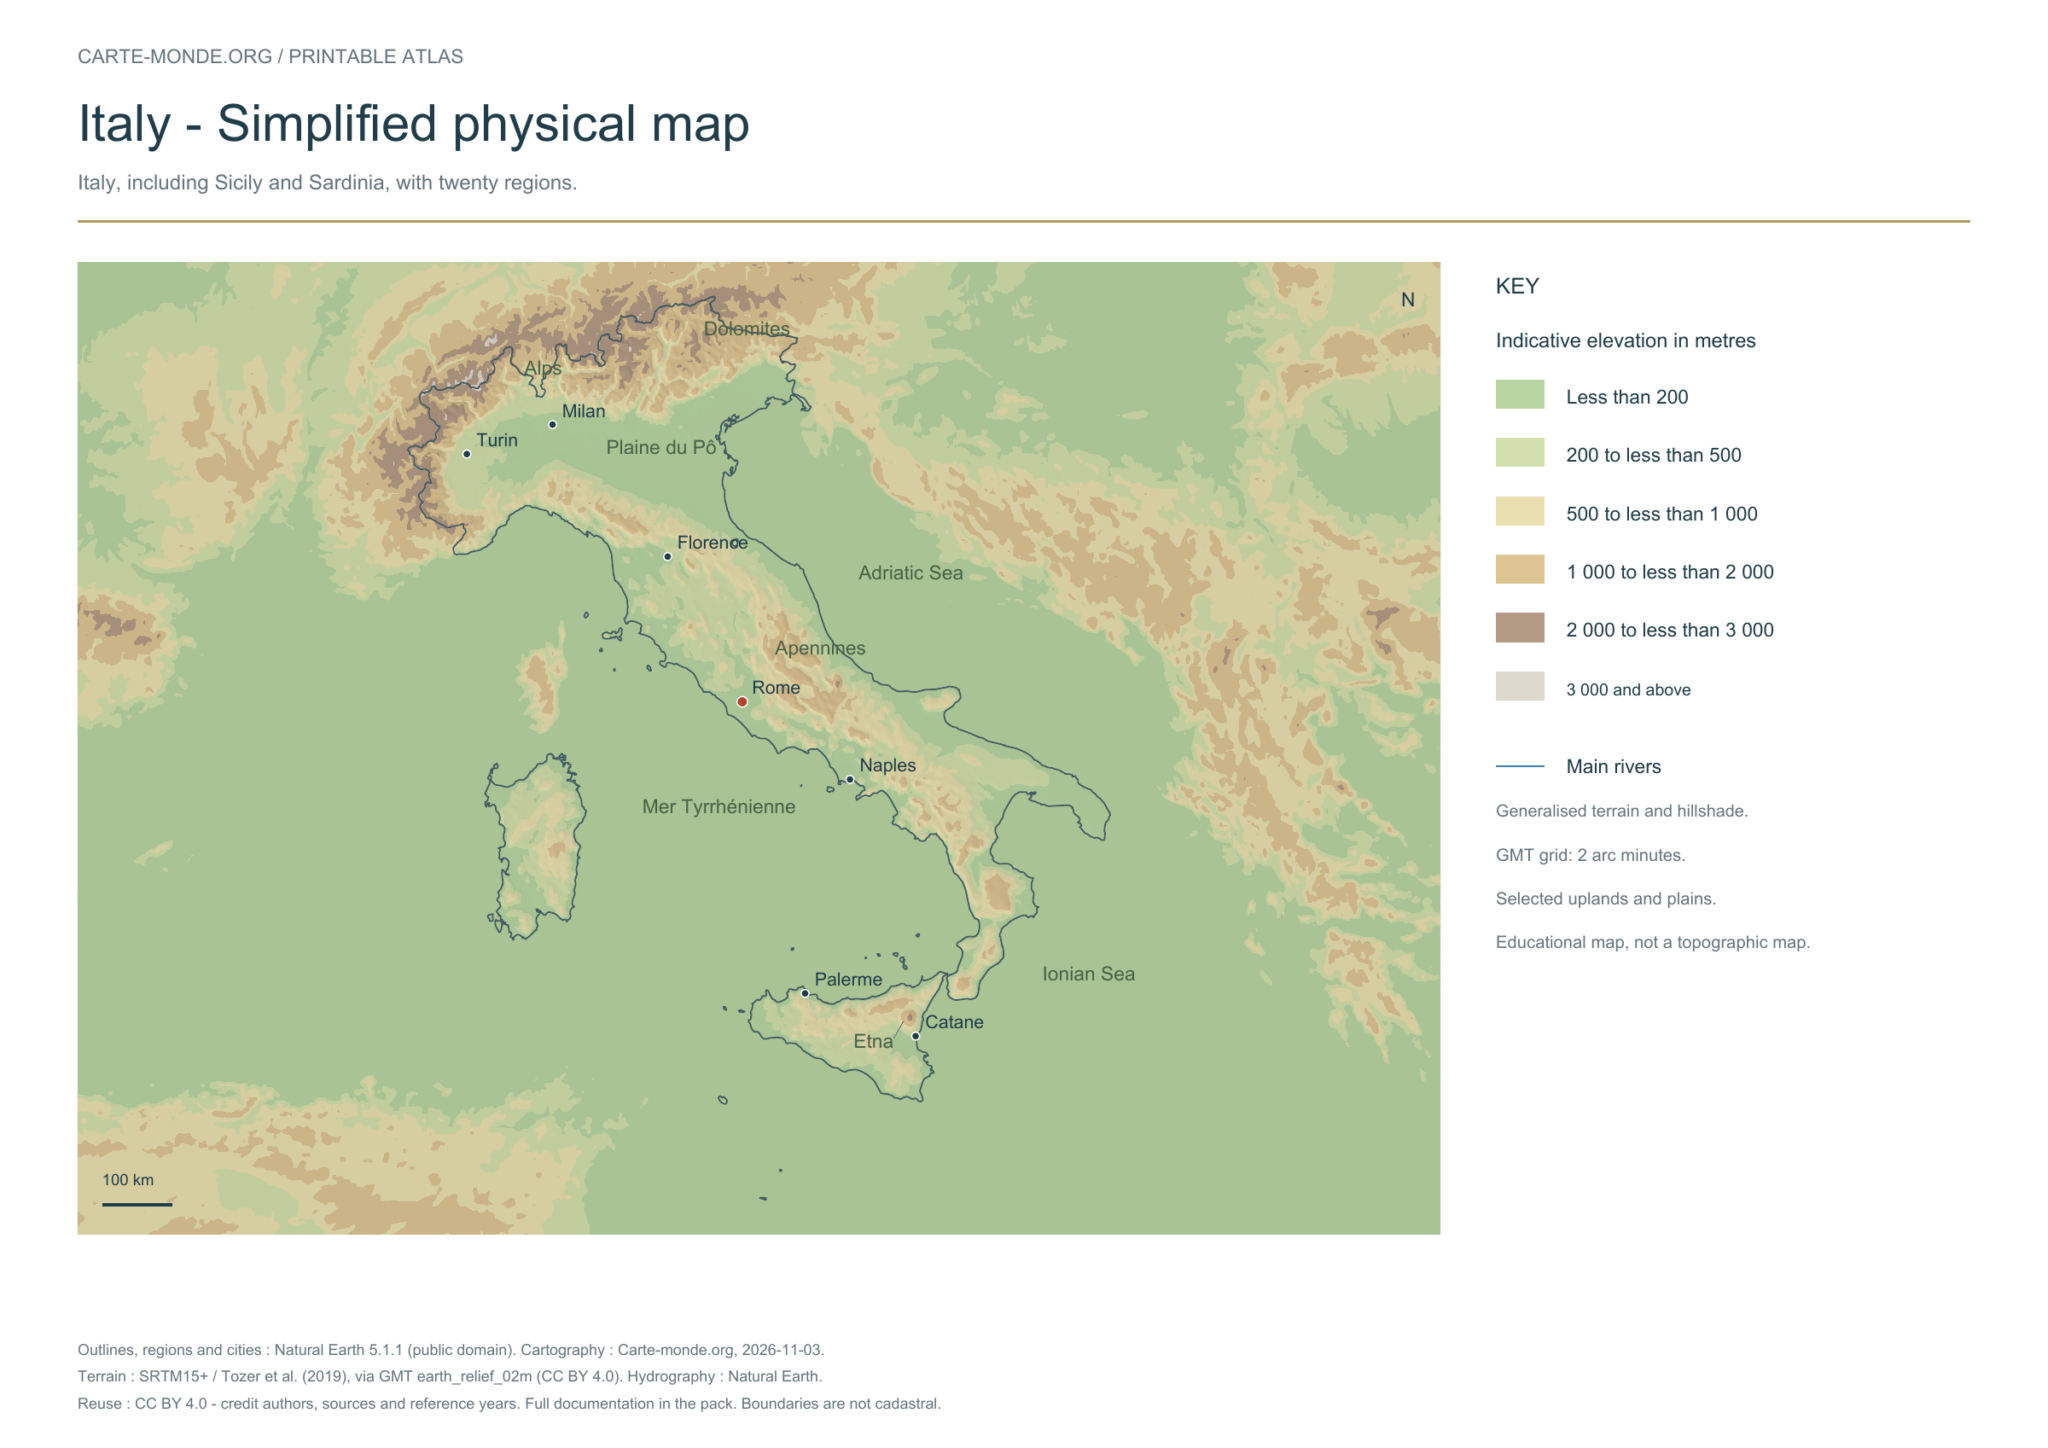
Simplified physical map — Italy

Carte-monde.org · November 2026

Simplified elevations

Smoothed relief, elevation colours, main mountain ranges, plains and watercourses. Educational map at national scale.

A4 landscape PDF · PNG 2 400 px · CC BY 4.0

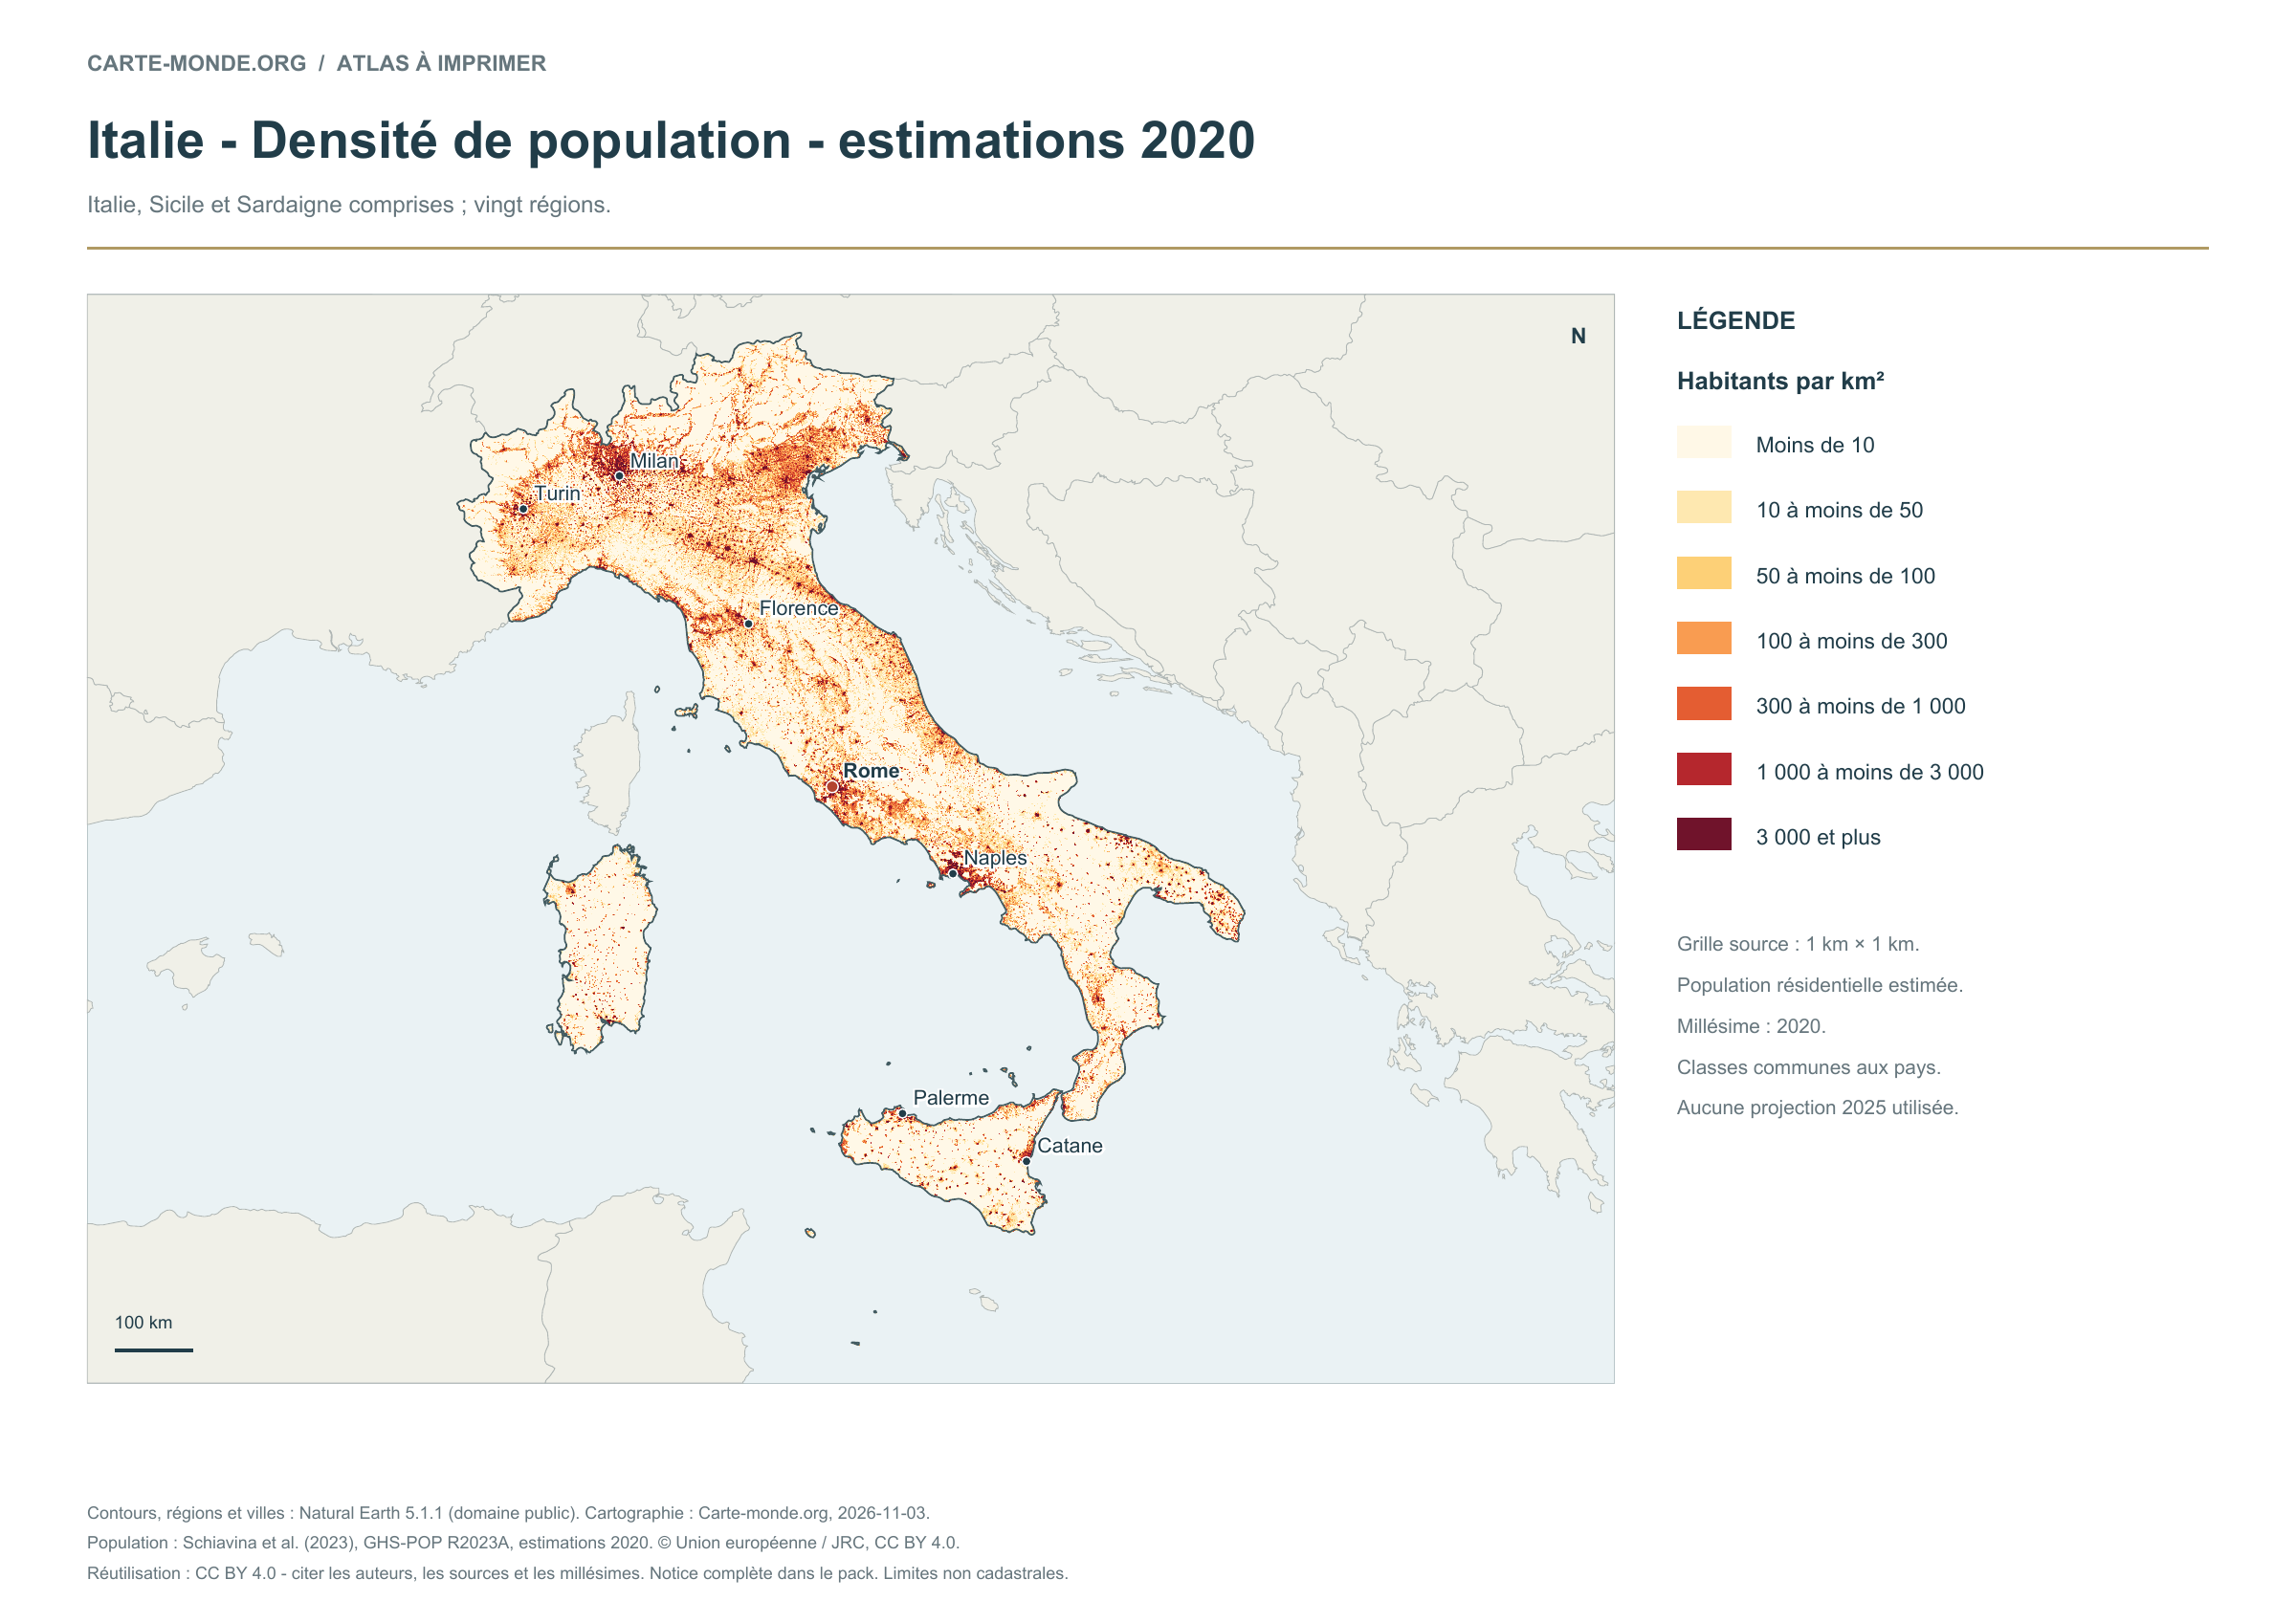
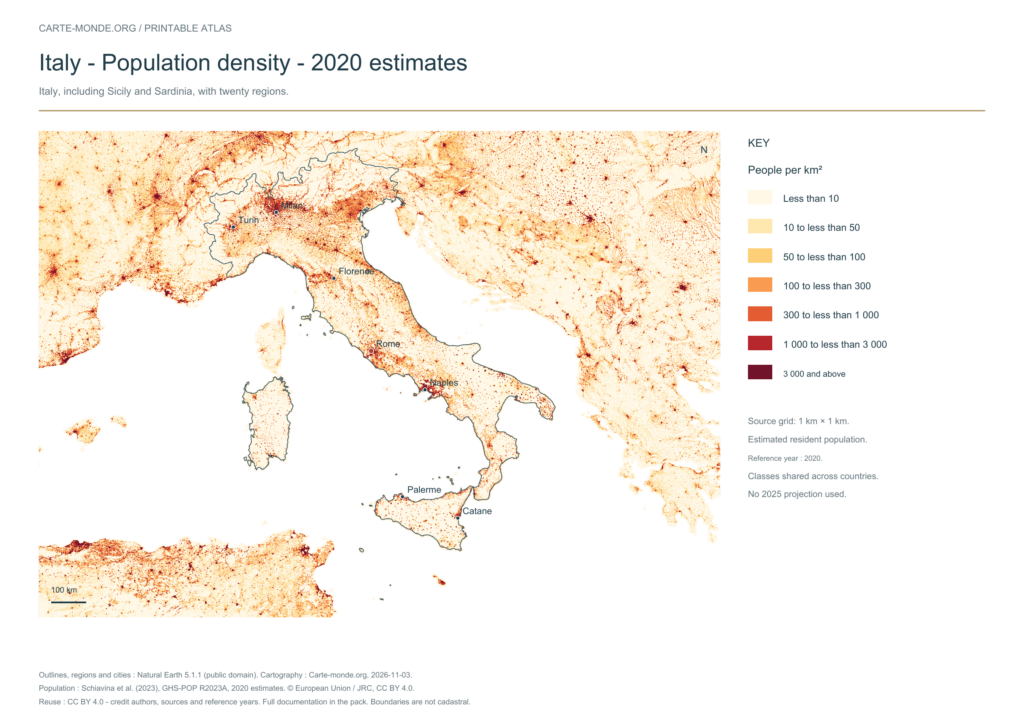
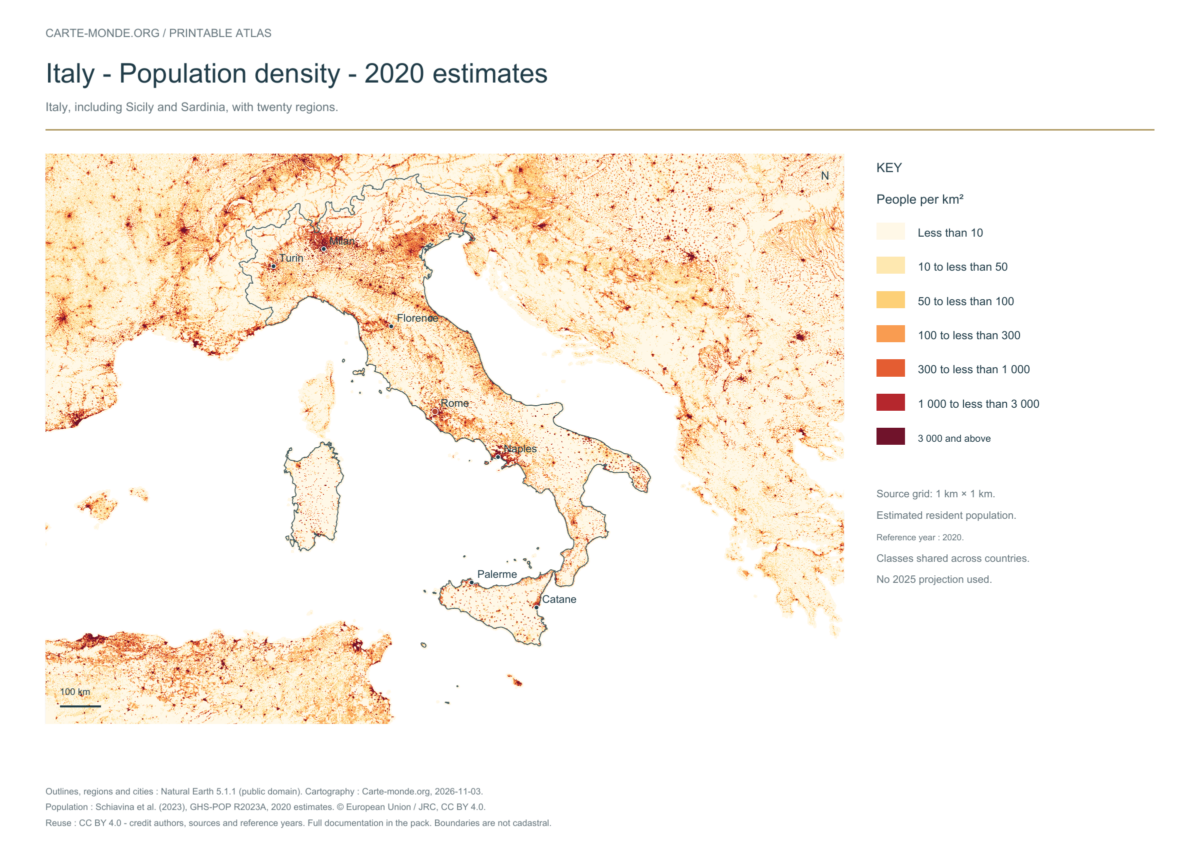
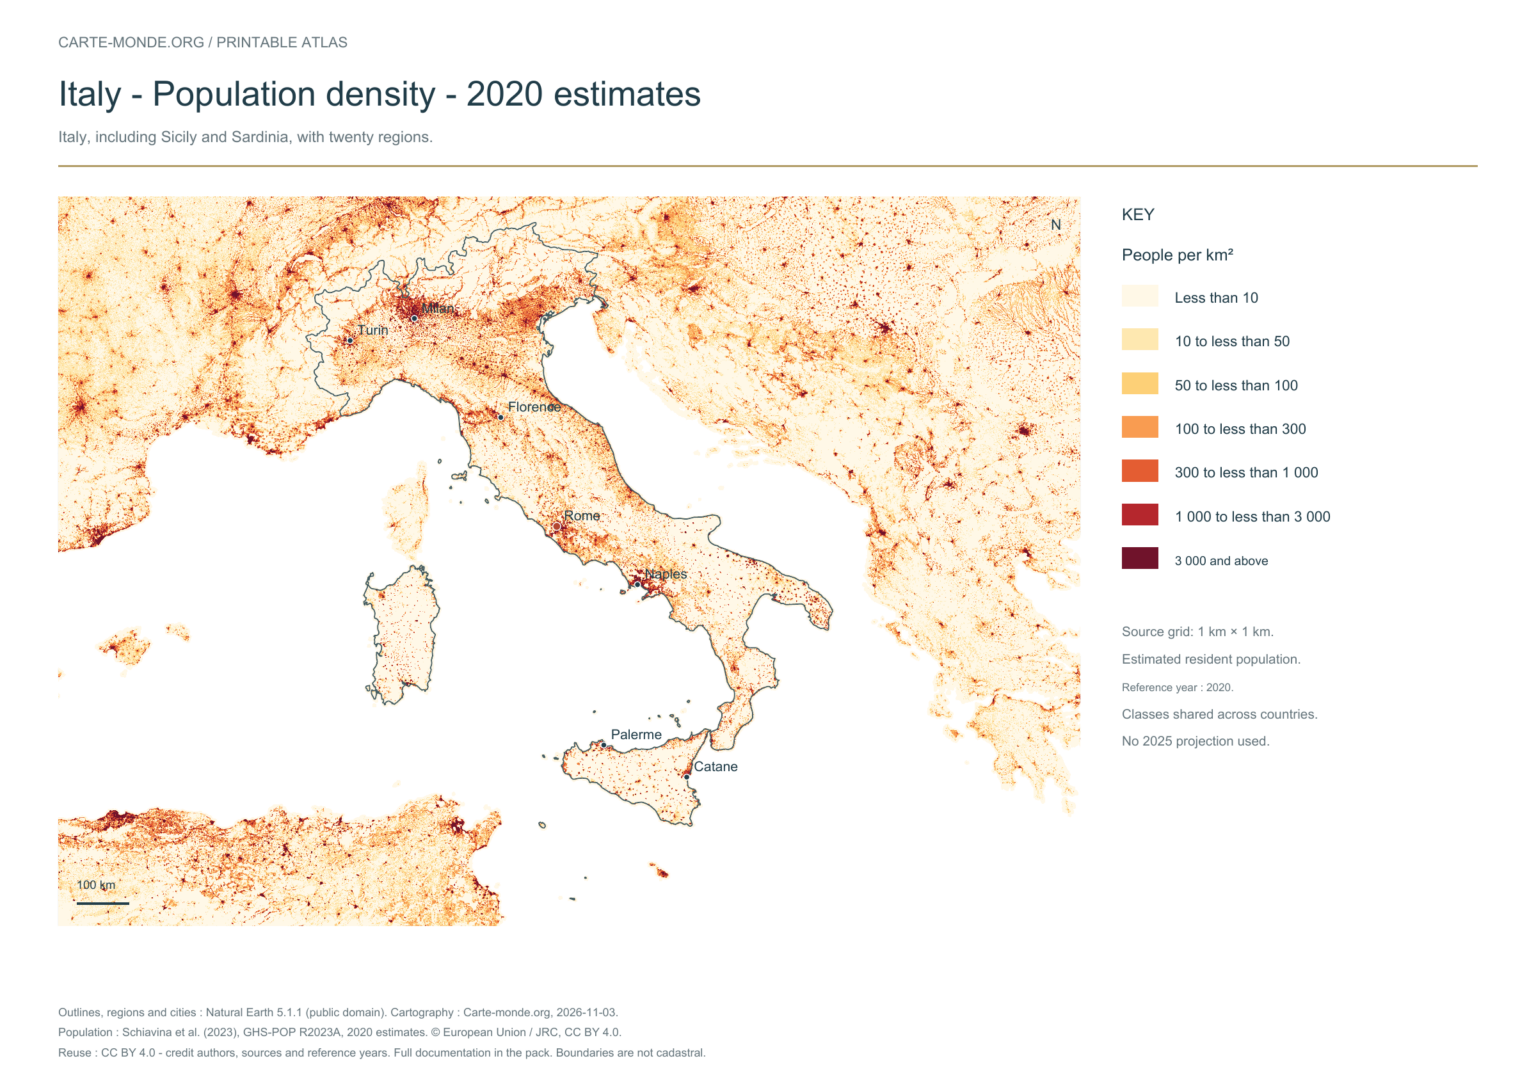
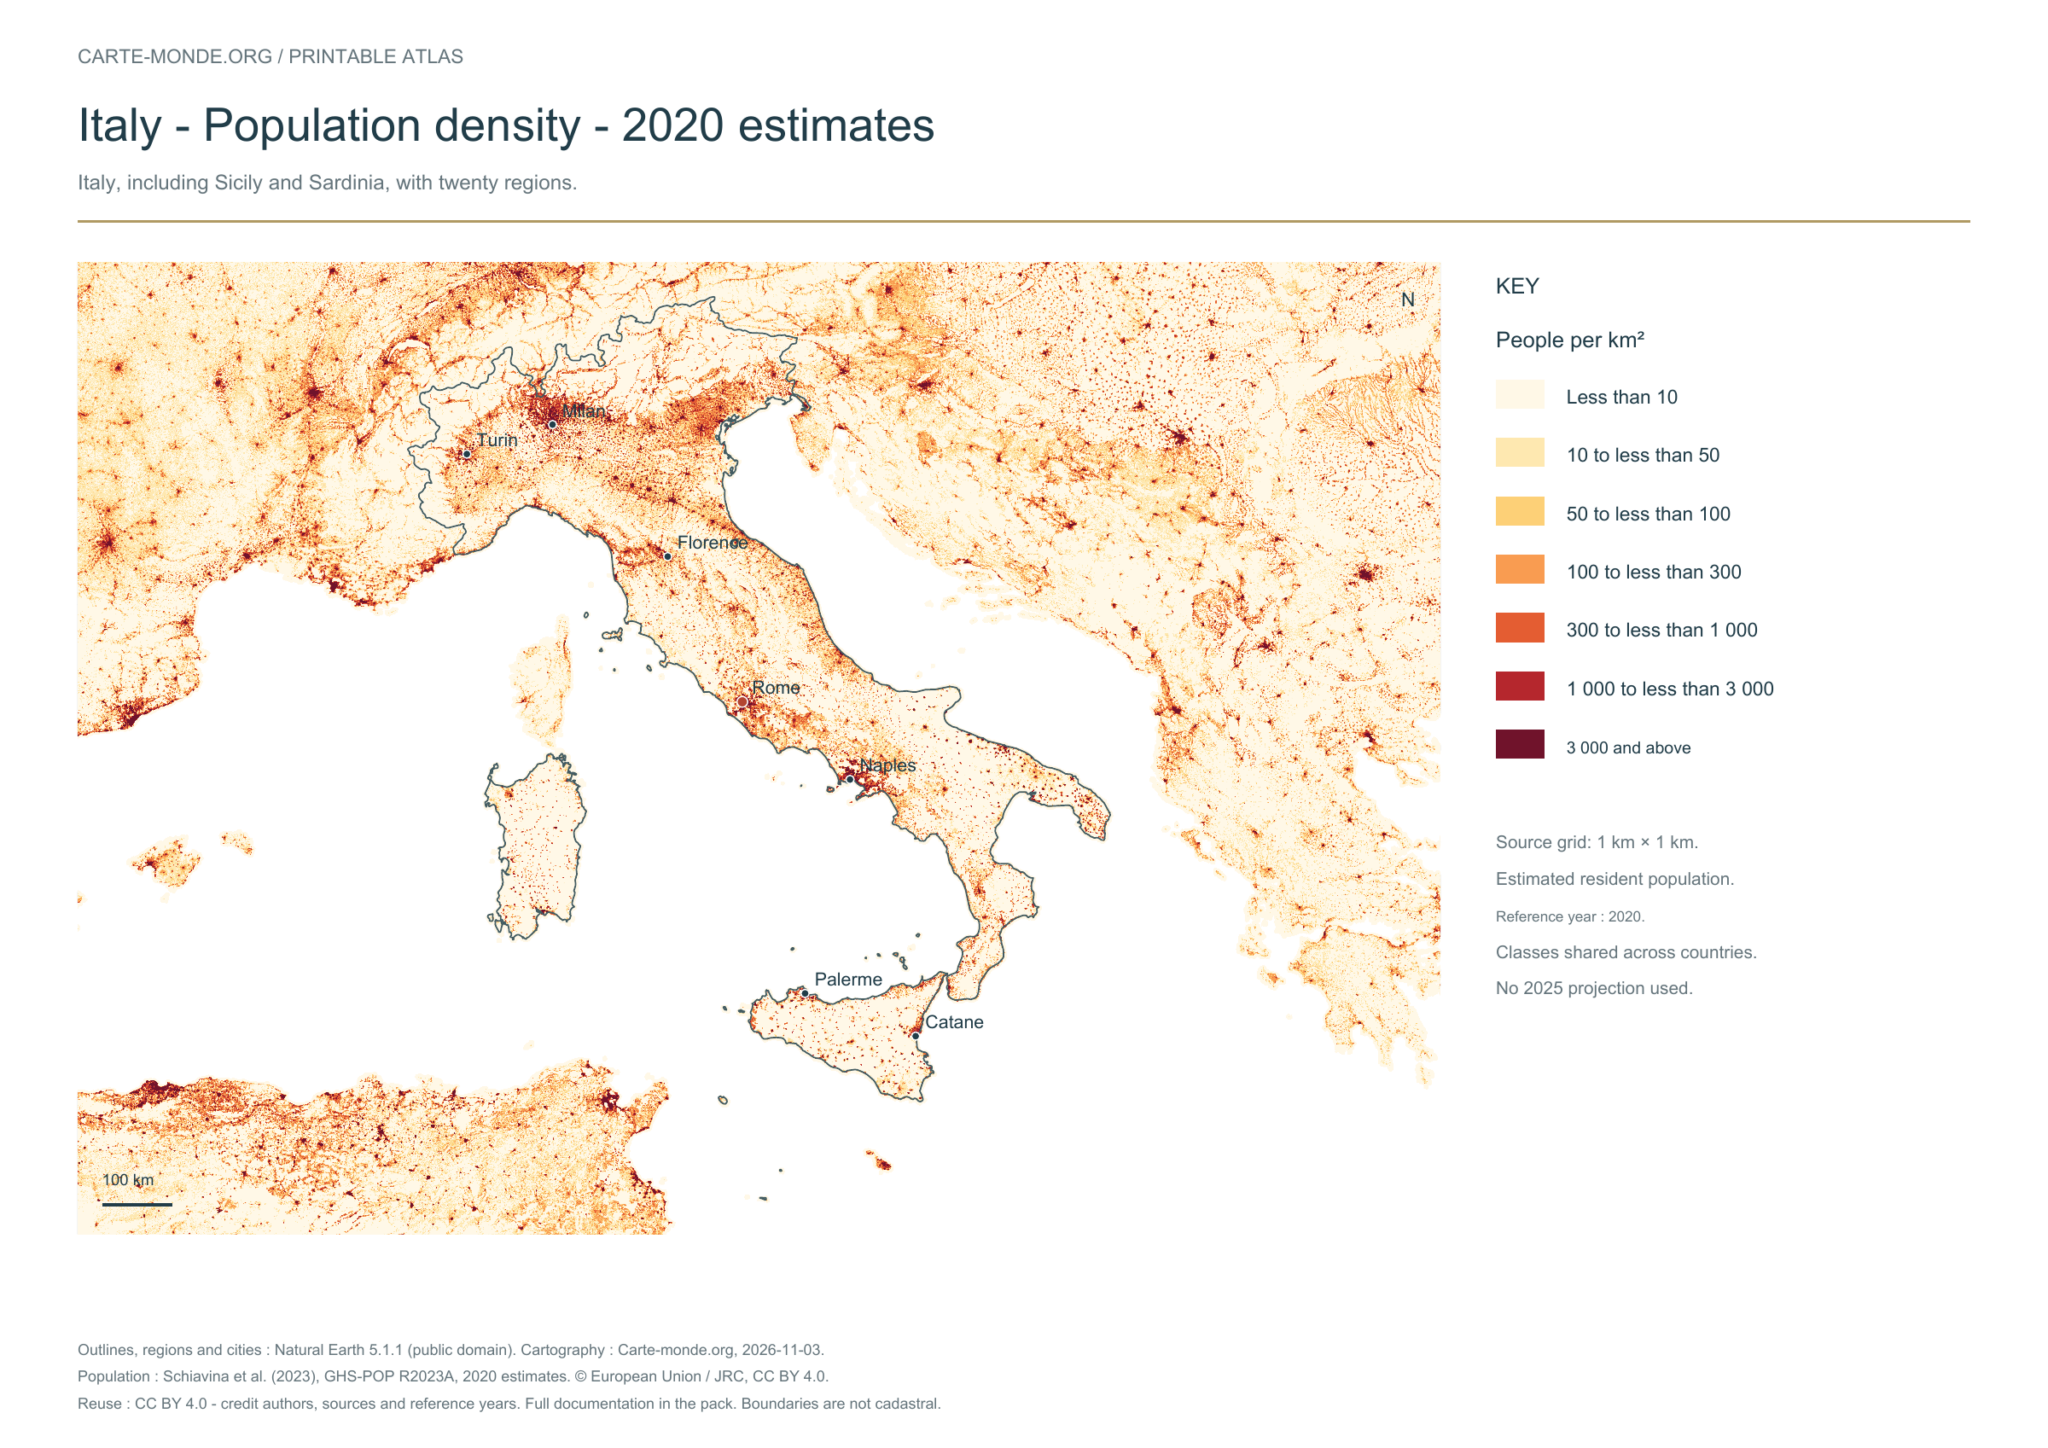
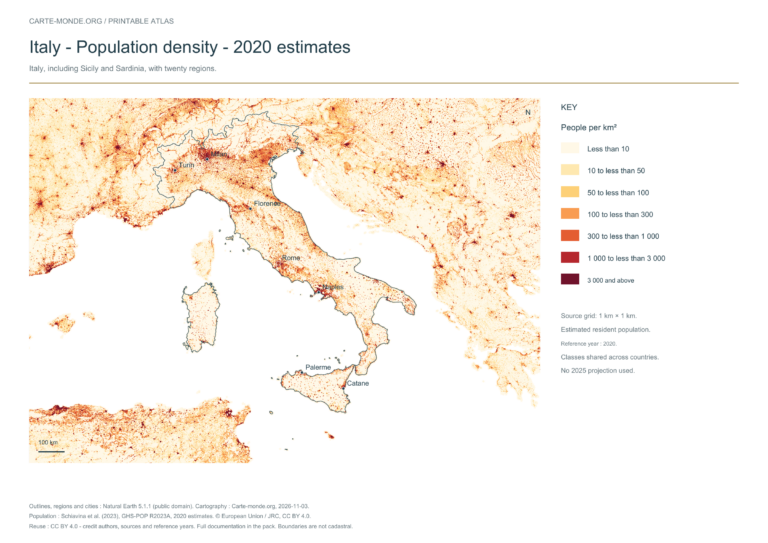
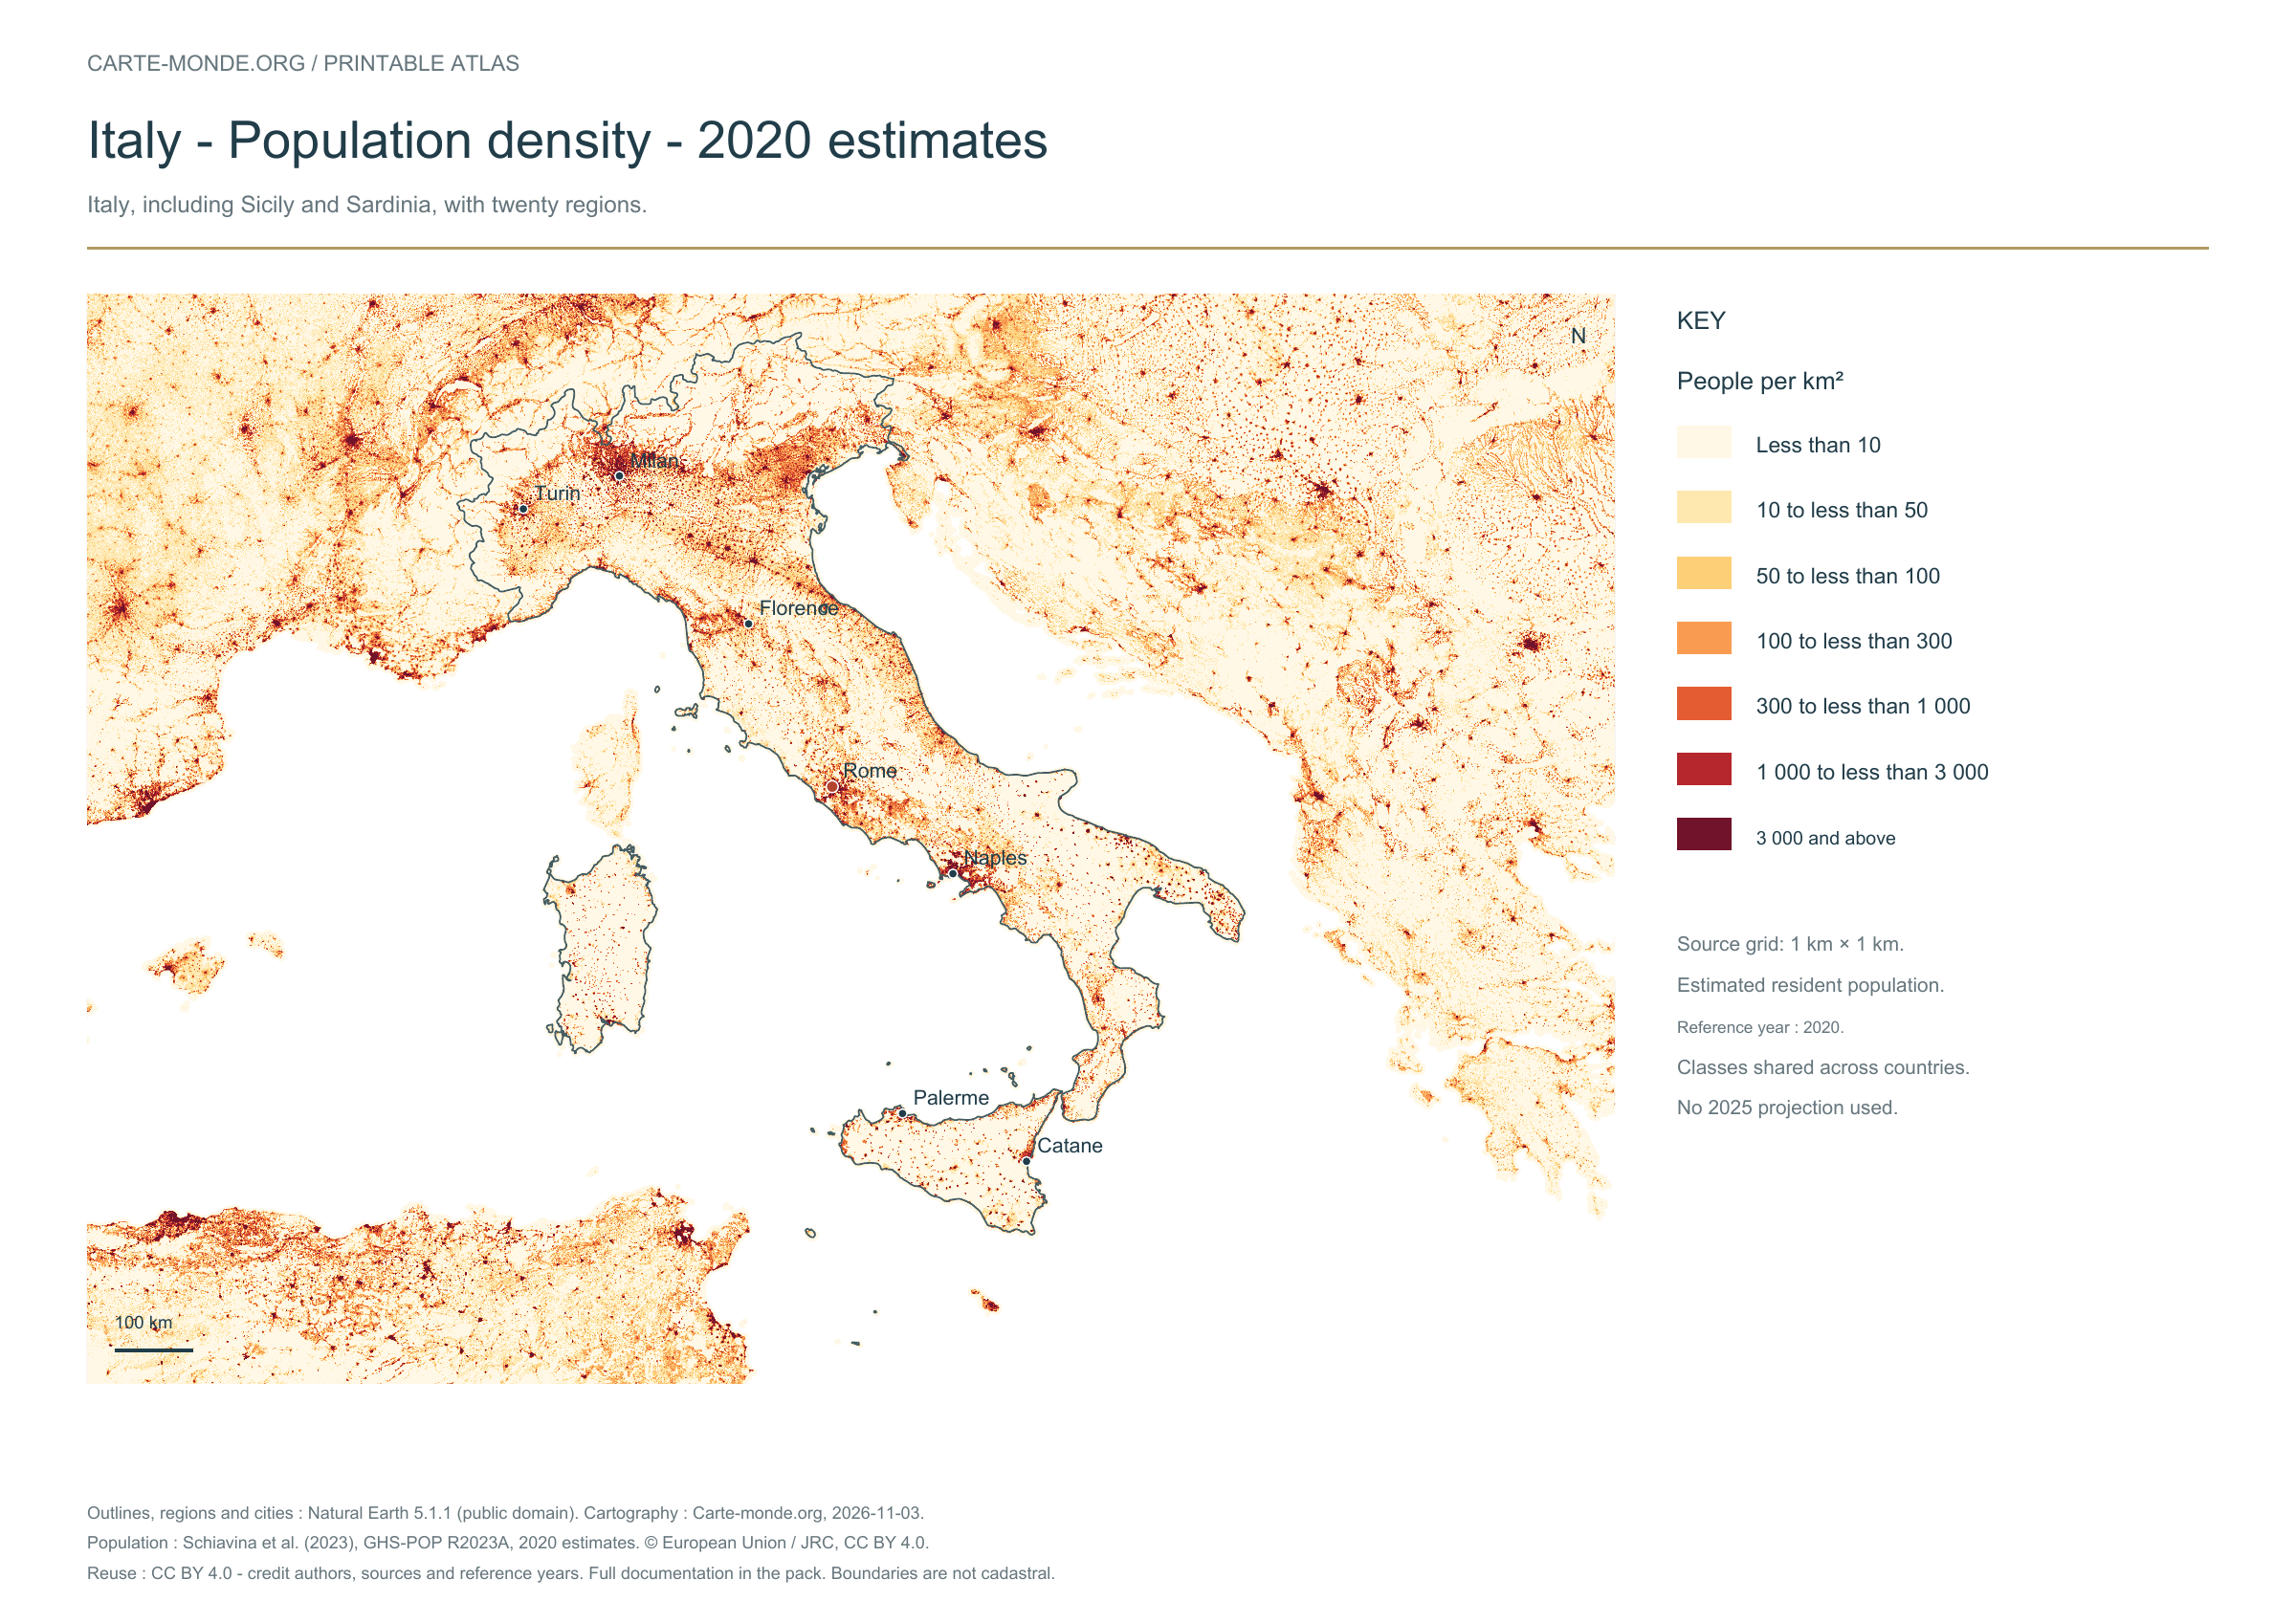
Population density: 2020 estimates

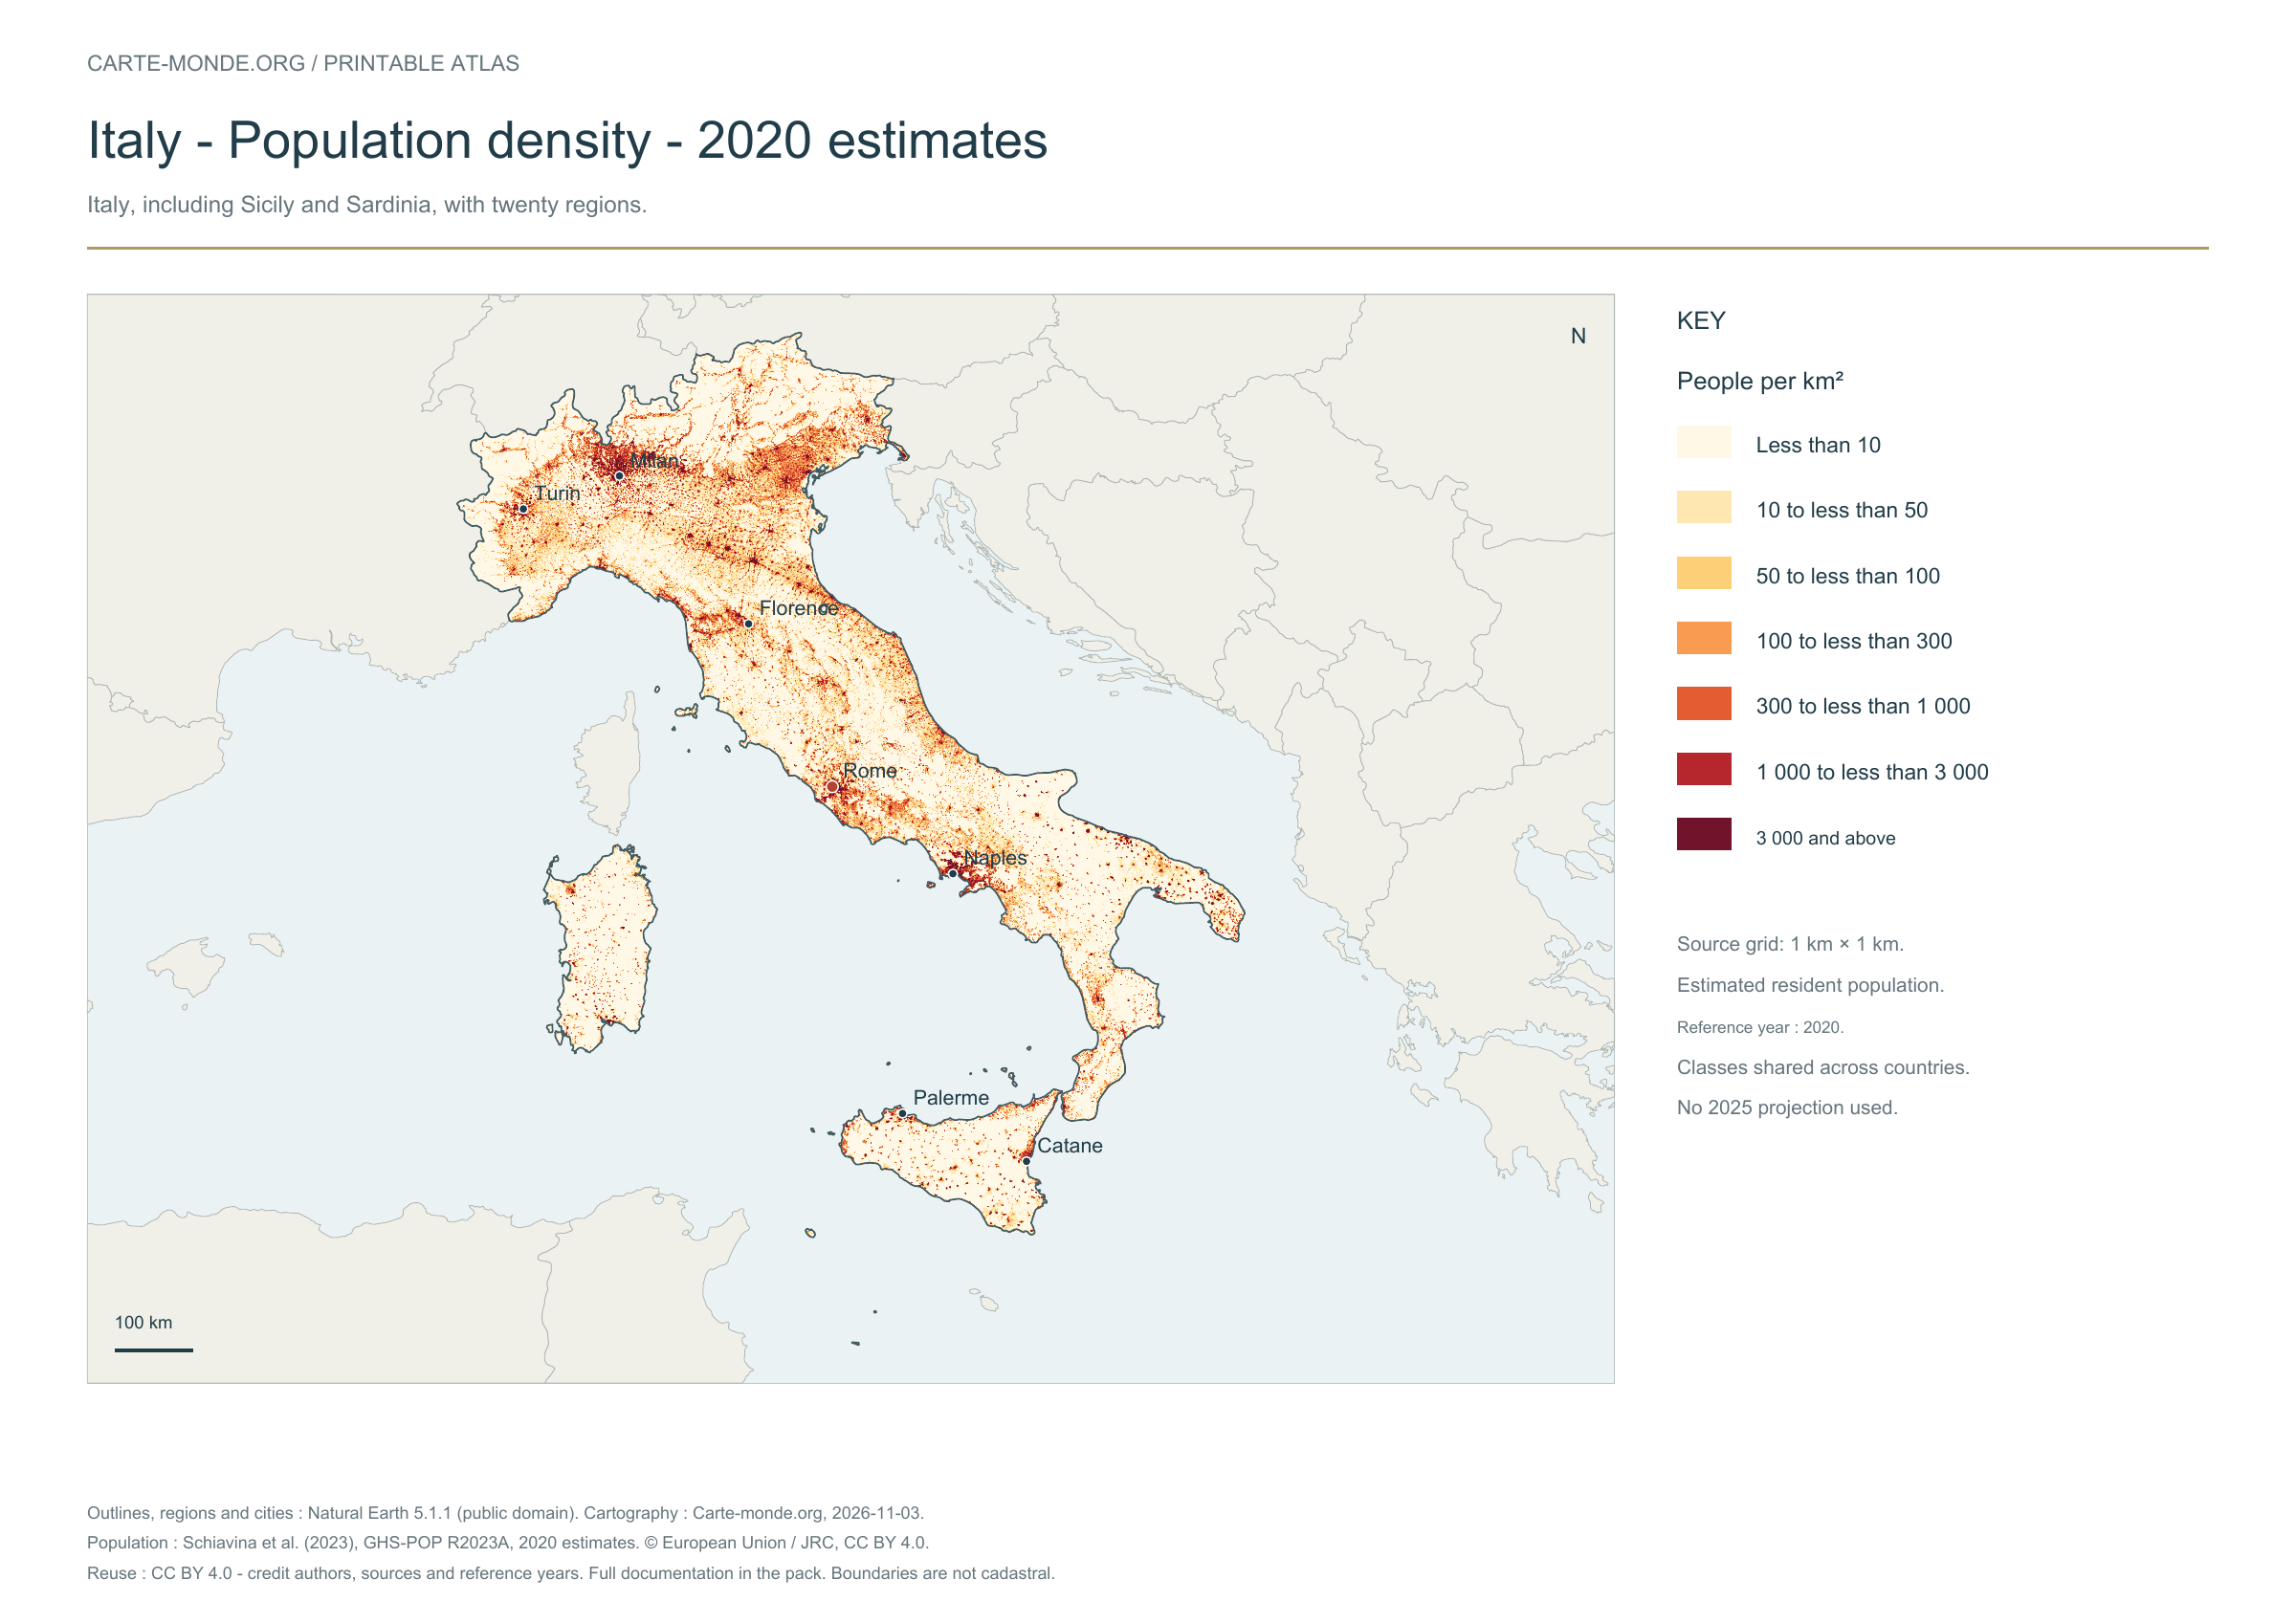
Population density — 2020 estimates — Italy

Carte-monde.org · November 2026

Population density — 2020 estimates

Estimated residential population in 2020, on a source grid of 1 km². Inhabitants/km² classes are shared across countries; no 2025 projection.

A4 landscape PDF · PNG 2 400 px · CC BY 4.0

The data represents estimated residential population in 2020, on a 1 km² source grid. The document’s creation date does not change this reference year.

The five in-house maps in one pack

Regions and cities, location in Europe, simplified elevations, 2020 population density and shaded relief: five A4 PDFs, their PNGs and SVGs, with sources and licences.

Download the five maps — ZIP
Previous edition packs

The four maps in one pack

Four A4 PDFs, their PNGs and SVGs, with full notes. Terrain and density use an embedded image background; text and linework remain vector-based.

Download the Italy pack — ZIP

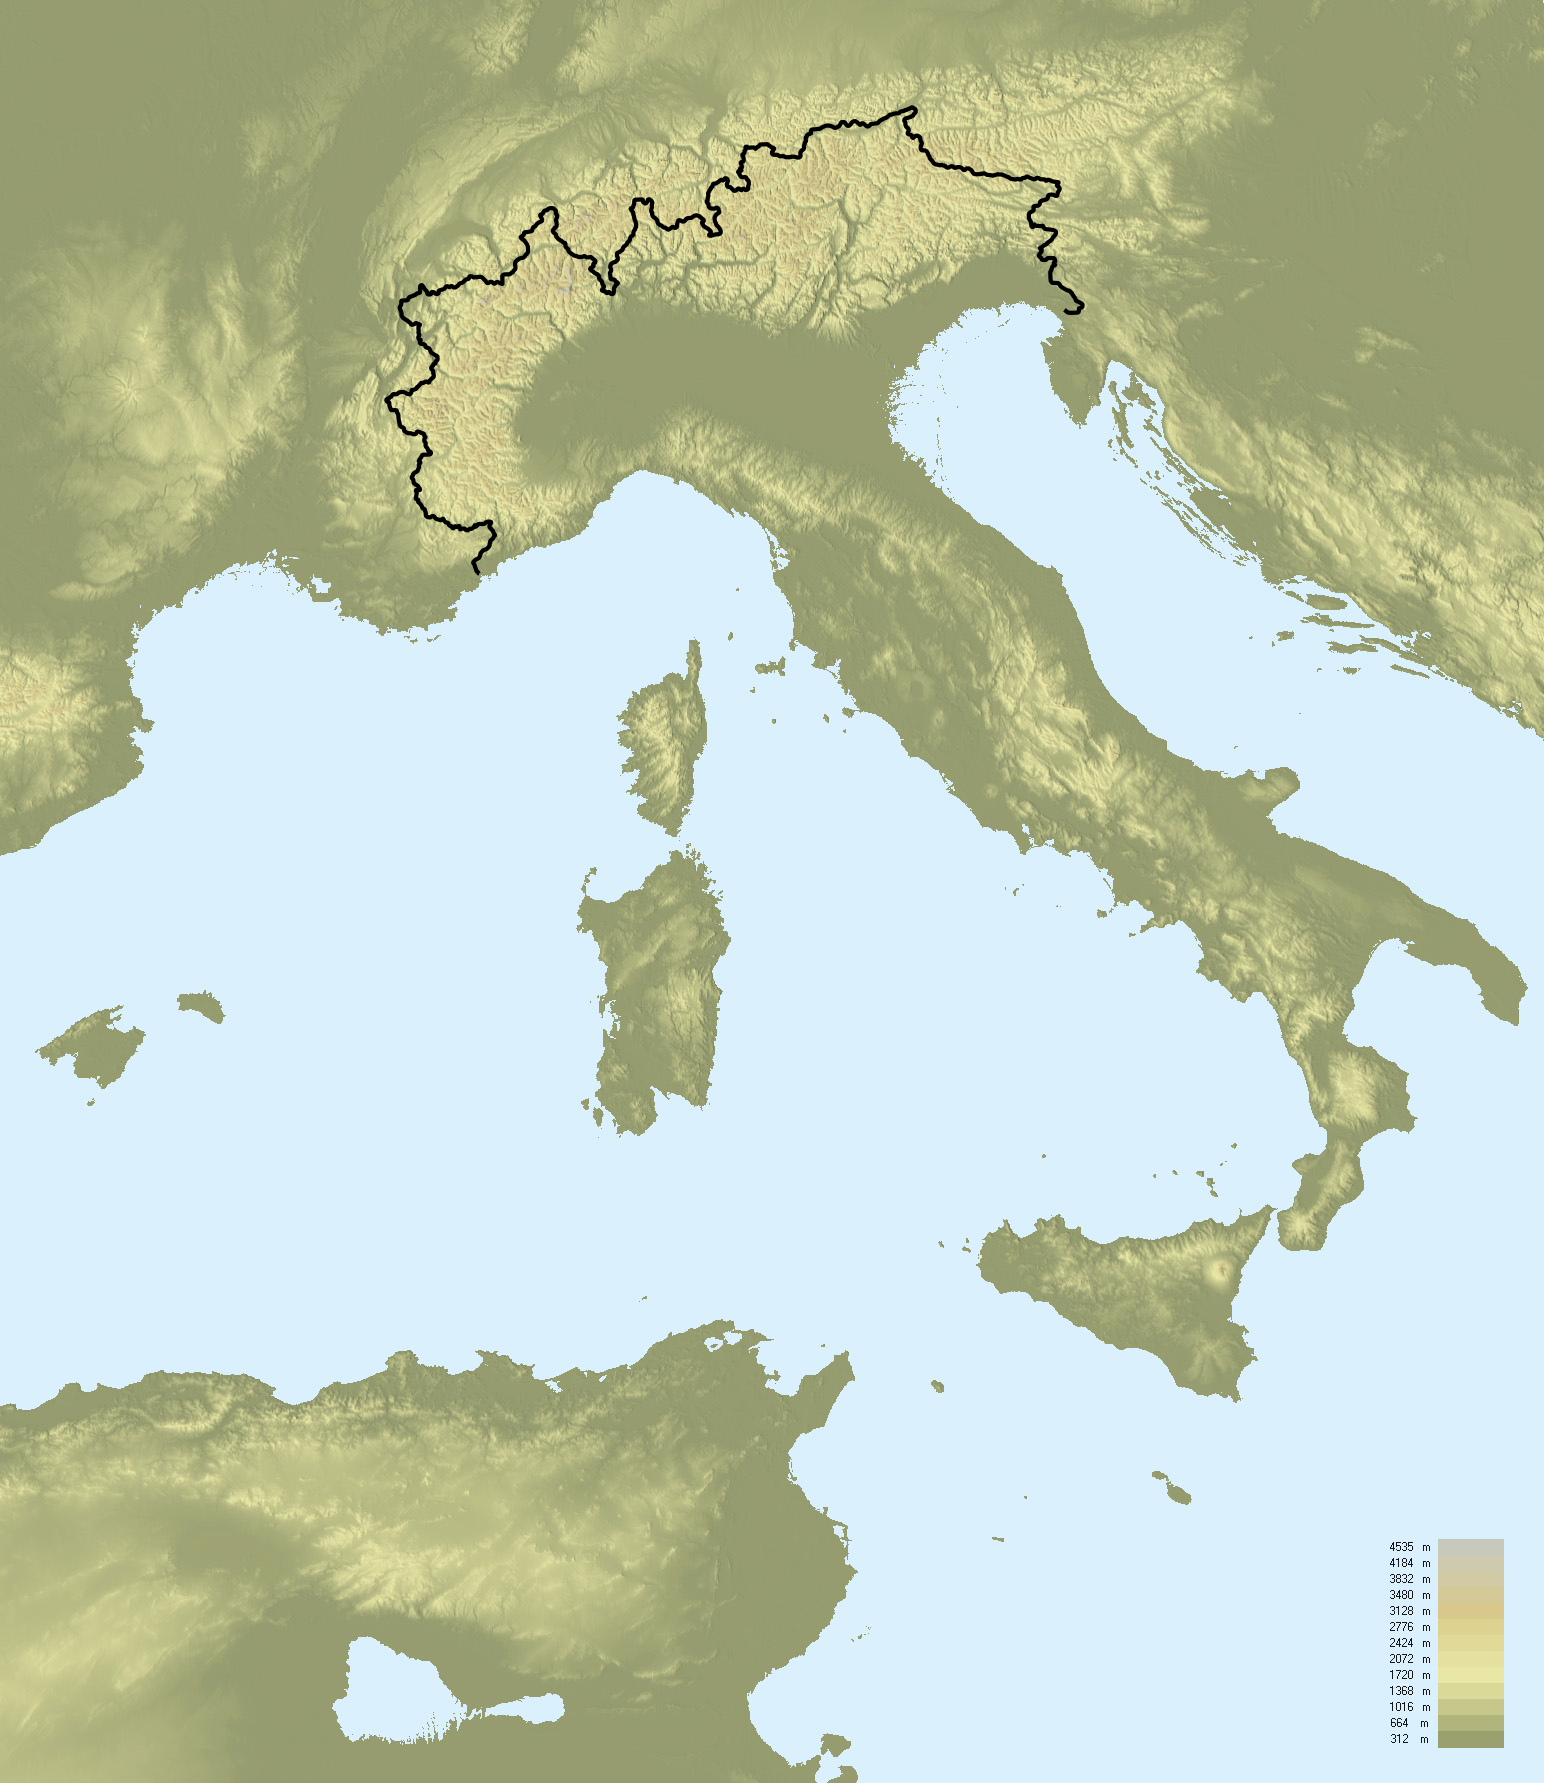
An additional reference map

Existing document, preserved in its original language and with its creation date. This map is not presented as a current administrative edition.

Topographic map of Italy with borders.png — reference 2008

Created: 2008-01-24

Topographic map of Italy with borders.png

F l a n k e r · Public domain, according to the author’s declaration · Original file page and source
Download the original and its credits — ZIP

Retain the stated authors and conditions; adaptations of CC BY-SA maps must keep an identical or compatible licence.

Find the old maps of Italy

Previously published maps remain accessible at their original URLs, with the collection’s text and credits.

Open the old maps of Italy

Choose and print a map

Regions and cities show how the territory is organized; the location map places the country; terrain shows the main natural regions; density shows population distribution. Print the in-house PDFs in A4 landscape with “Fit to page”. Insets have their own scales.

For exercises: six blank base maps of Italy.

Sources, reference years and reuse

Outlines, regions, cities and hydrography: Natural Earth 5.1.1, public domain. Generalized boundaries at 1:10 million, not cadastral; edition year 2026 does not mean that all geometries have been updated.

Relief: SRTM15+ / Tozer et al. (2019), reference publication, via GMT earth_relief_02m derived from SRTM15+V2.7. Grid smoothed to two arc minutes, suitable for a national overview, without topographic precision.

Population: Schiavina et al. (2023), GHS-POP R2023A, 2020 residential estimates, © European Union / JRC, CC BY 4.0. The 1 km² Mollweide cells are expressed in inhabitants/km². Methodology: Pesaresi et al. (2024).

The four new maps: created by Carte-monde.org, November 2026, under CC BY 4.0. Cite authors, sources and reference years, and indicate adaptations. Additional and older maps retain their own rights.

Country maps · Other maps and archives

Previous versions: maps and files preserved

These files remain available at their original URLs. For corrected maps, use the main links above. Each edition retains its credits and date.

Raster base map, cities, rivers and lakes: Natural Earth, public domain. Other boundary credits and licences are retained in the pack. Cartographic work CC BY 4.0; ODbL-derived data retains its licence. No topographic accuracy is claimed.

Other maps: sources and reuse

Reference maps by external authors. Each document retains its licence, credits and date. “View map” links open the document on Commons; ZIP buttons provide access to the files kept in this collection.

Population density in Italy.png
Author: nerdy.maps · CC BY-SA 4.0 · Original file page, sources and licence

Date stated by the source: 2020-06-02. The data reference year may differ from the document’s; consult its legend.

View the map on Commons

To reuse a CC BY map, cite its authors, source and licence and indicate any changes. Adaptations of a CC BY-SA map retain the same or a compatible licence. CC0 documents may be reused freely; retaining the source makes them easier to identify. These rights do not make all administrative boundaries current.

Previous collection — original files preserved
Flag of Italy
Flag of Italy
Italy downloadable maps
general map of Italy
Map of Italian regions
general map of Italy
Relief Map of Italy
Relief Map of Italy
Original French files
Previous language edition

Maps of Latvia: regions, cities, relief and population

Flag of Latvia
Flag of Latvia

LATVIA · PRINTABLE MAPS

Five printable maps of Latvia: regions and cities, location in Europe, two views of the relief and population. PDFs, images and sources are available below.

Our five maps have English labels. Maps from other publishers retain their original language.

Regions, cities and location in Europe

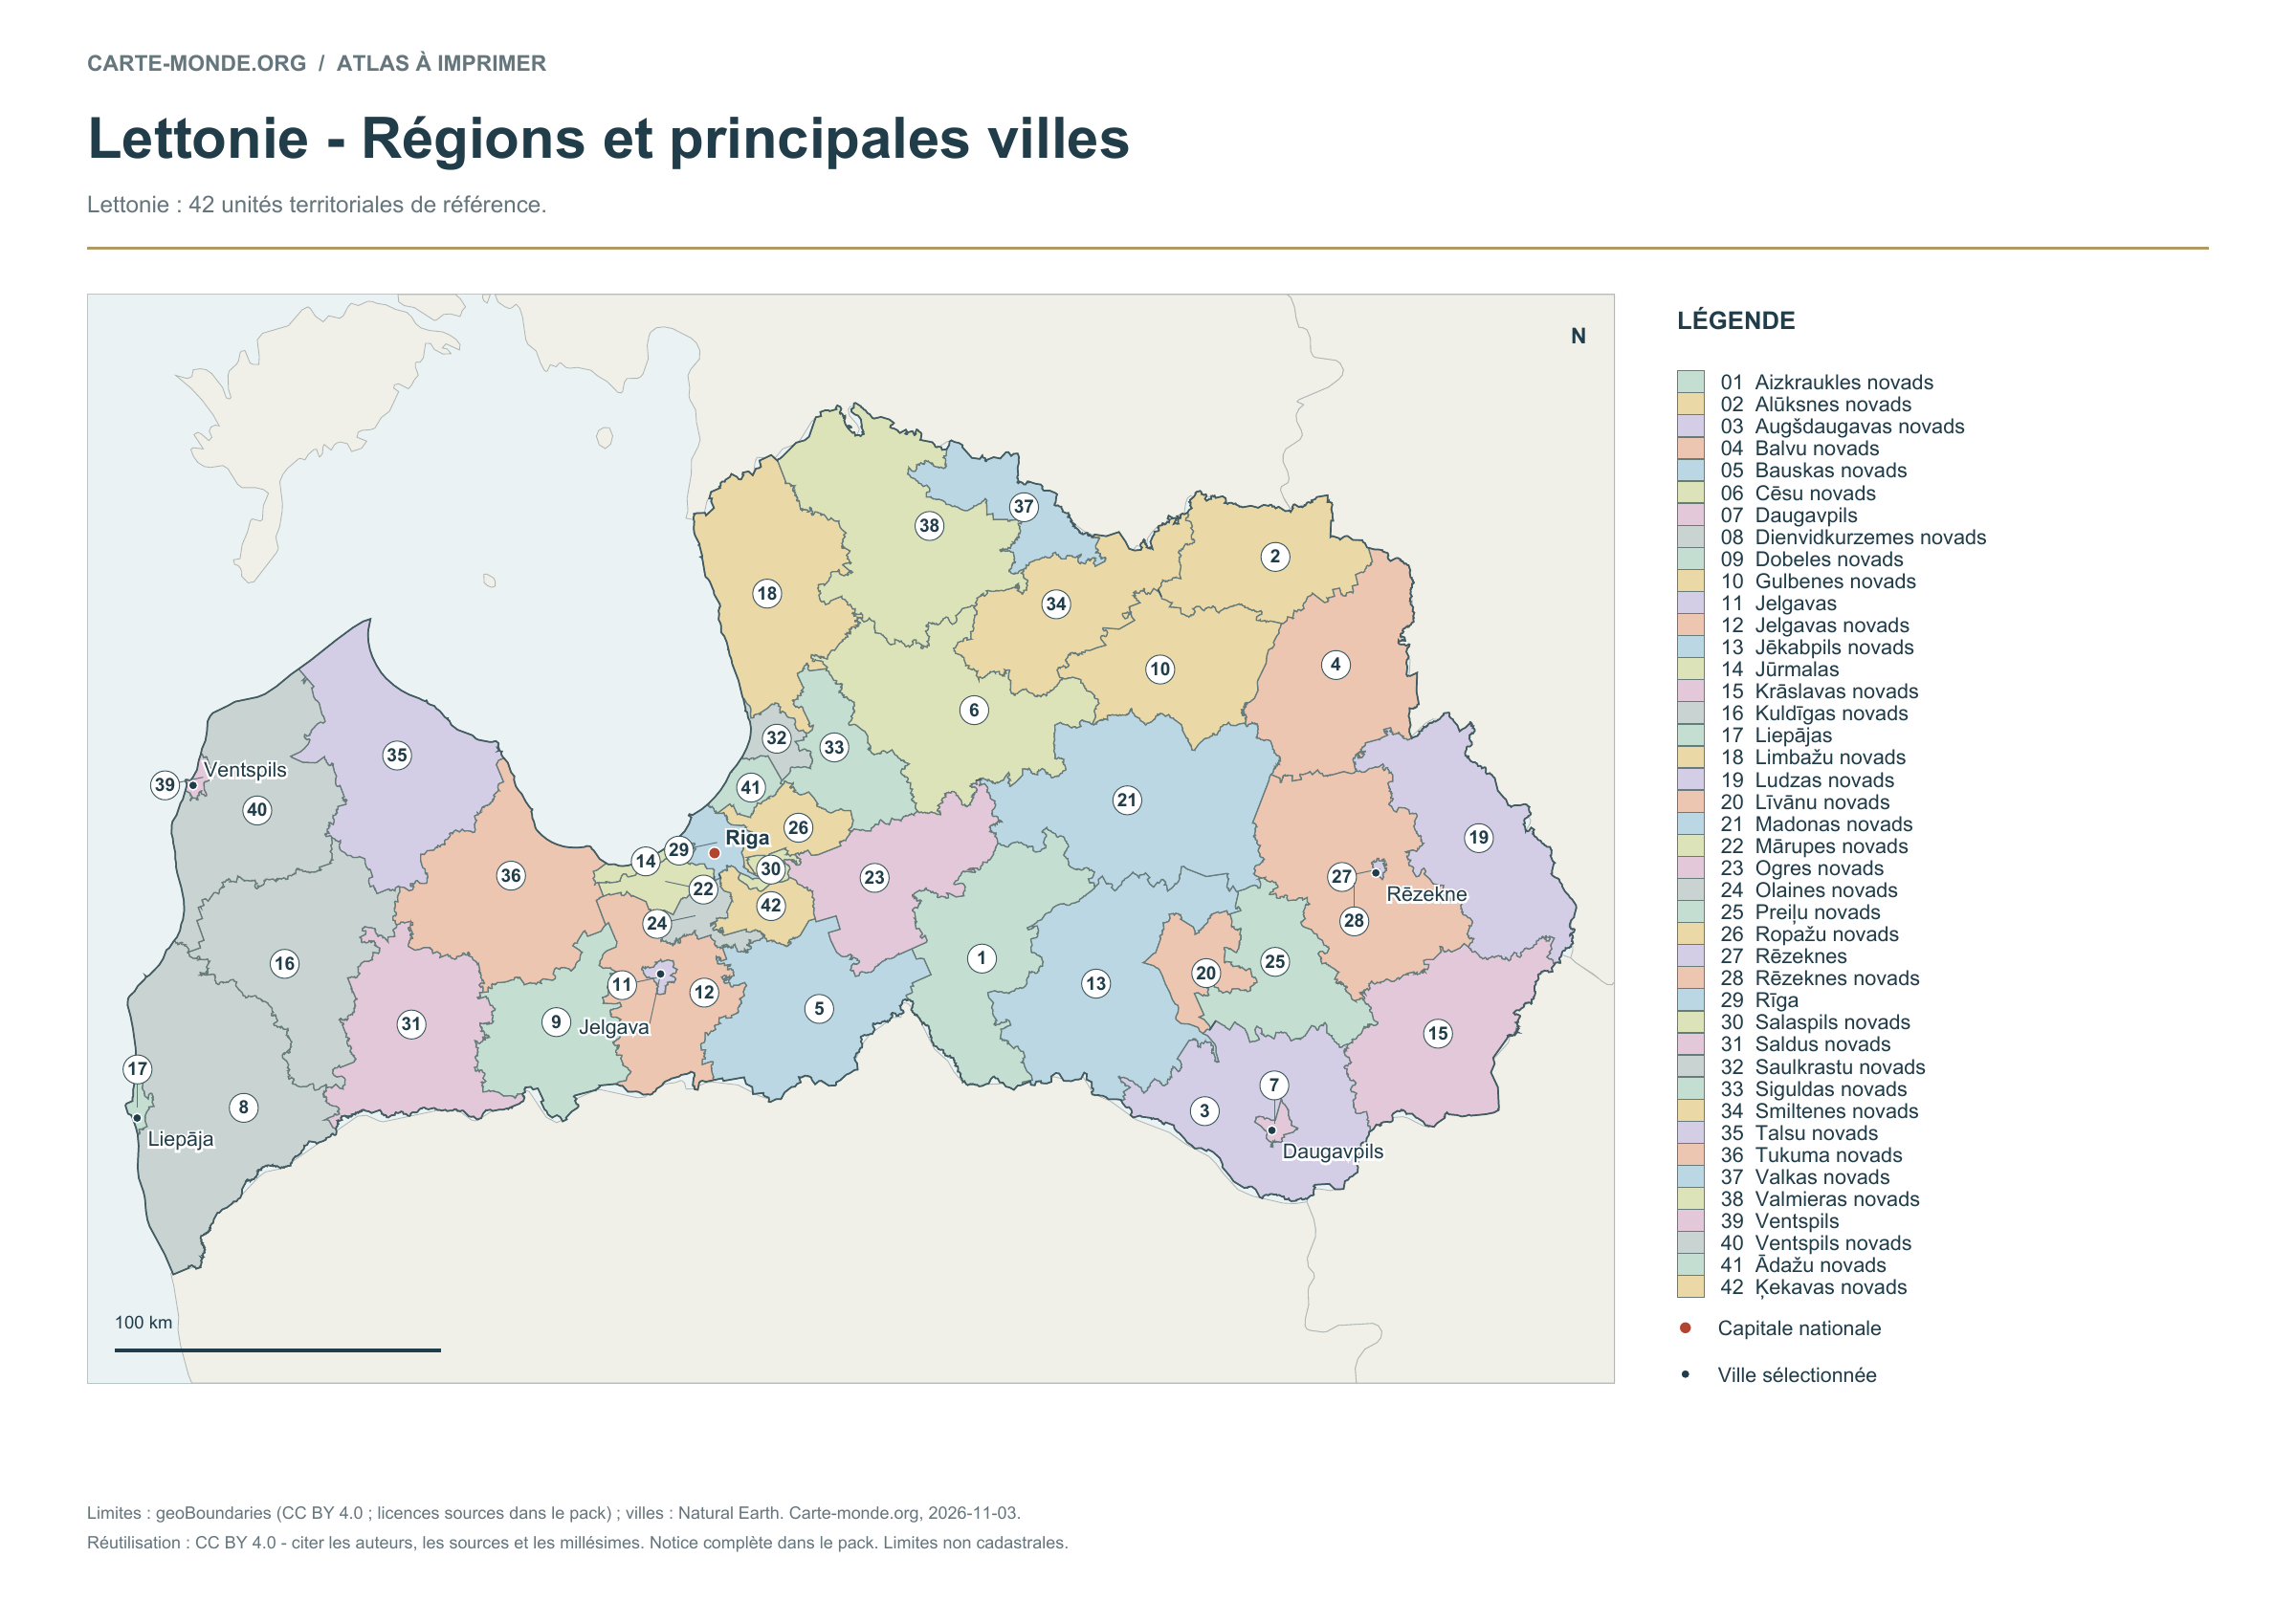
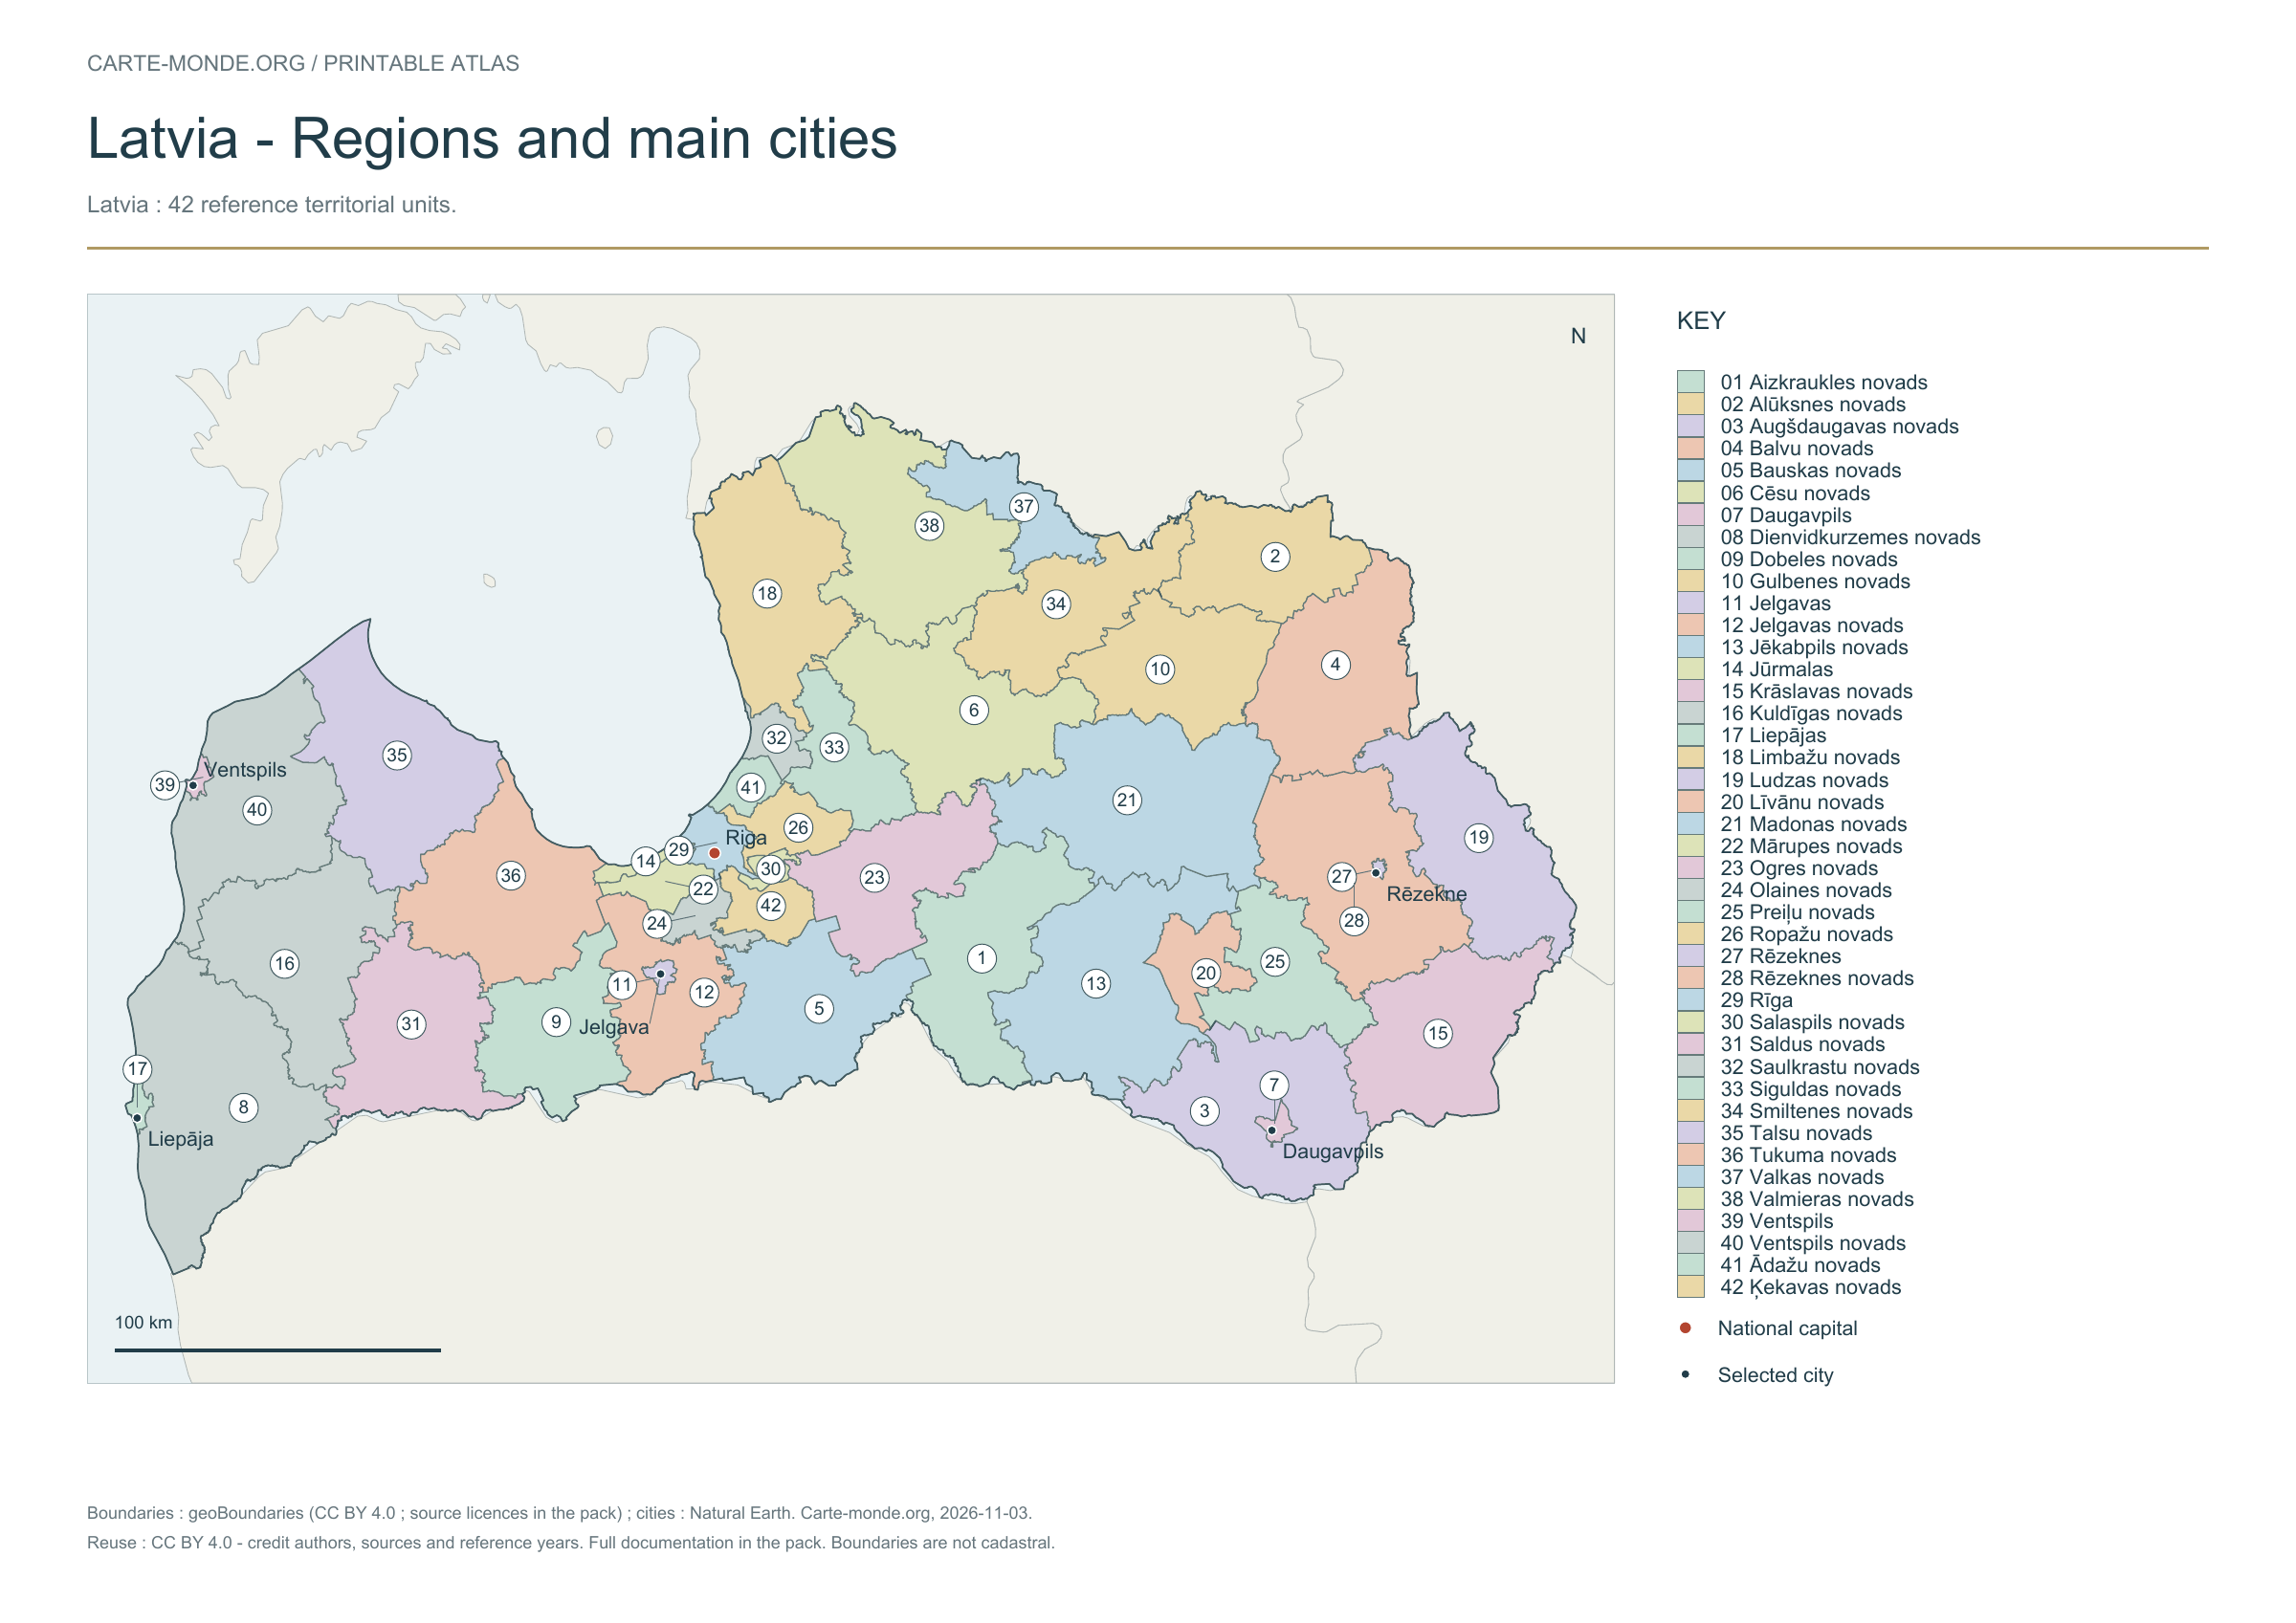
Latvia: 42 reference territorial units.

Regions and main cities — Latvia

Carte-monde.org · November 2026

Regions and main cities

The 42 reference territorial units are numbered and named in the key, with selected cities and the capital.

A4 landscape PDF · PNG 2 400 px · CC BY 4.0

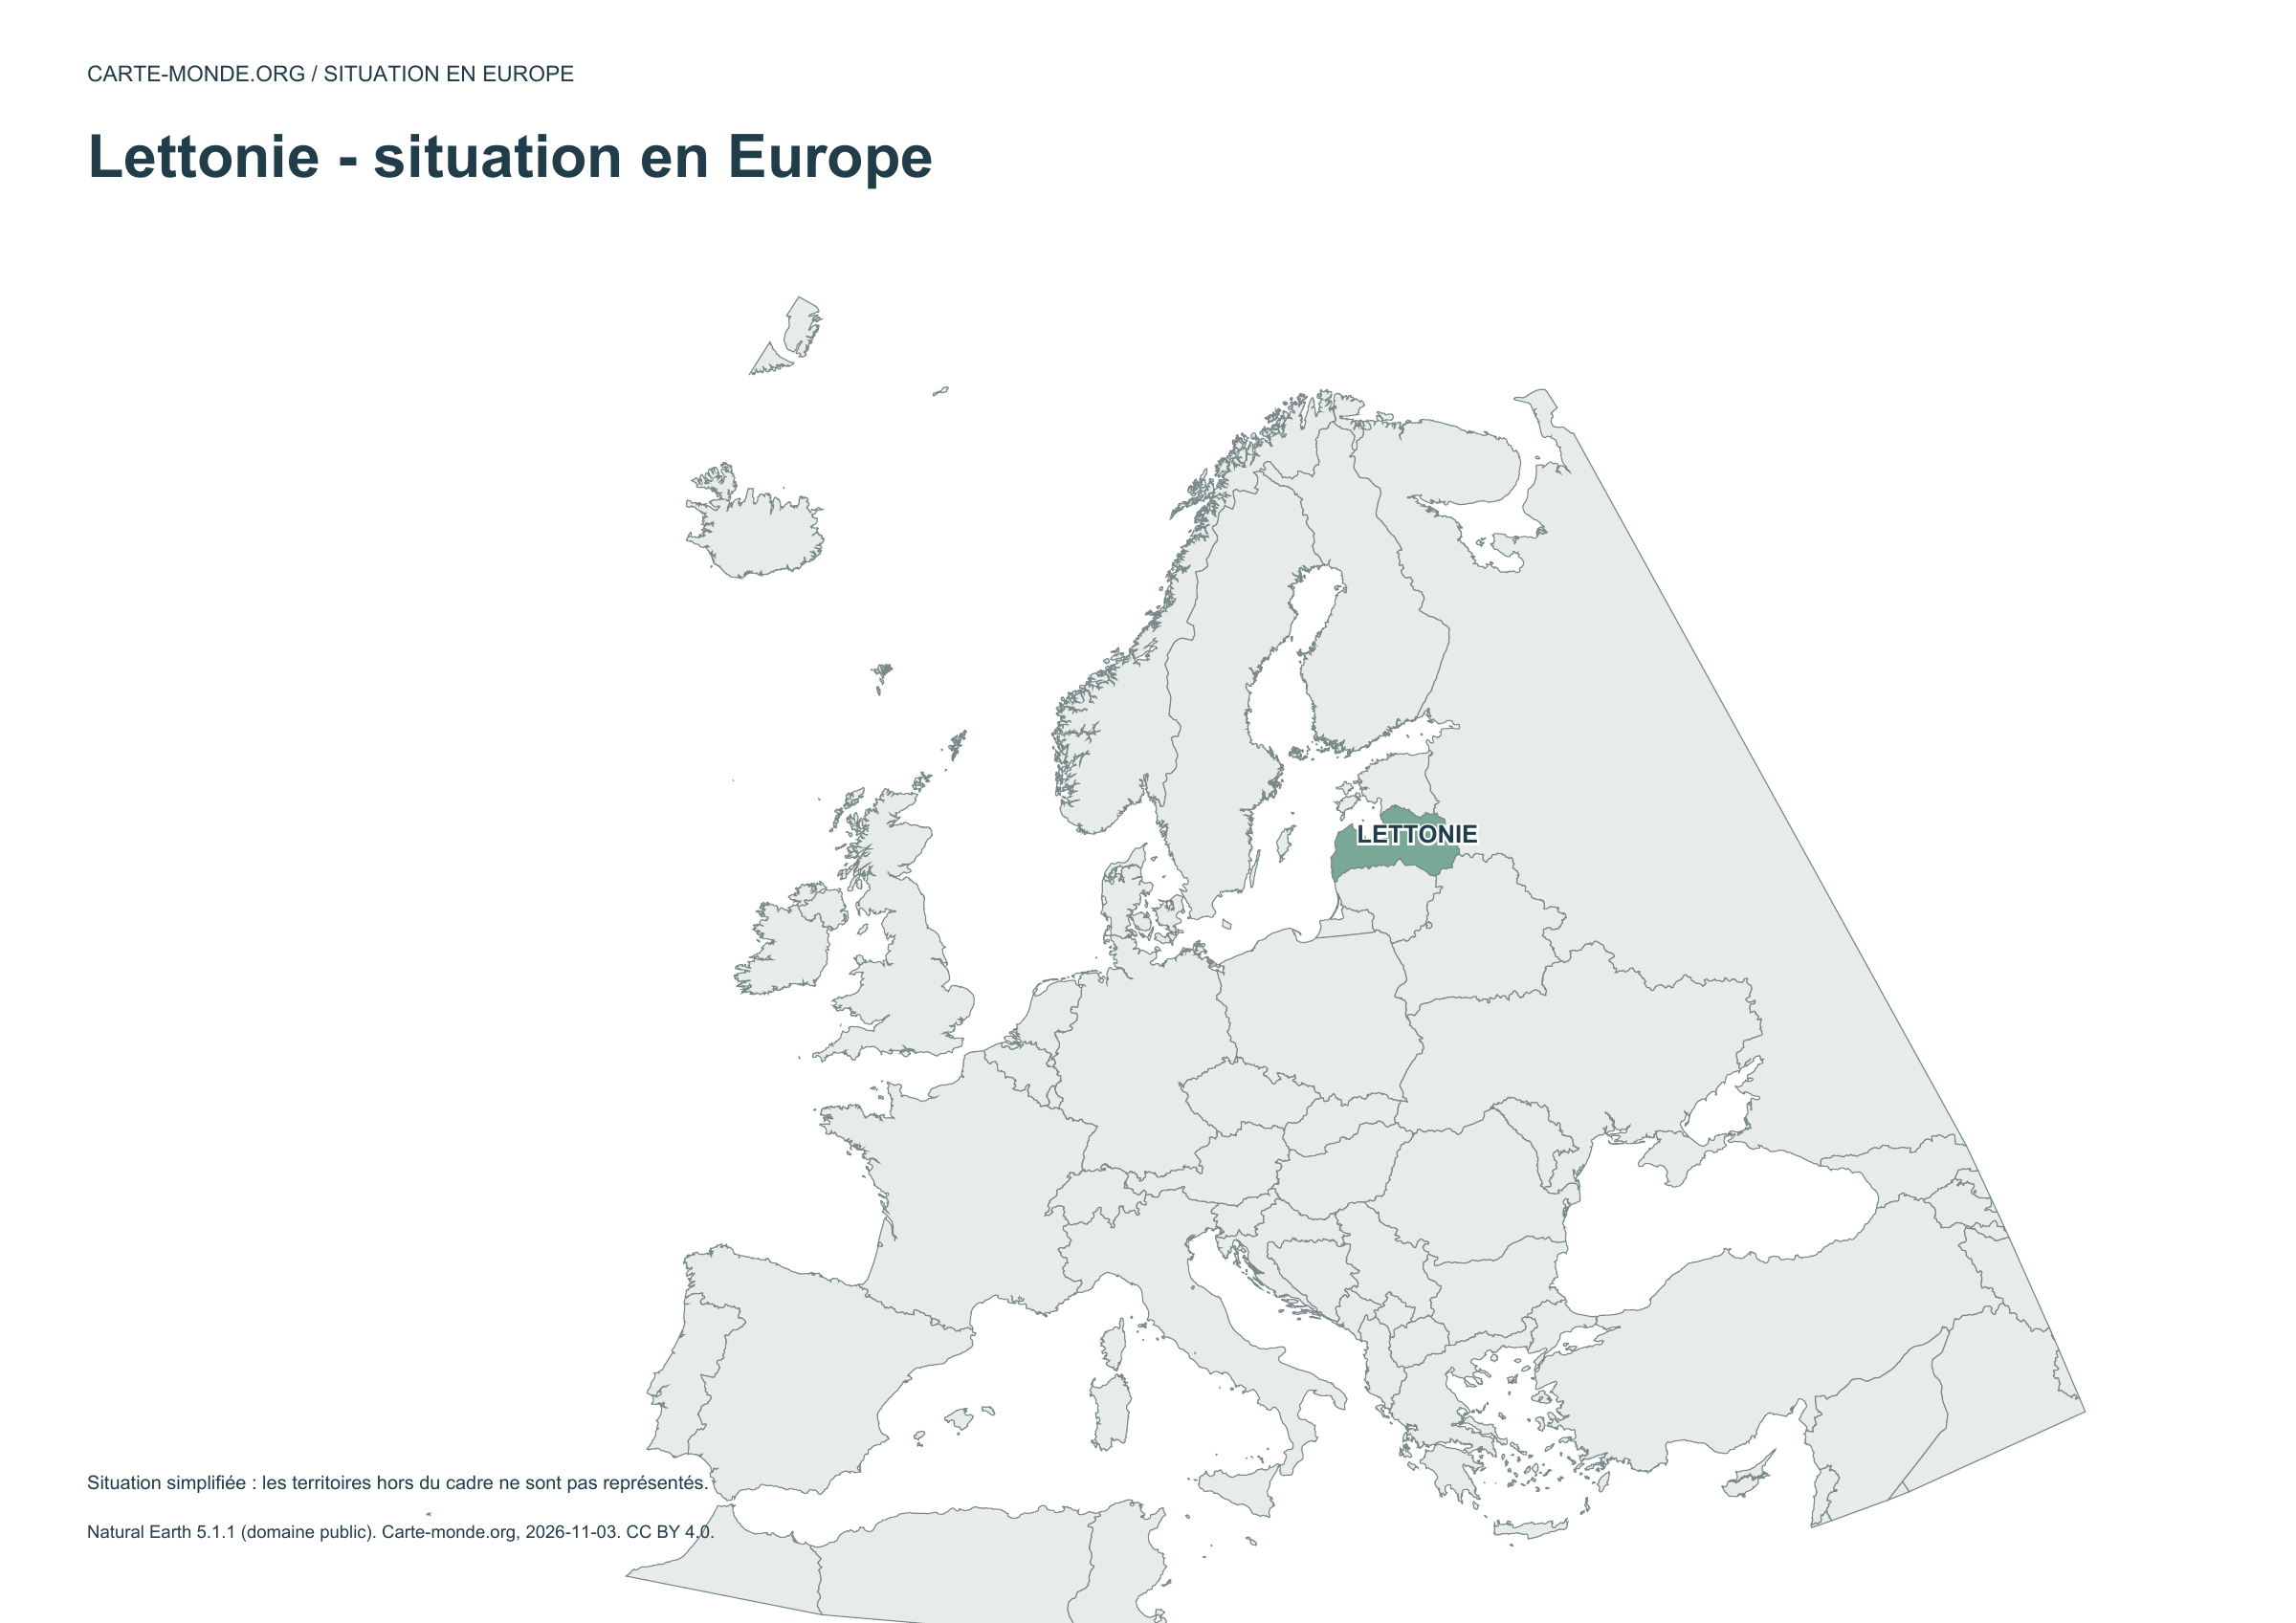
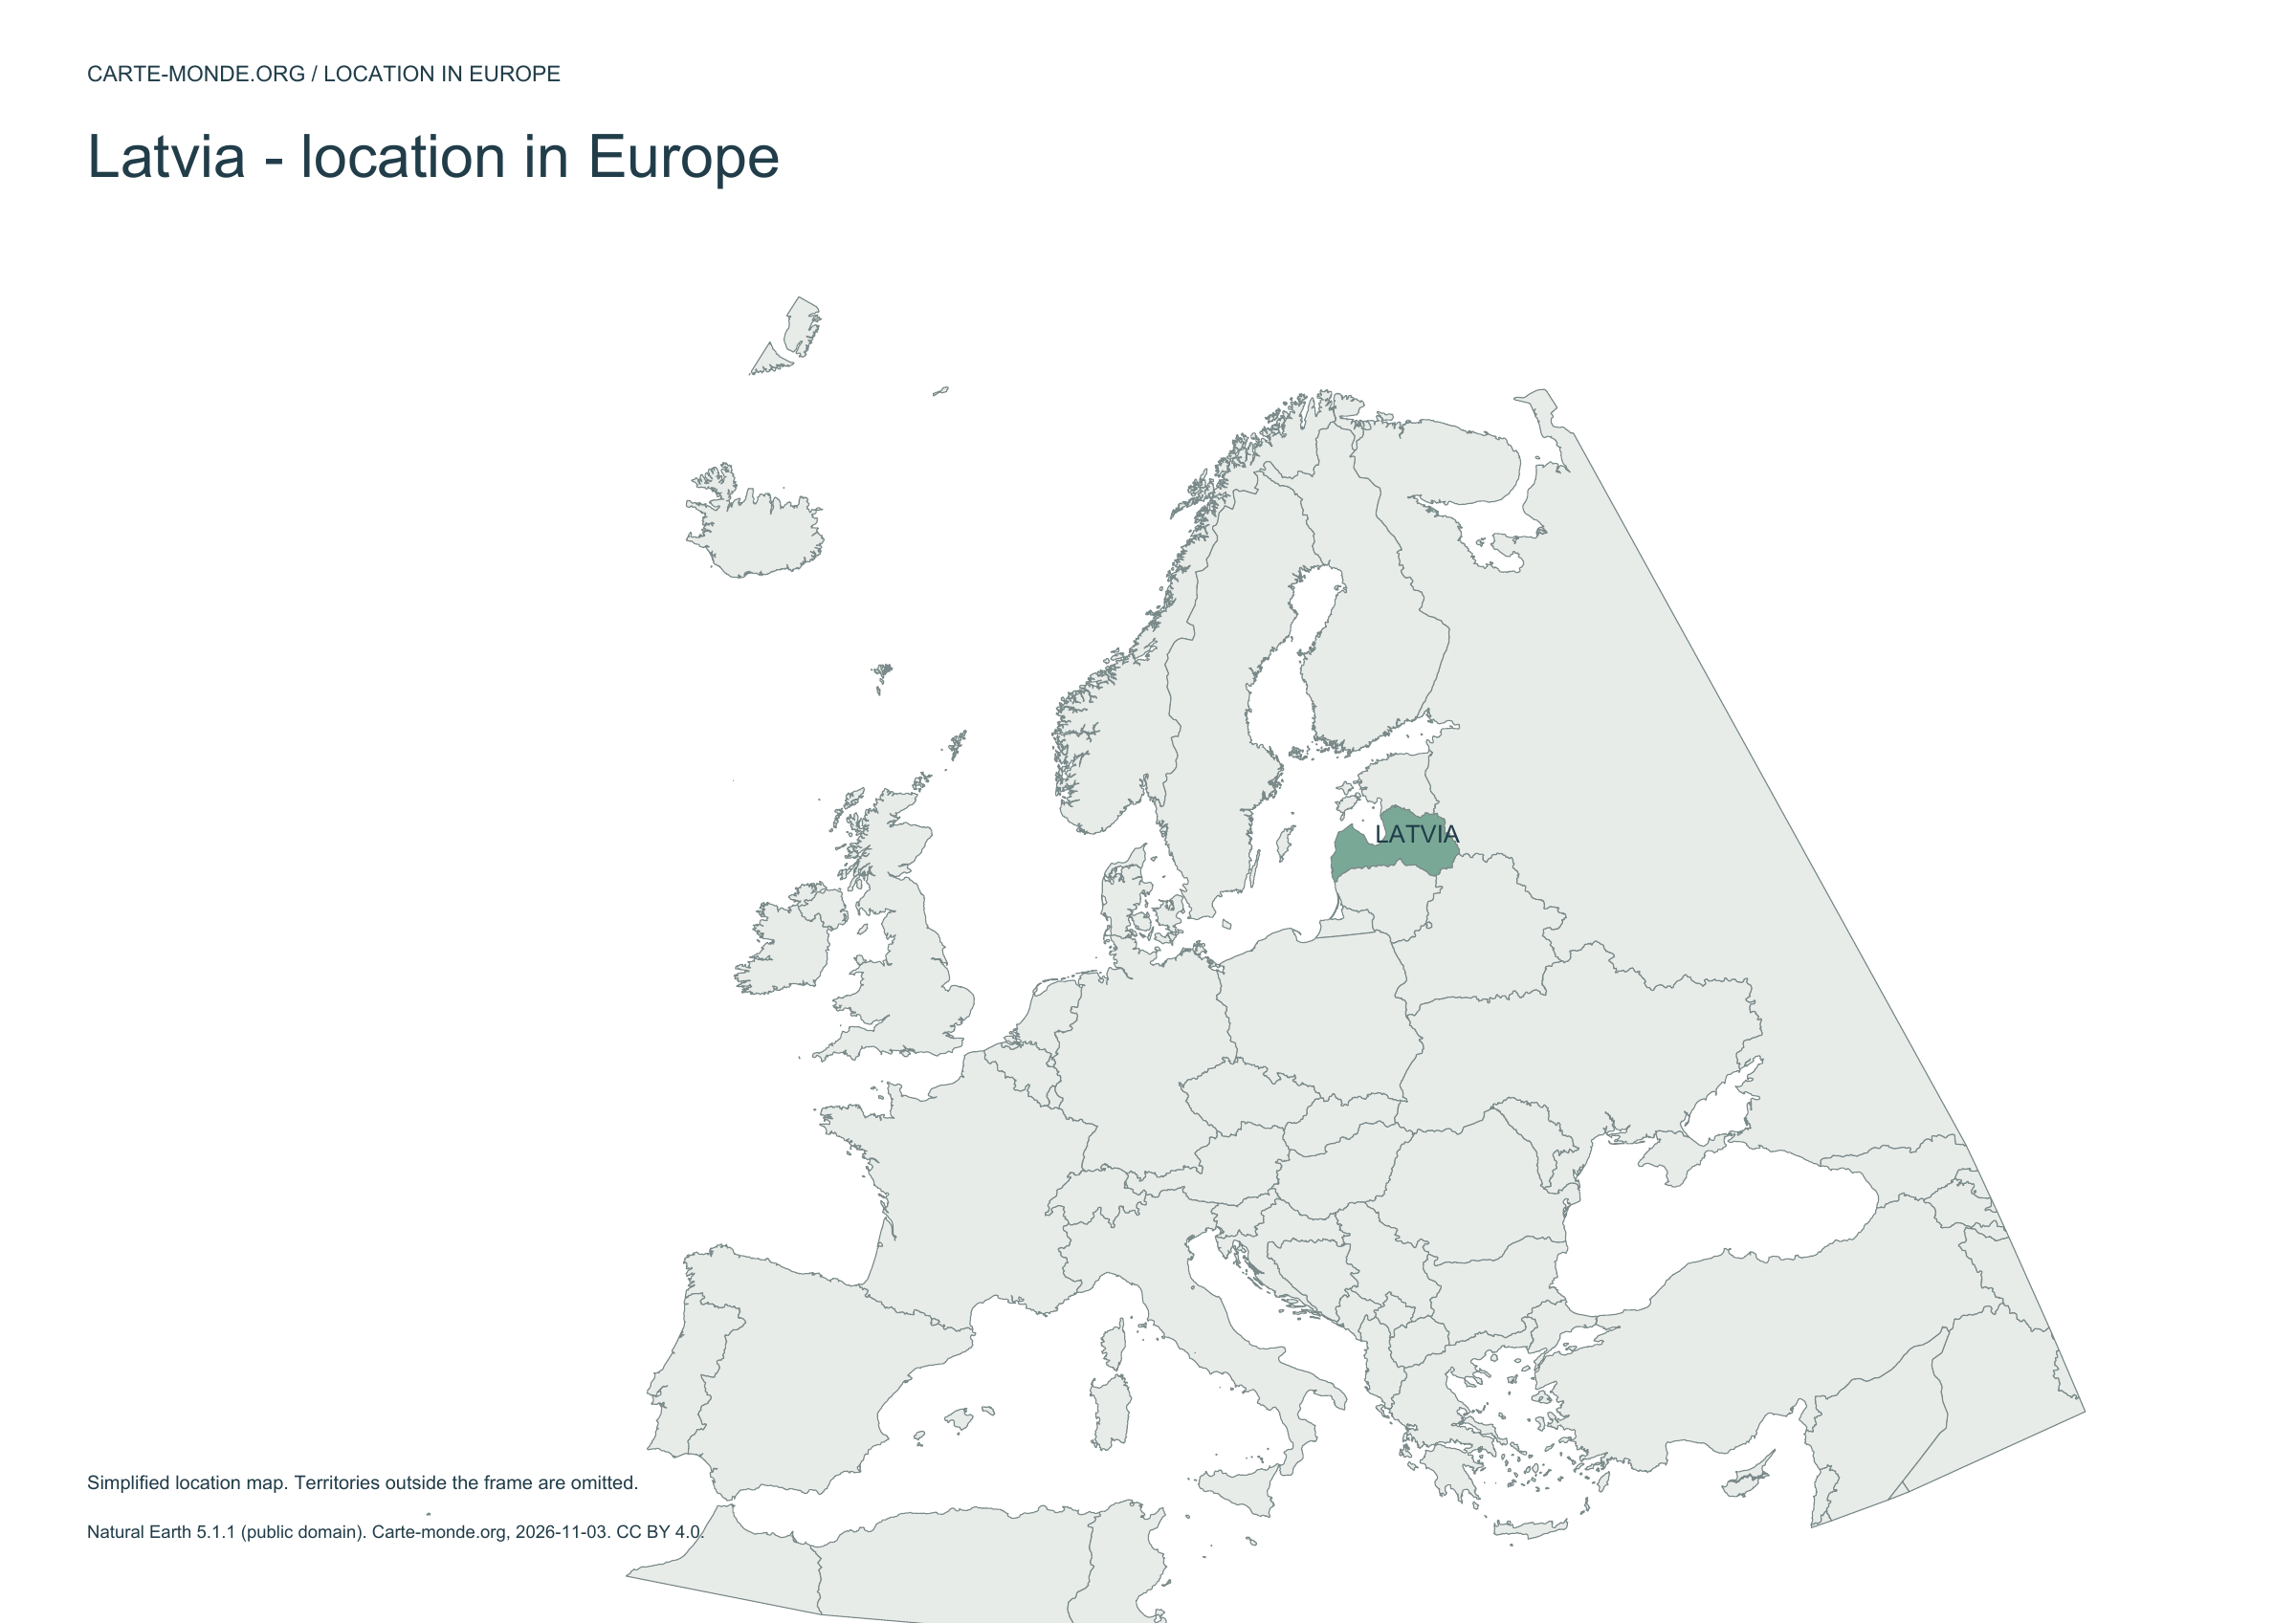
Location in Europe — Latvia

Carte-monde.org · November 2026

Location in Europe

The country is highlighted within a simplified European frame; territories outside this frame are not shown.

A4 landscape PDF · PNG 2 400 px · CC BY 4.0

Two maps to understand the relief

Choose shaded relief for an overview, or elevation classes for school use.

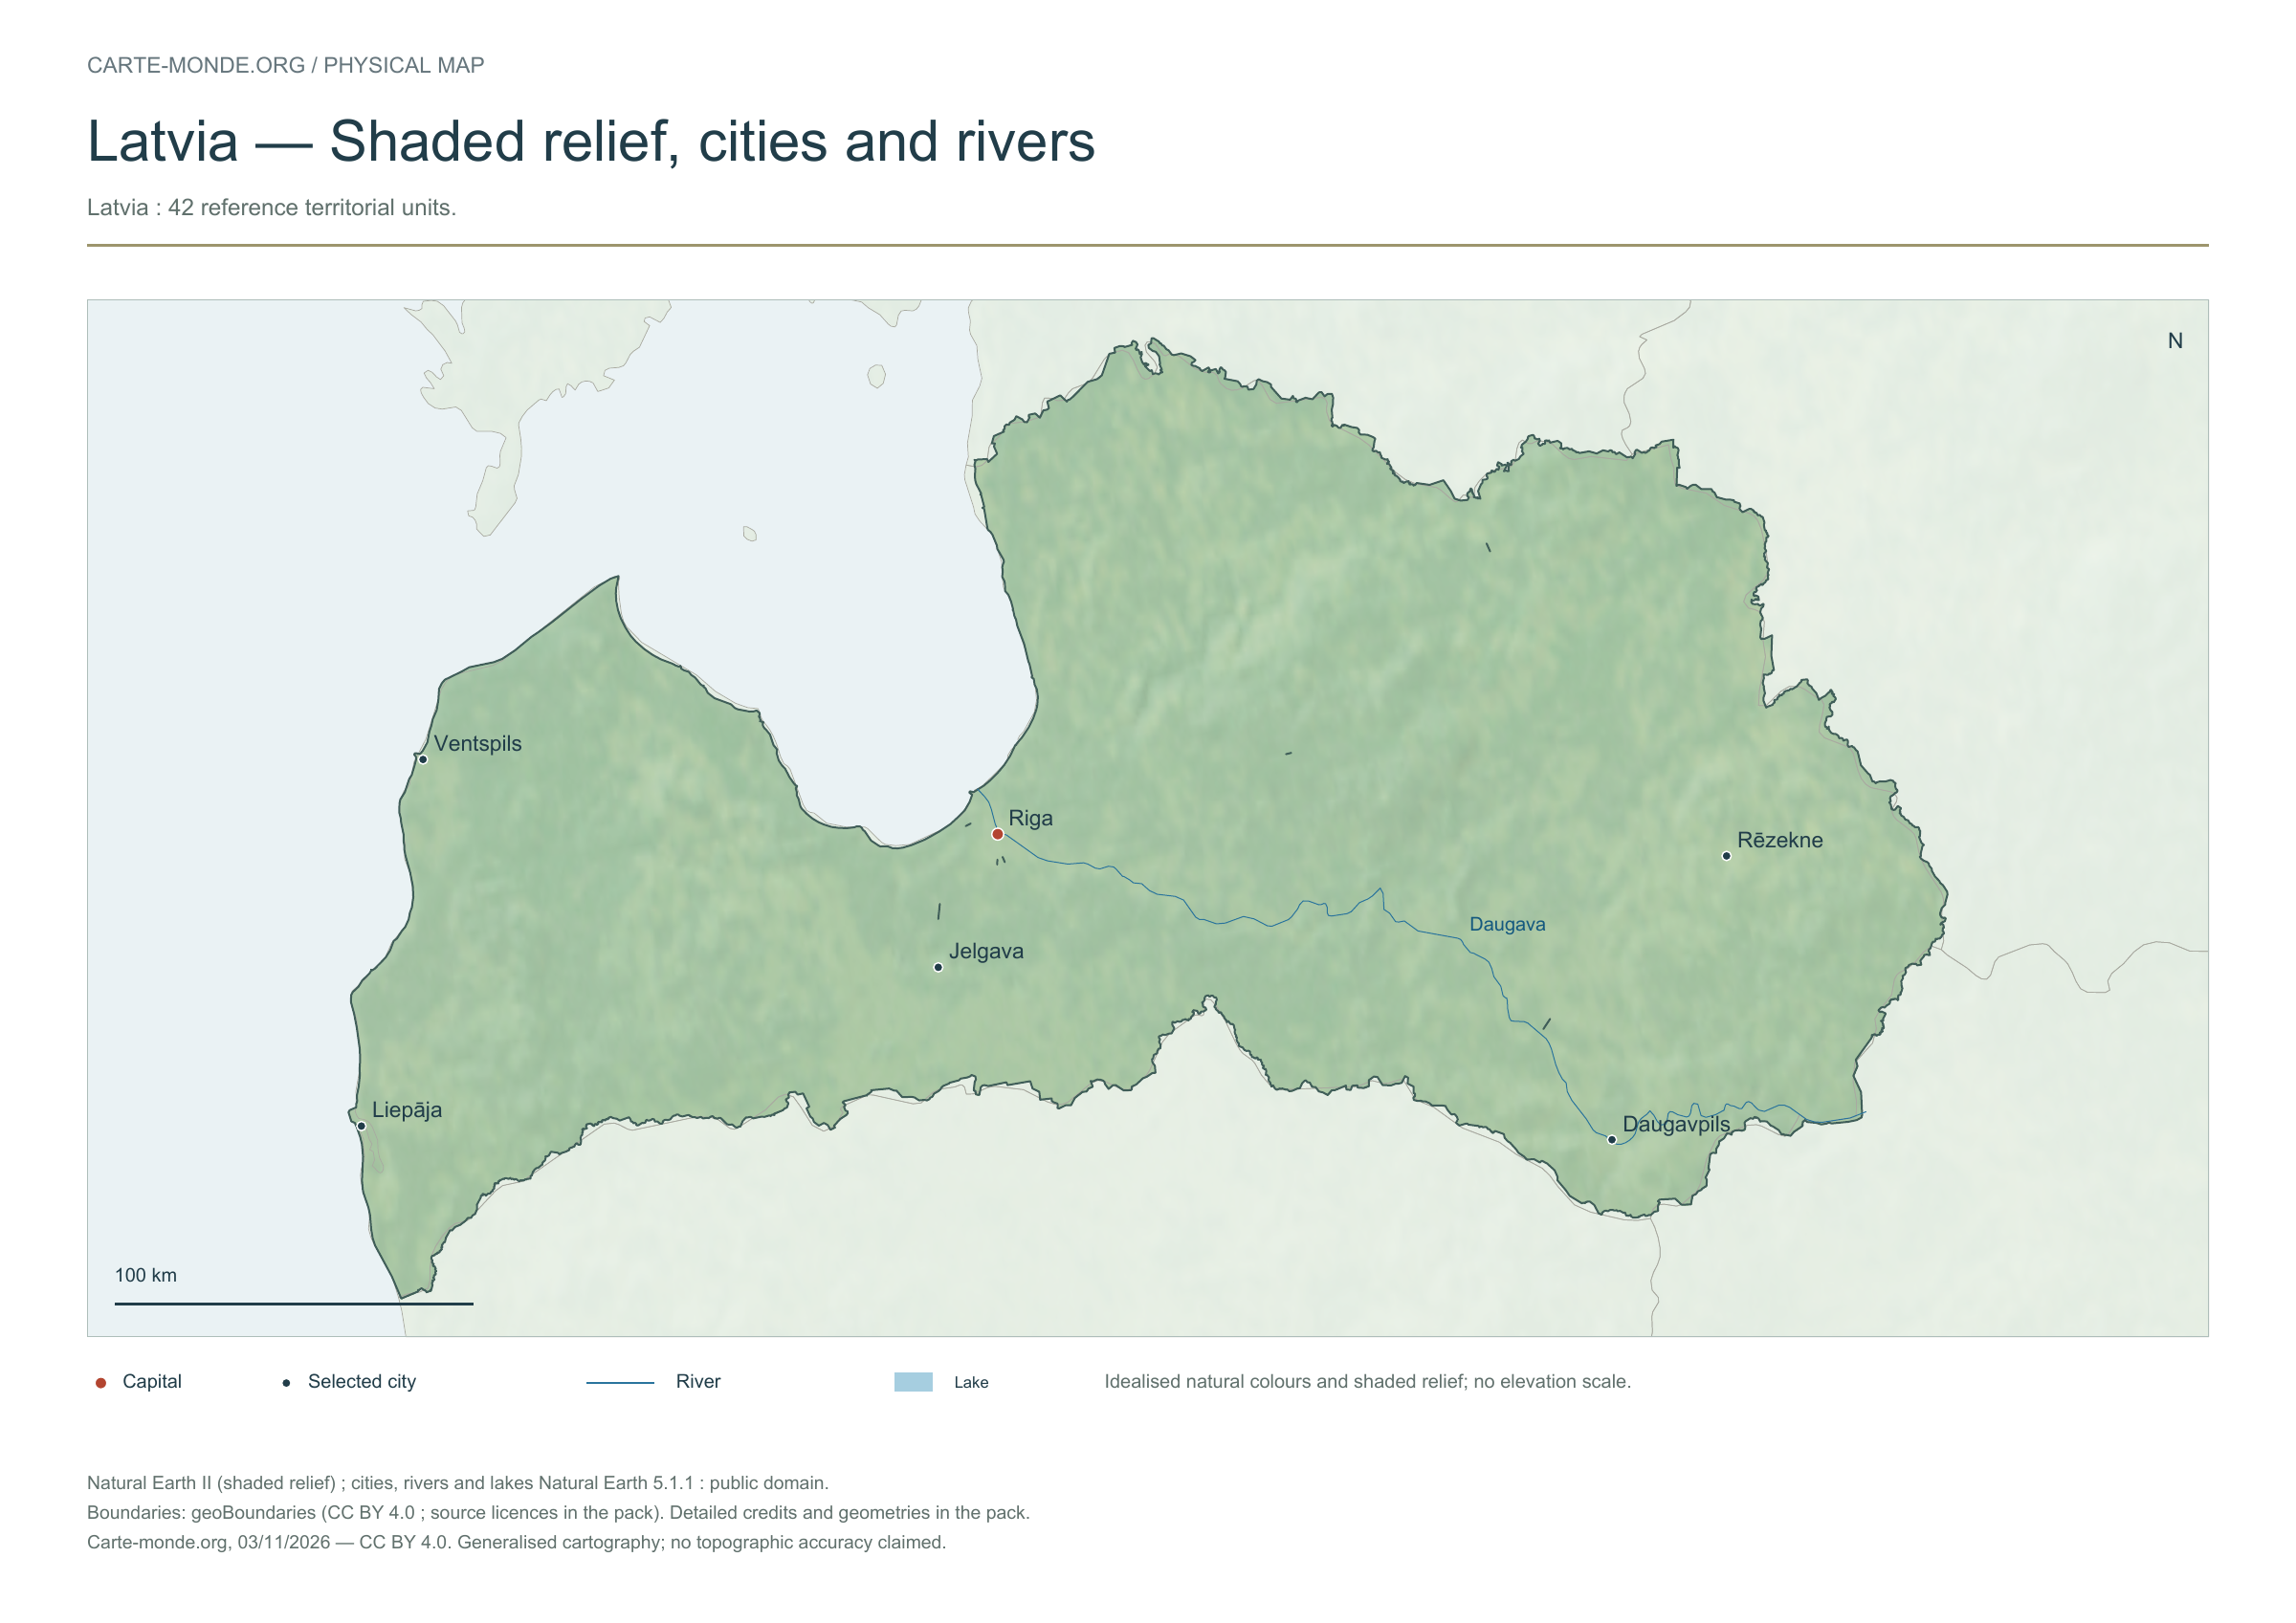
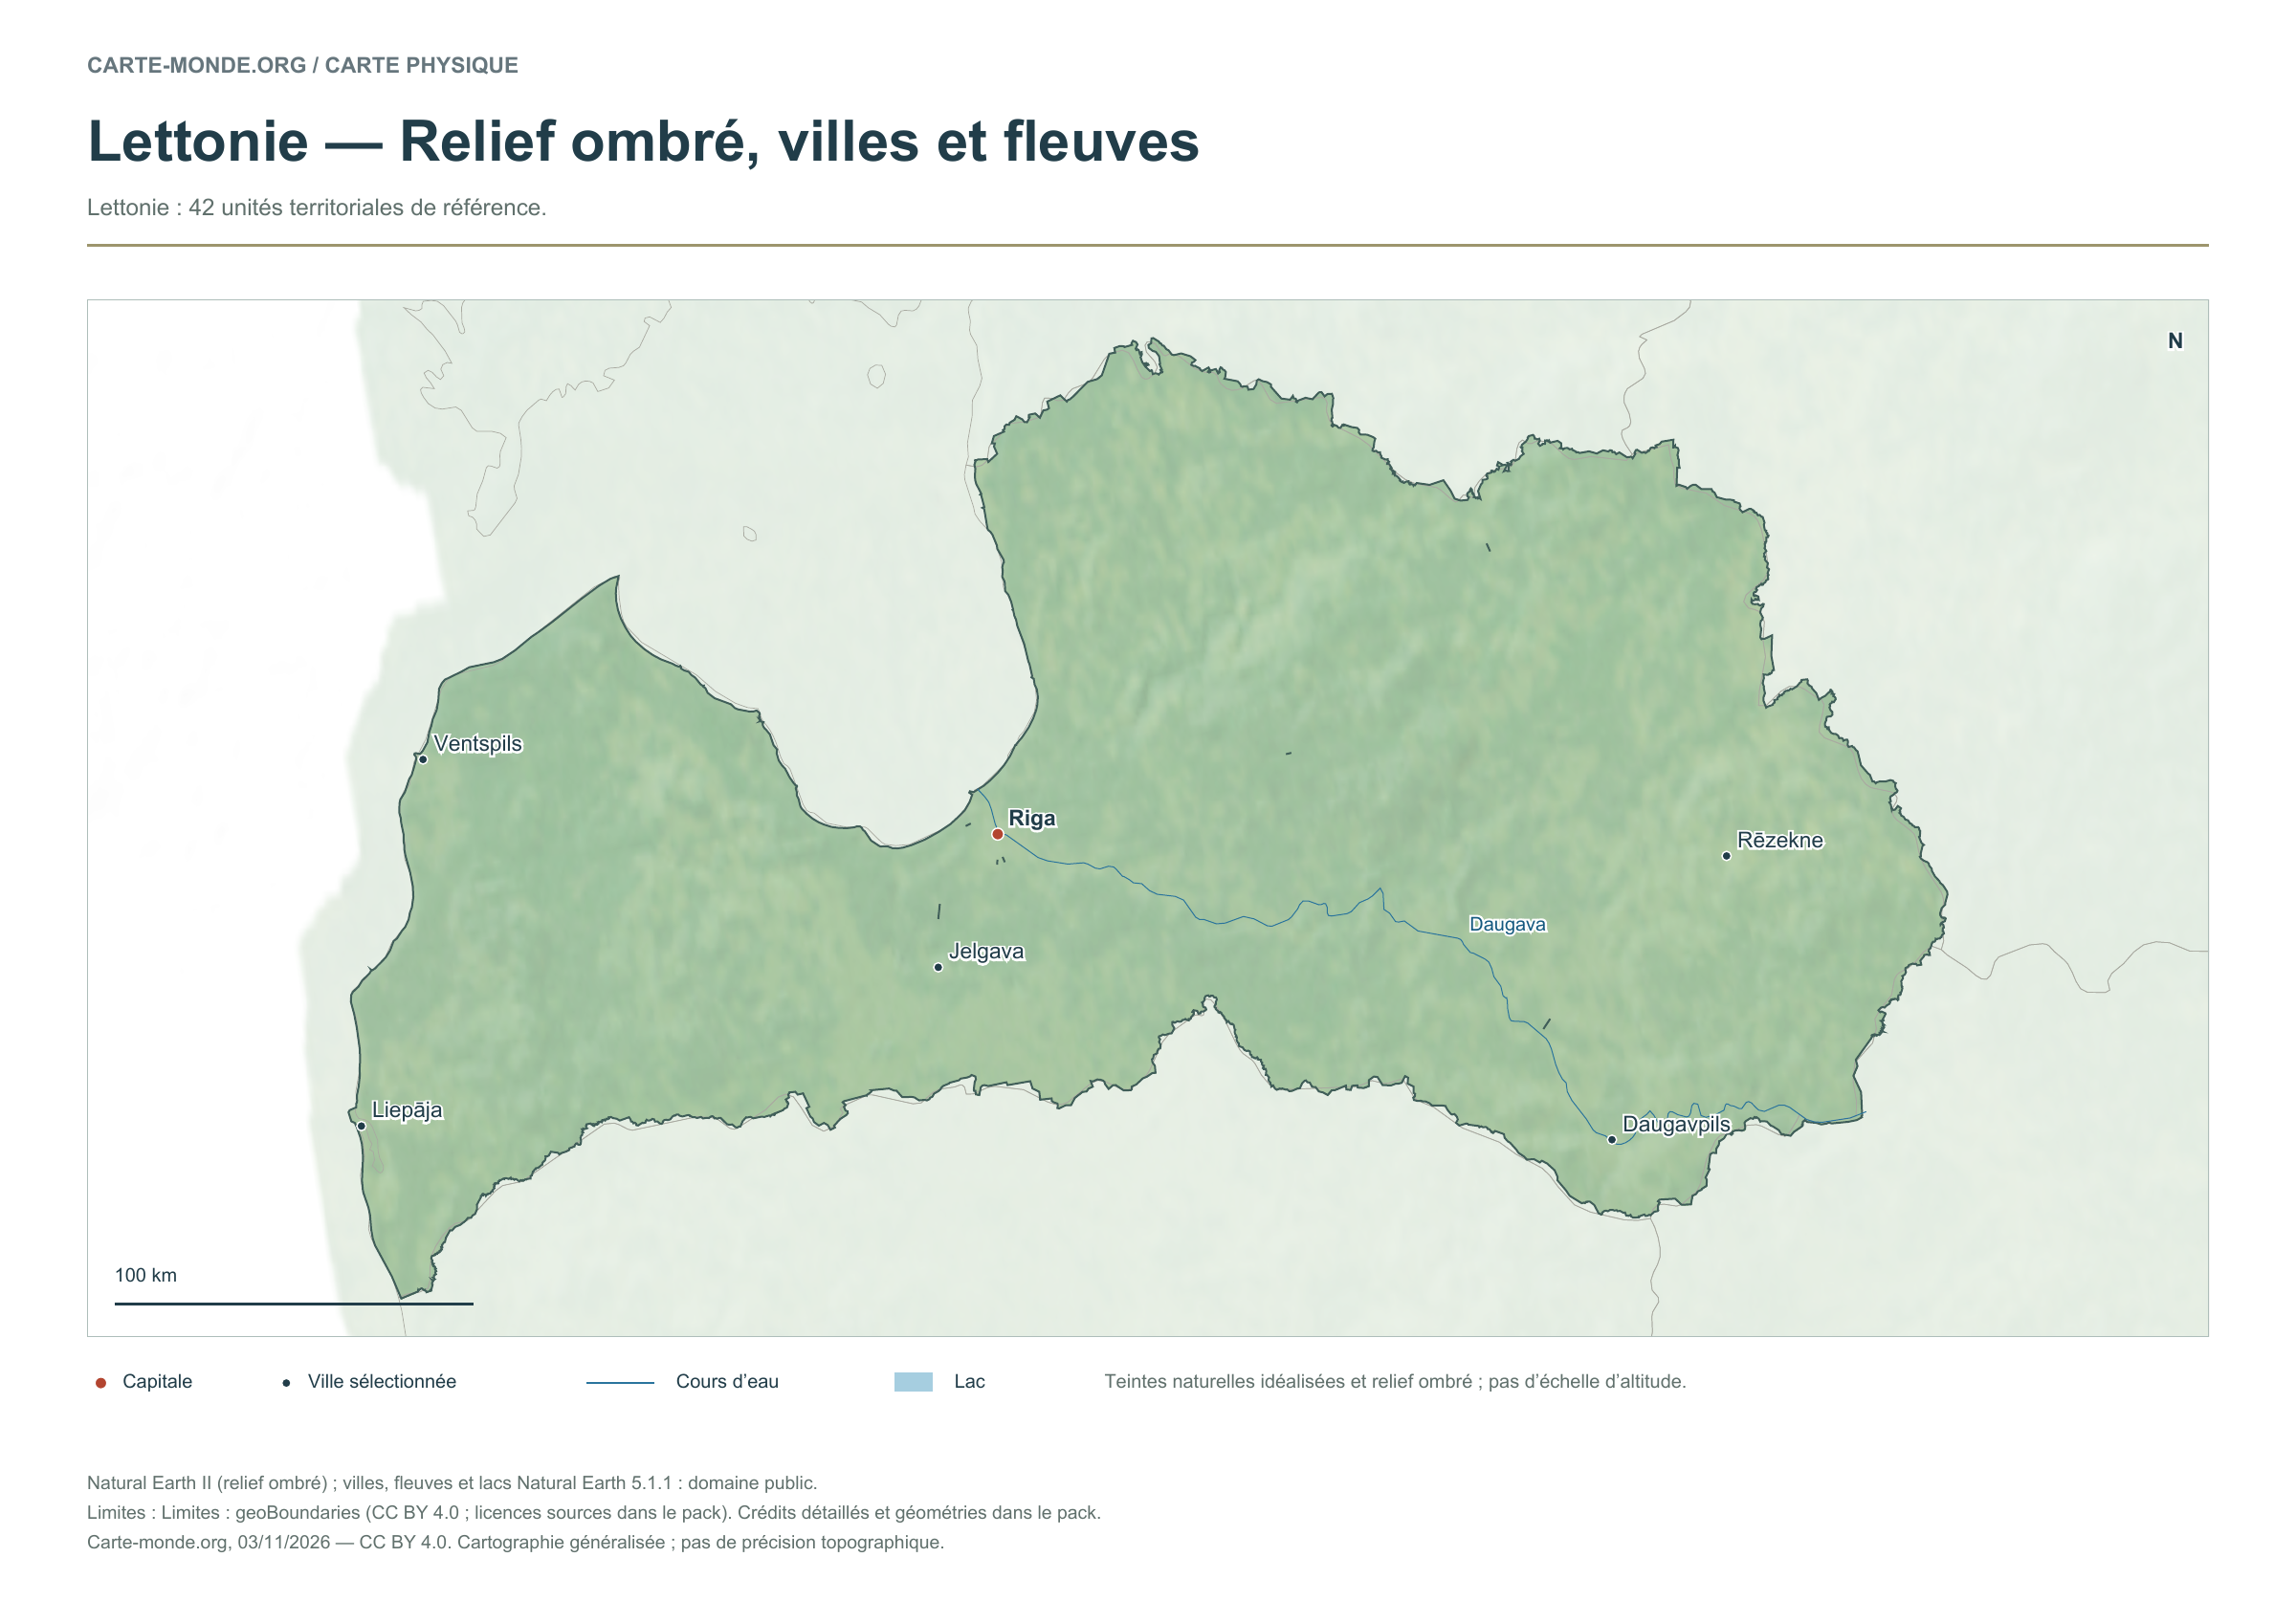
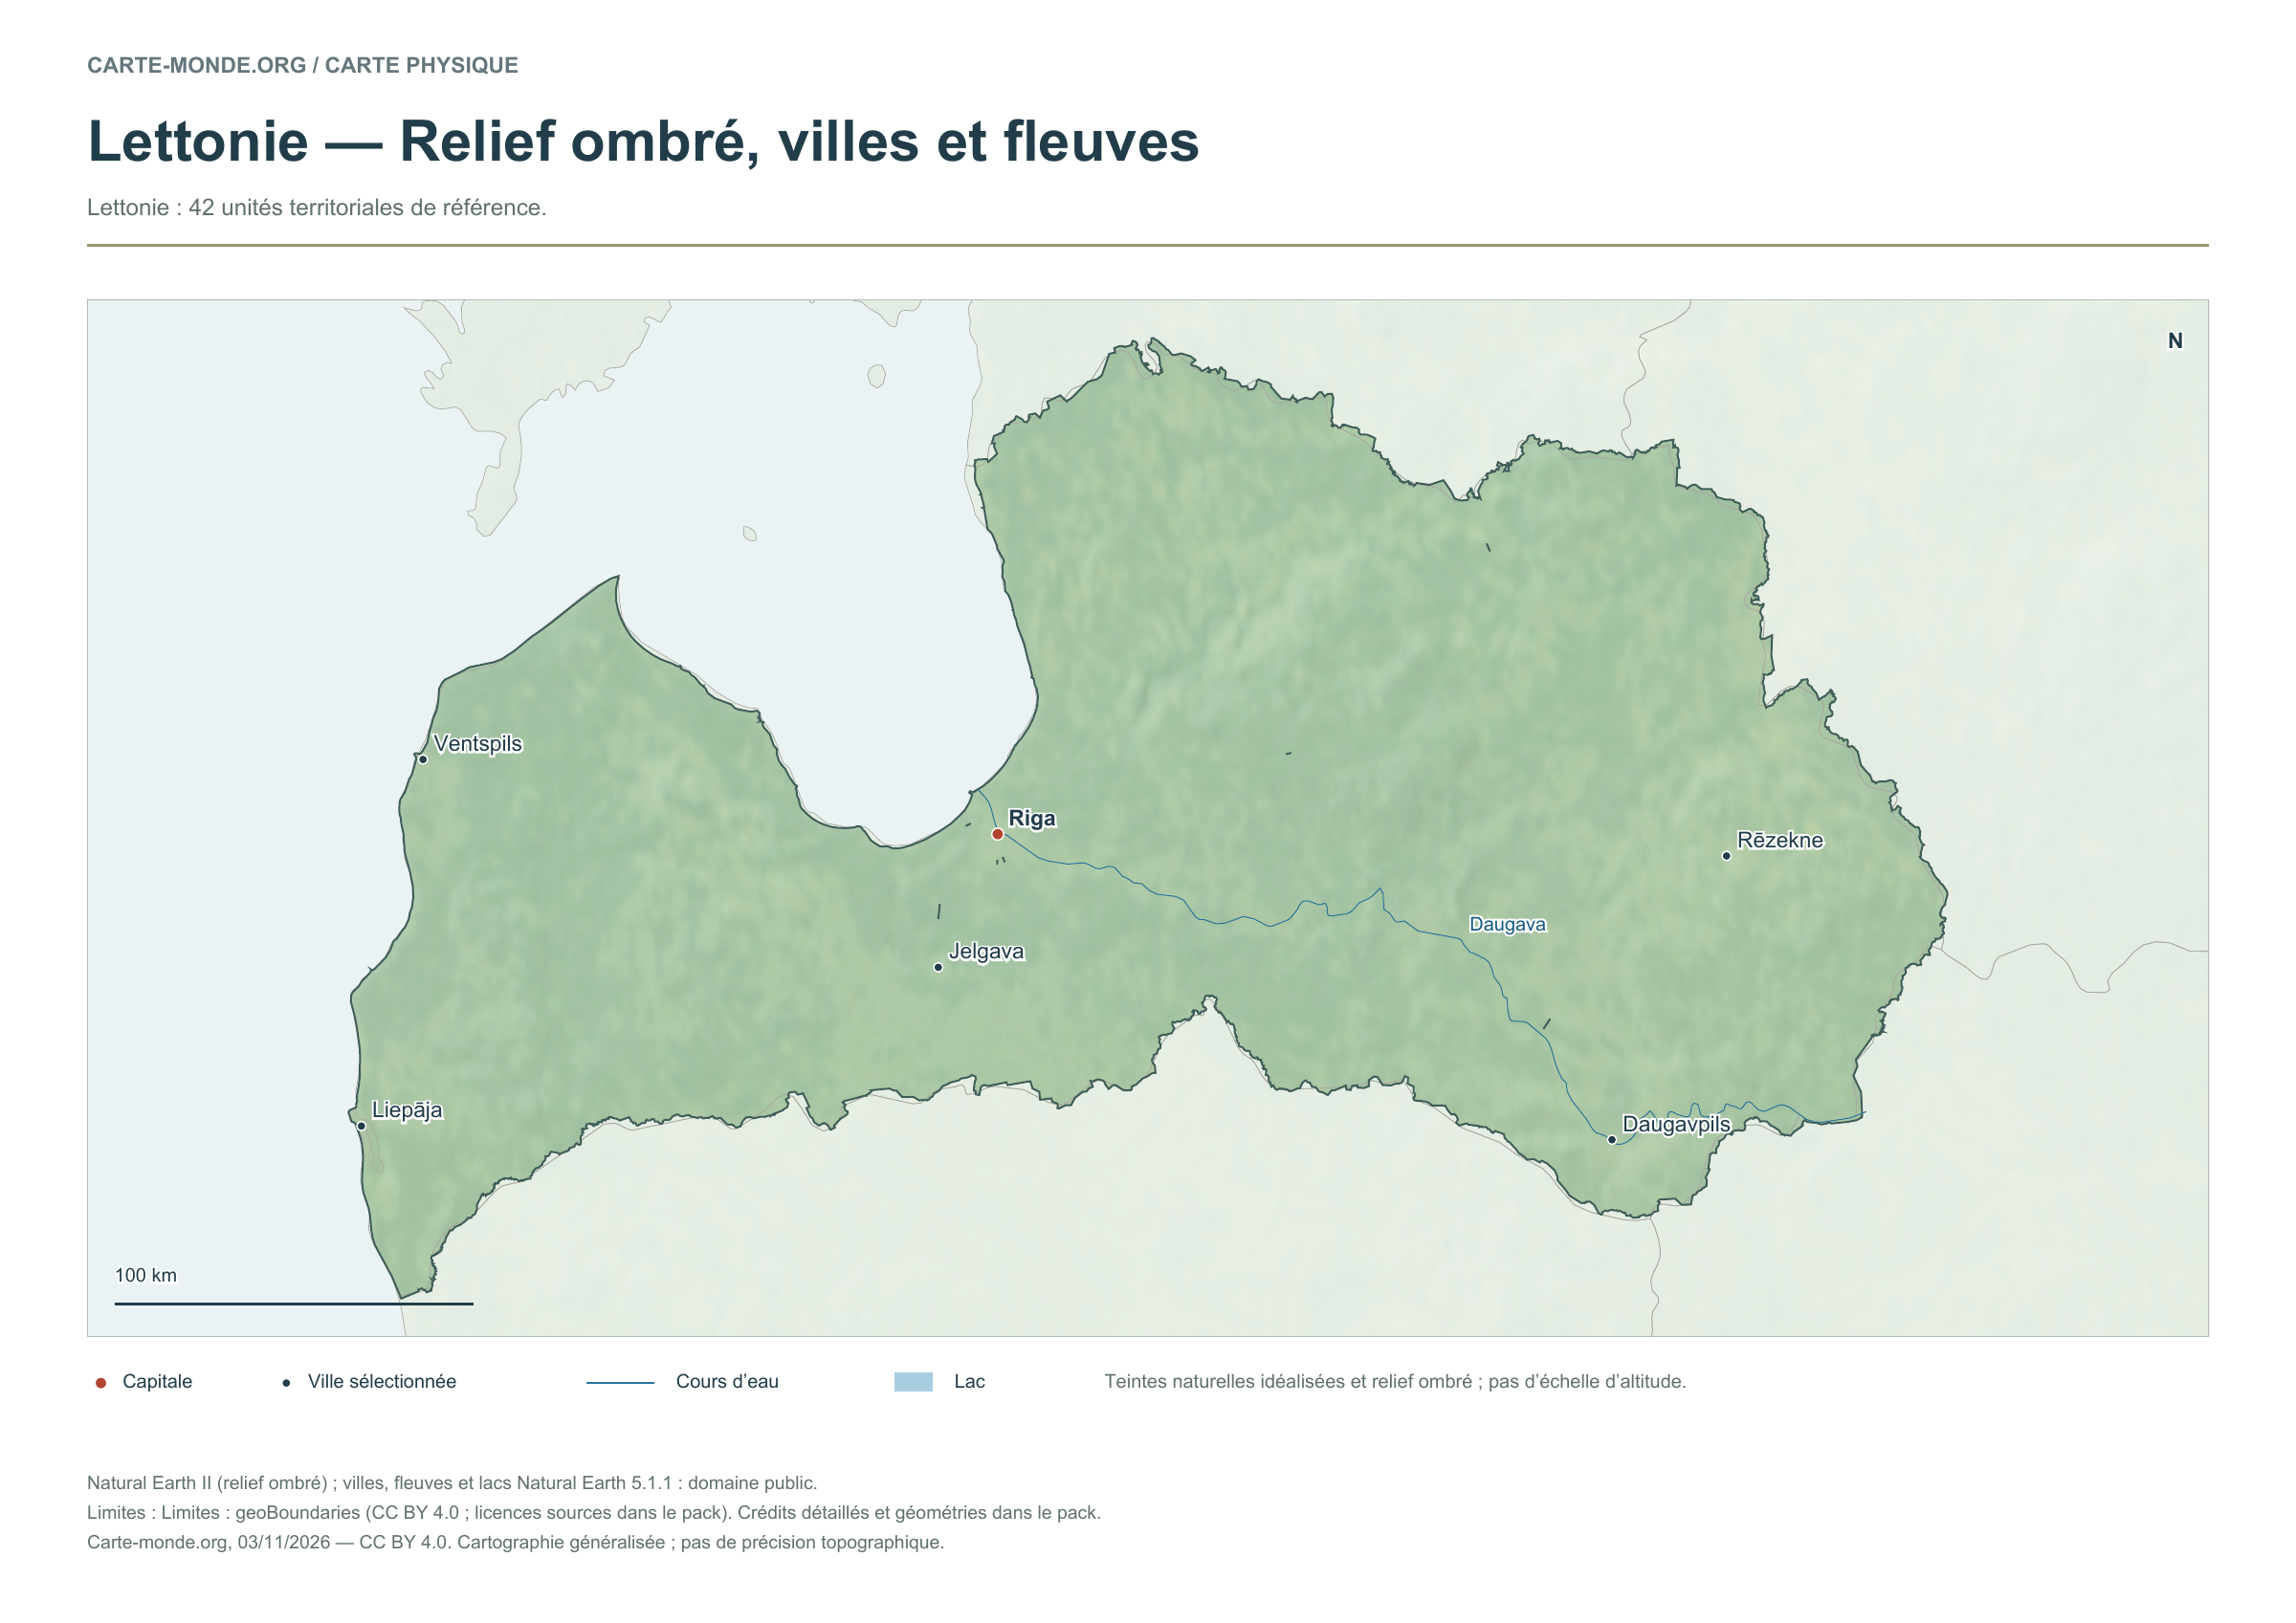
Latvia — Shaded relief, cities and rivers

Carte-monde.org · November 2026

Shaded relief, cities and rivers

To identify major landforms, cities and the river network. The natural colours are not an elevation scale.

Raster base map, cities, rivers and lakes: Natural Earth, public domain. Other boundary credits and licences are retained in the pack. Cartographic work CC BY 4.0; ODbL-derived data retains its licence. No topographic accuracy is claimed.

Territory, data and selection of names

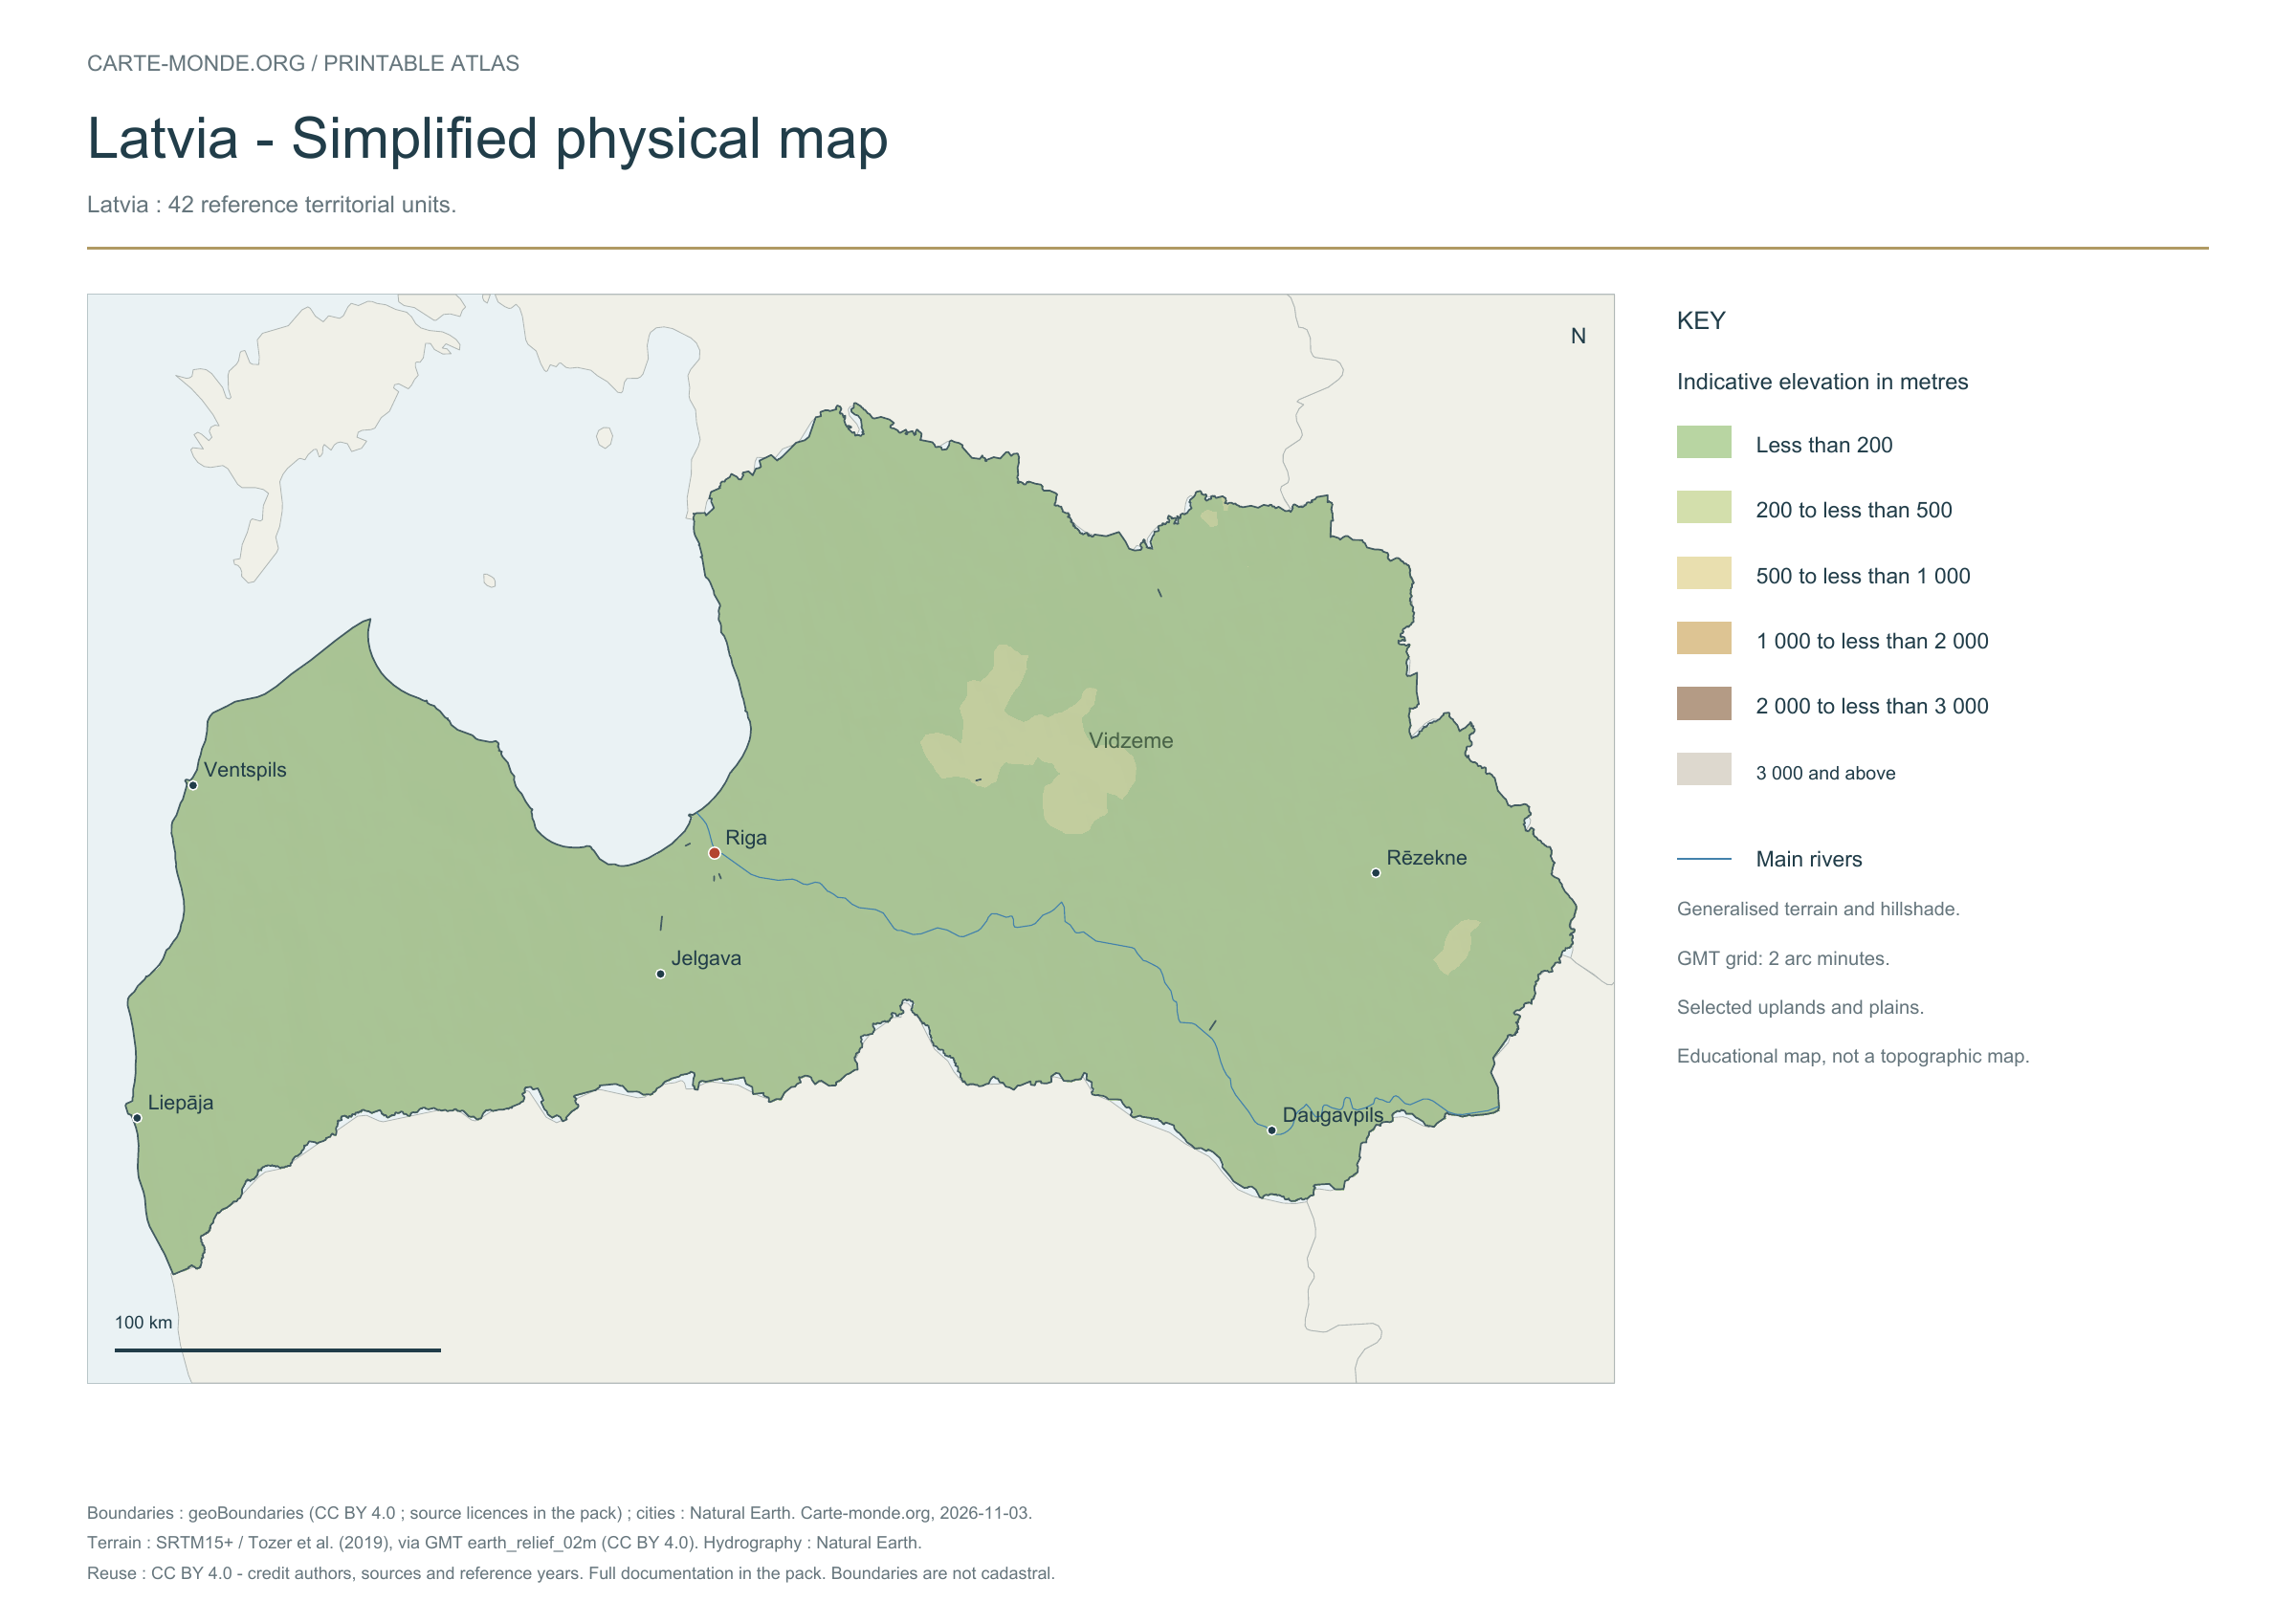
Latvia: 42 reference territorial units.

Natural Earth II shaded relief background, 6 selected cities. Named rivers: Daugava.

The colours represent idealised natural cover; they do not correspond to elevation classes. This global background remains generalised, particularly for small states.

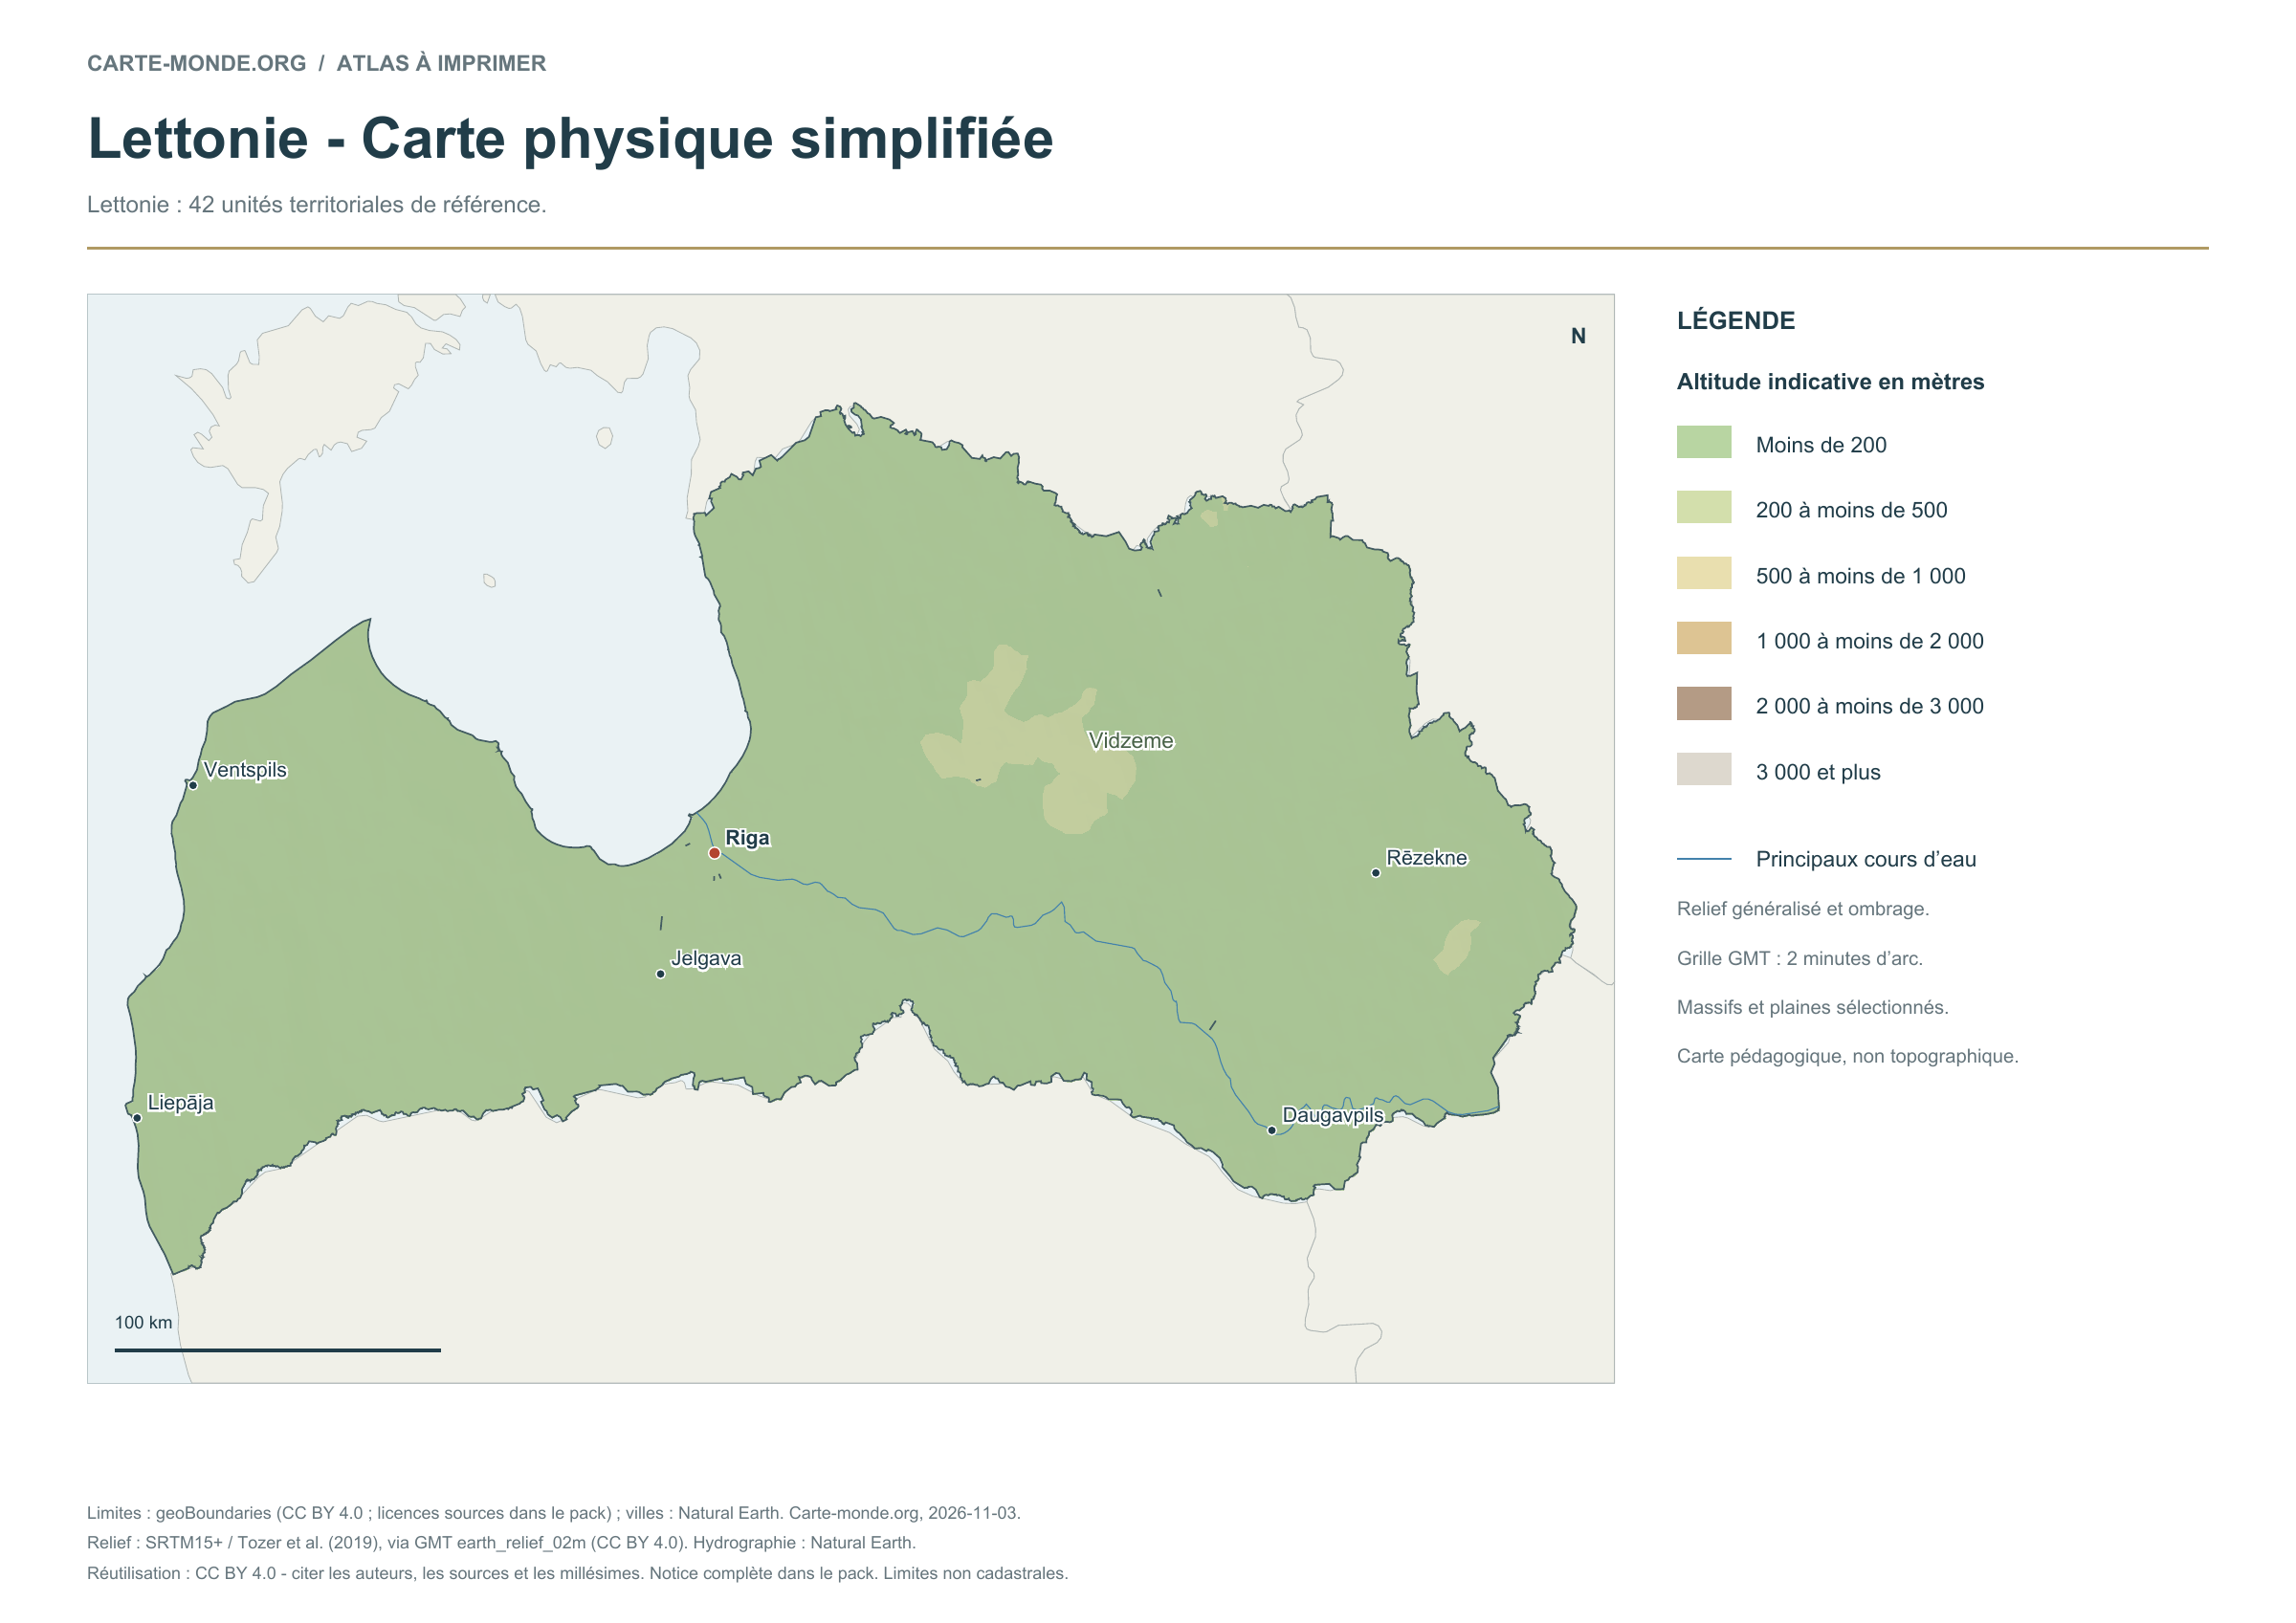
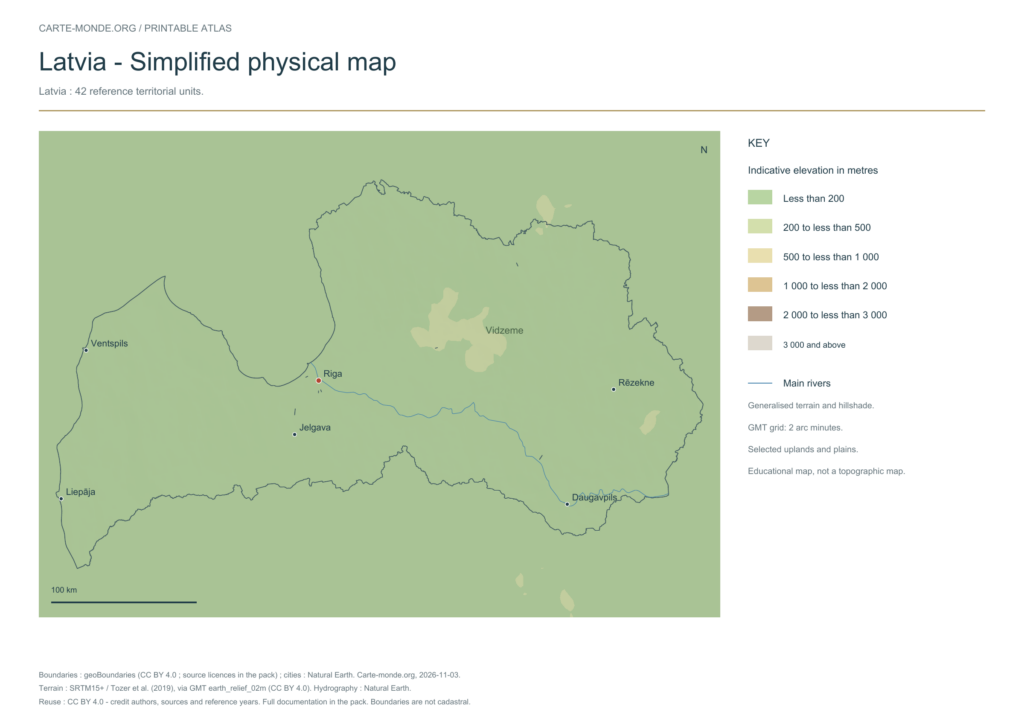
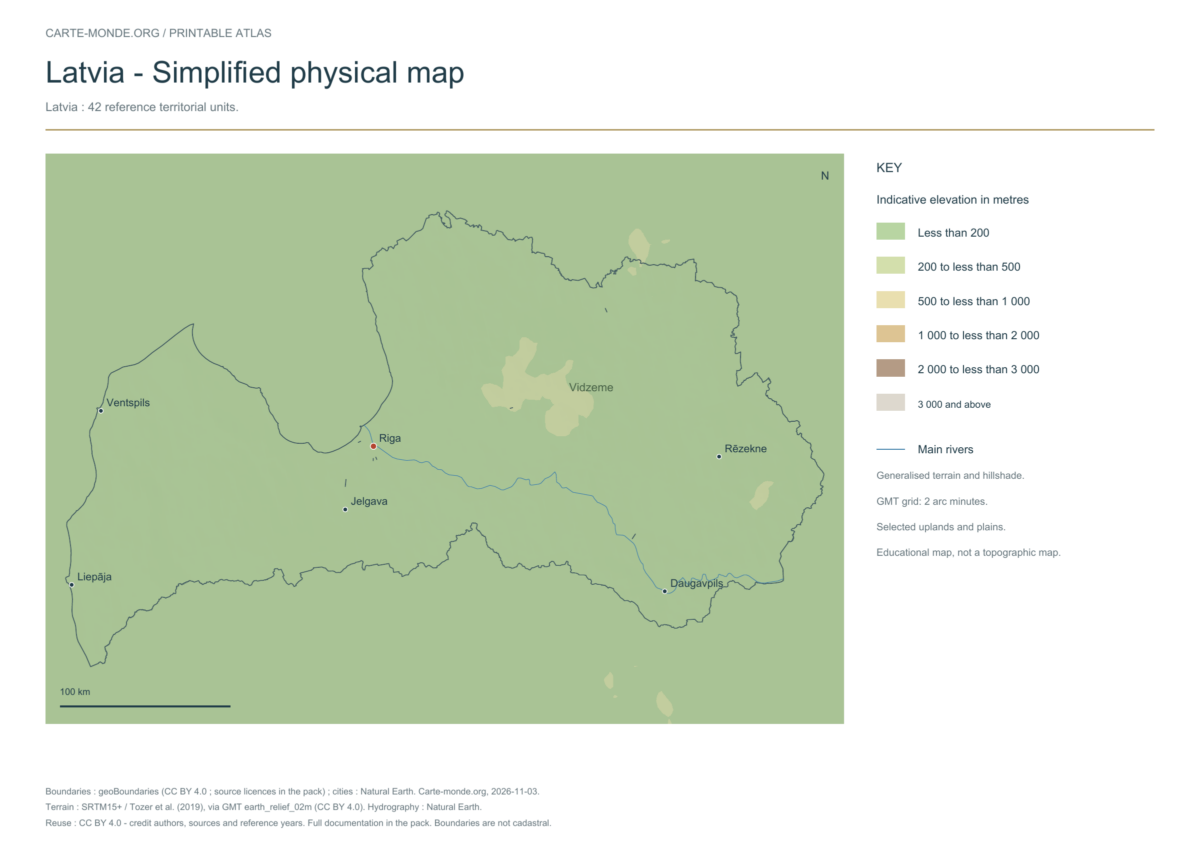
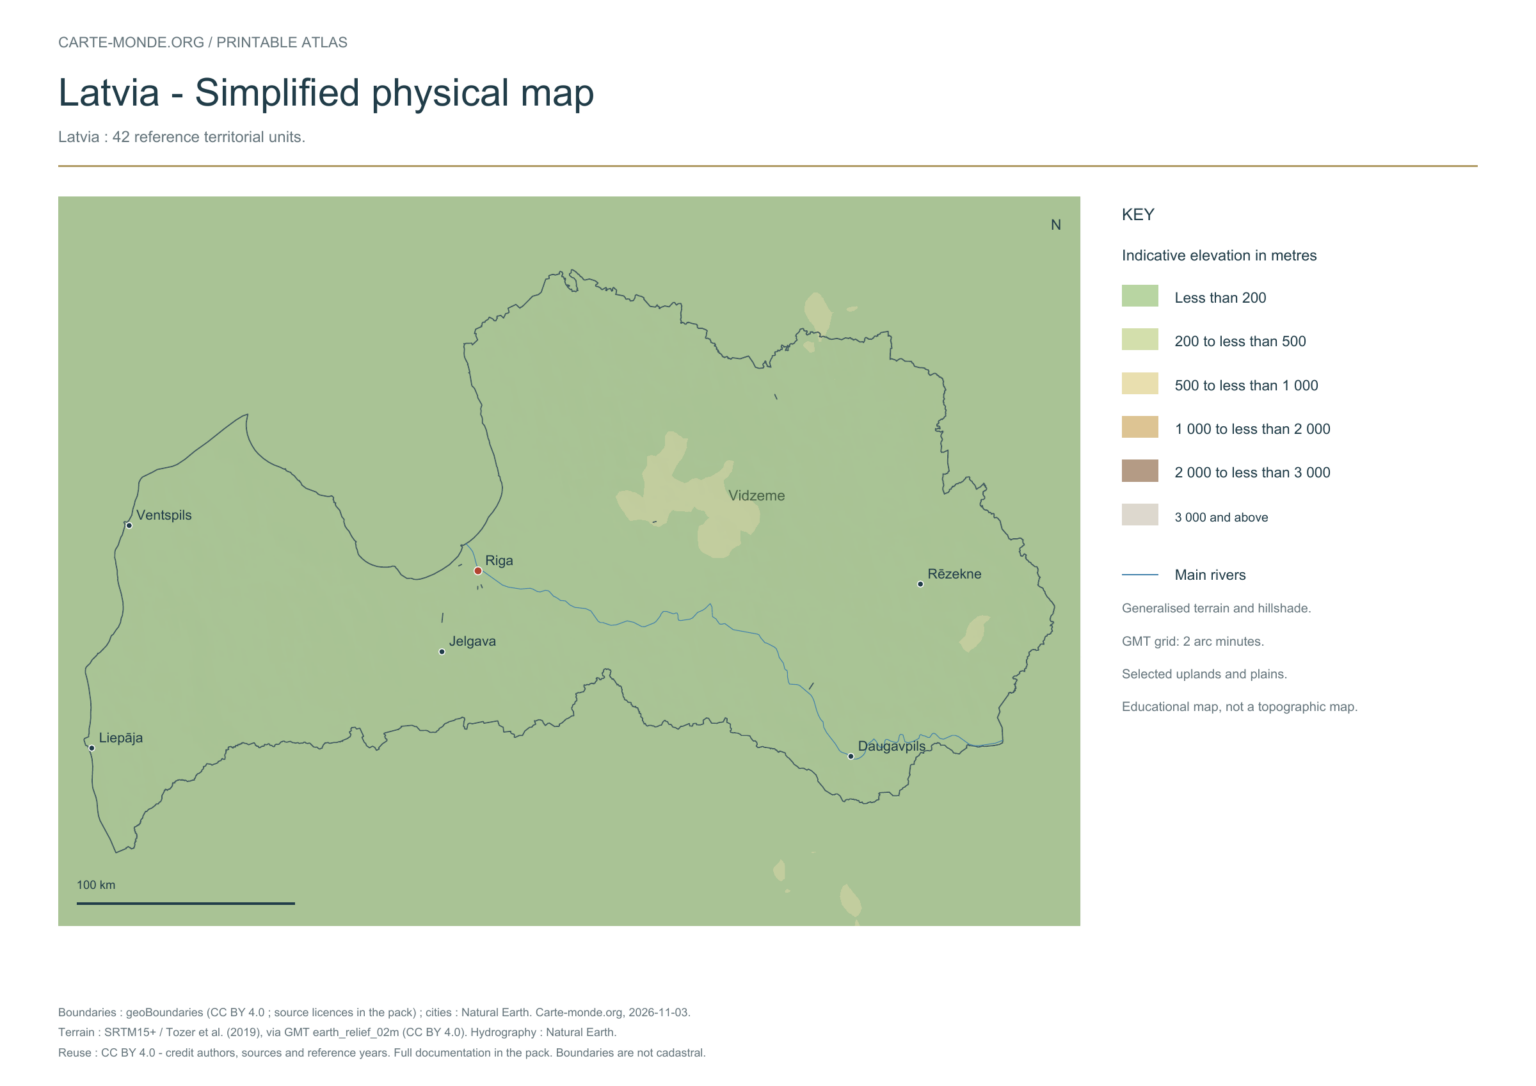
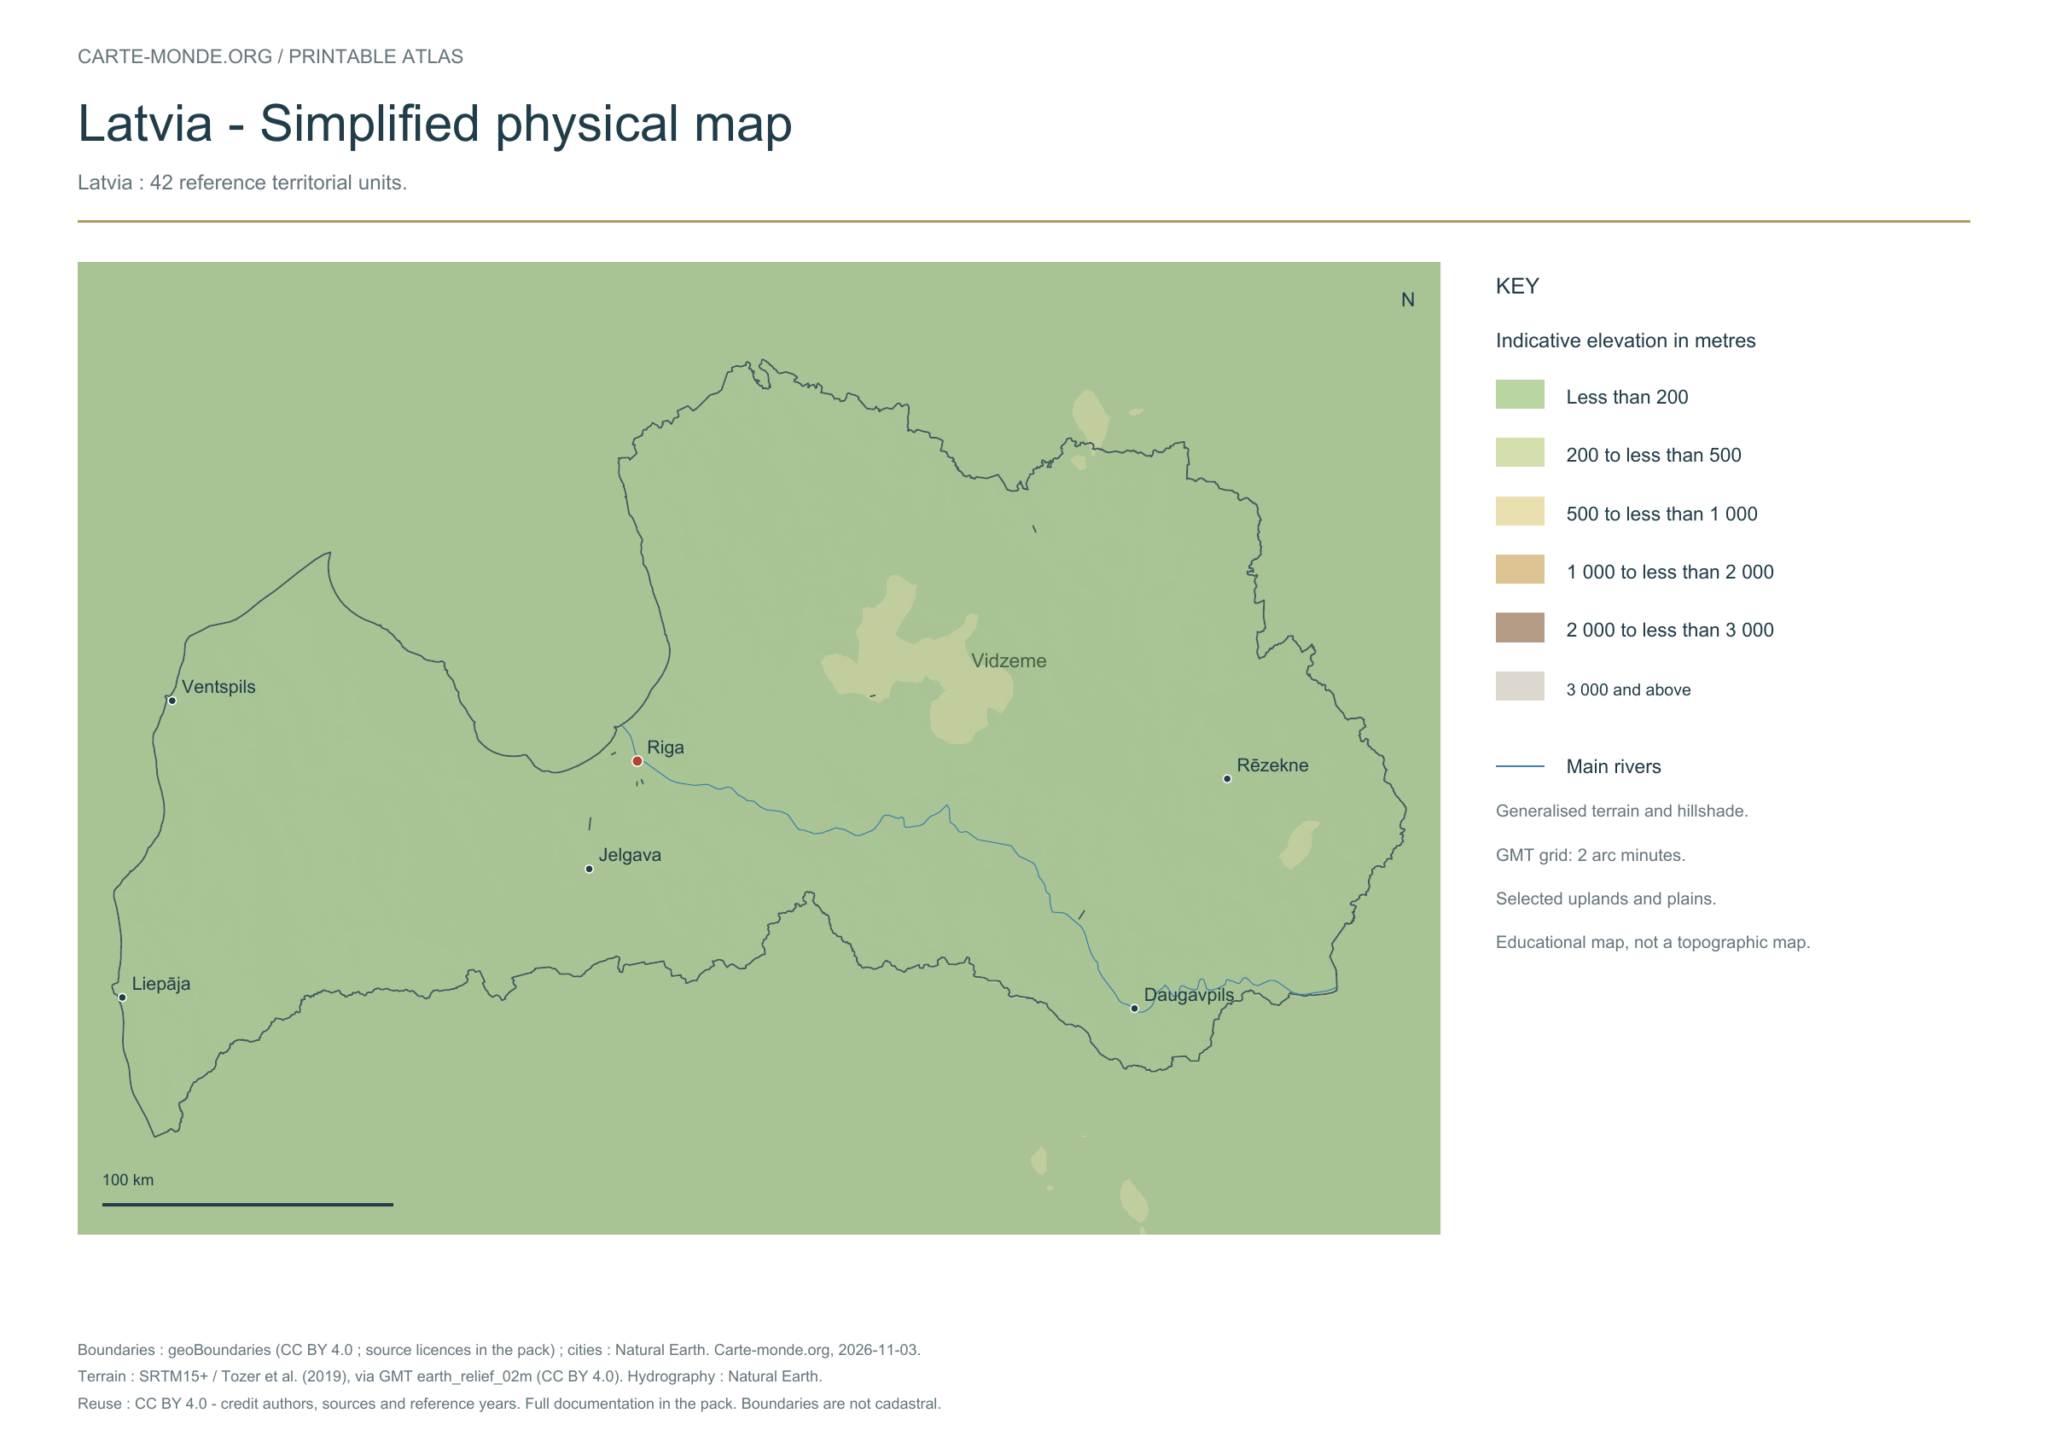
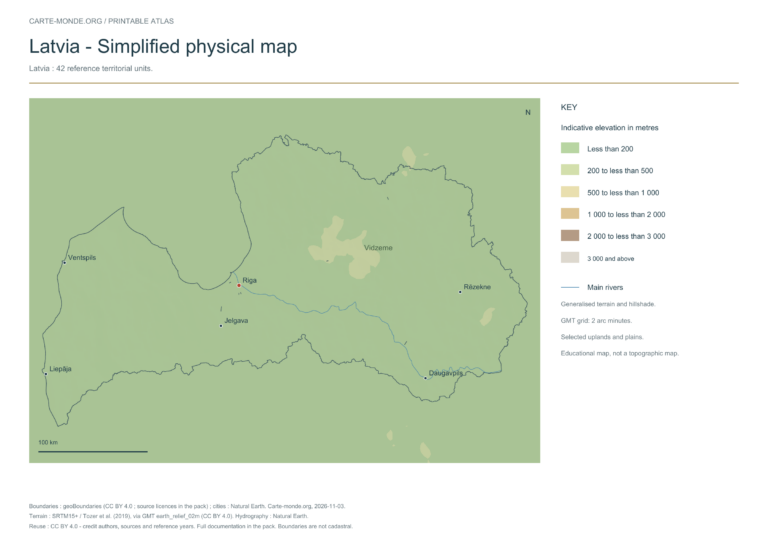
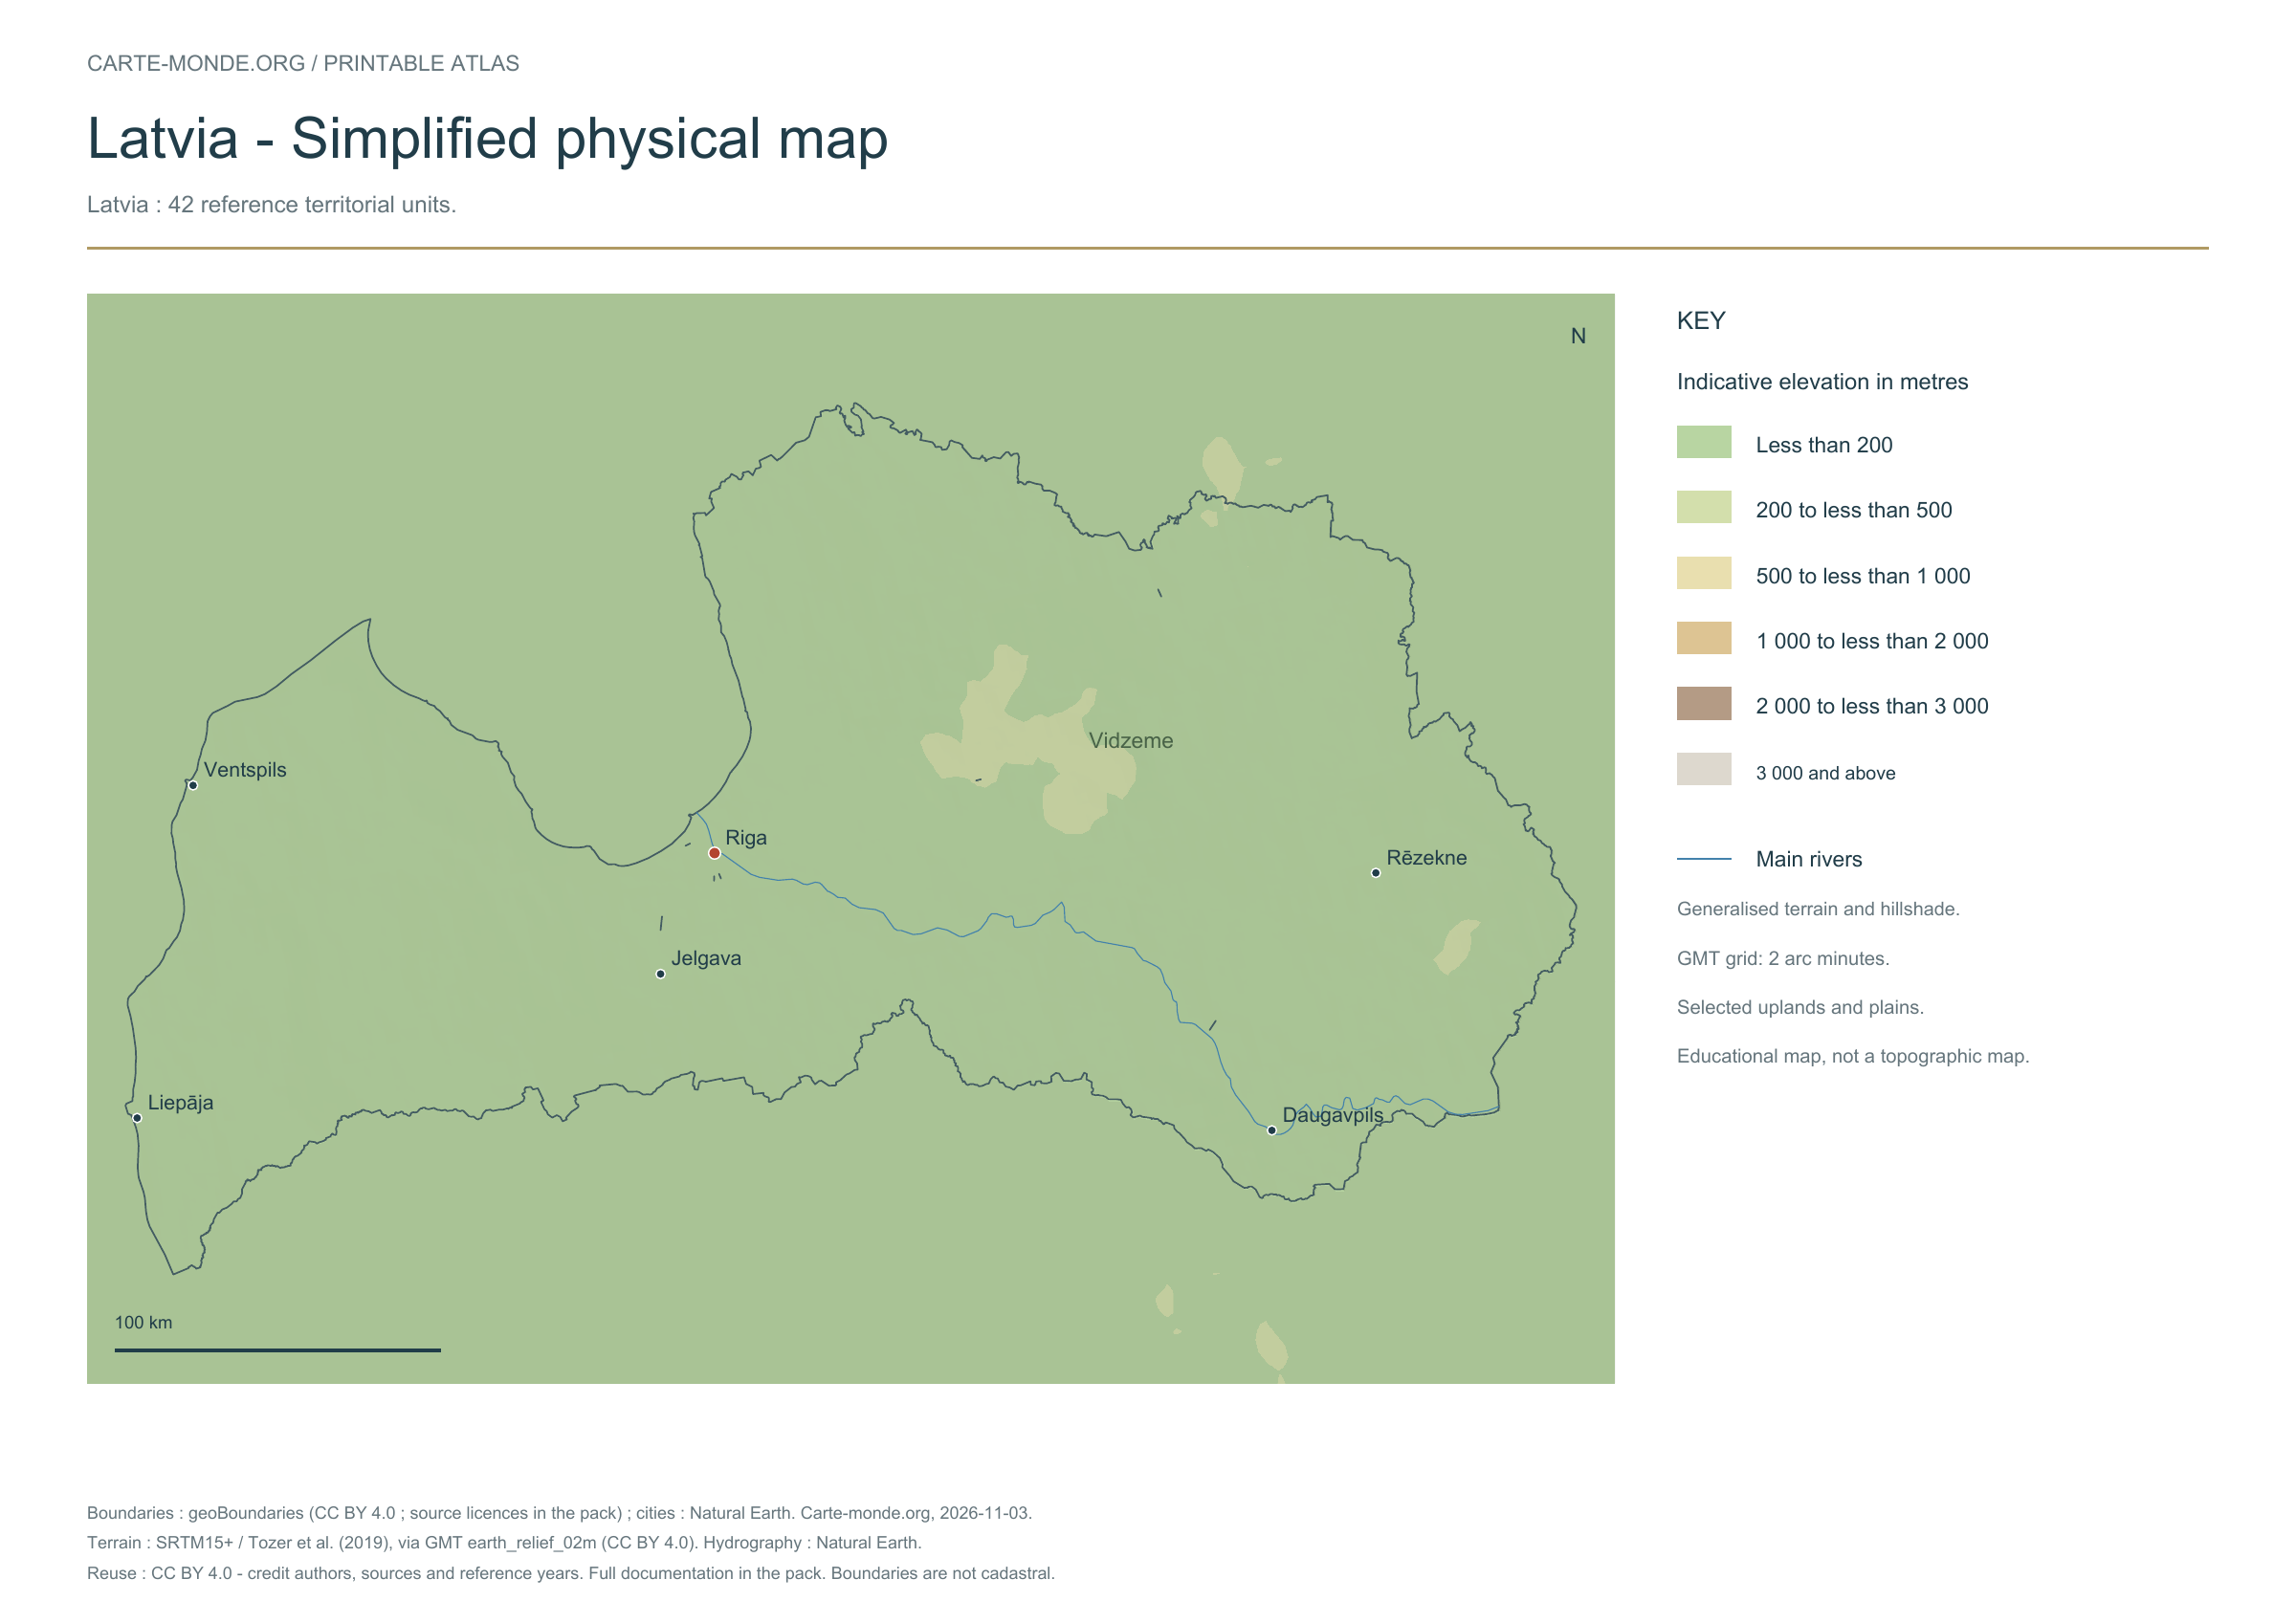
Simplified physical map — Latvia

Carte-monde.org · November 2026

Simplified elevations

Smoothed relief, elevation colours, main mountain ranges, plains and watercourses. Educational map at national scale.

A4 landscape PDF · PNG 2 400 px · CC BY 4.0

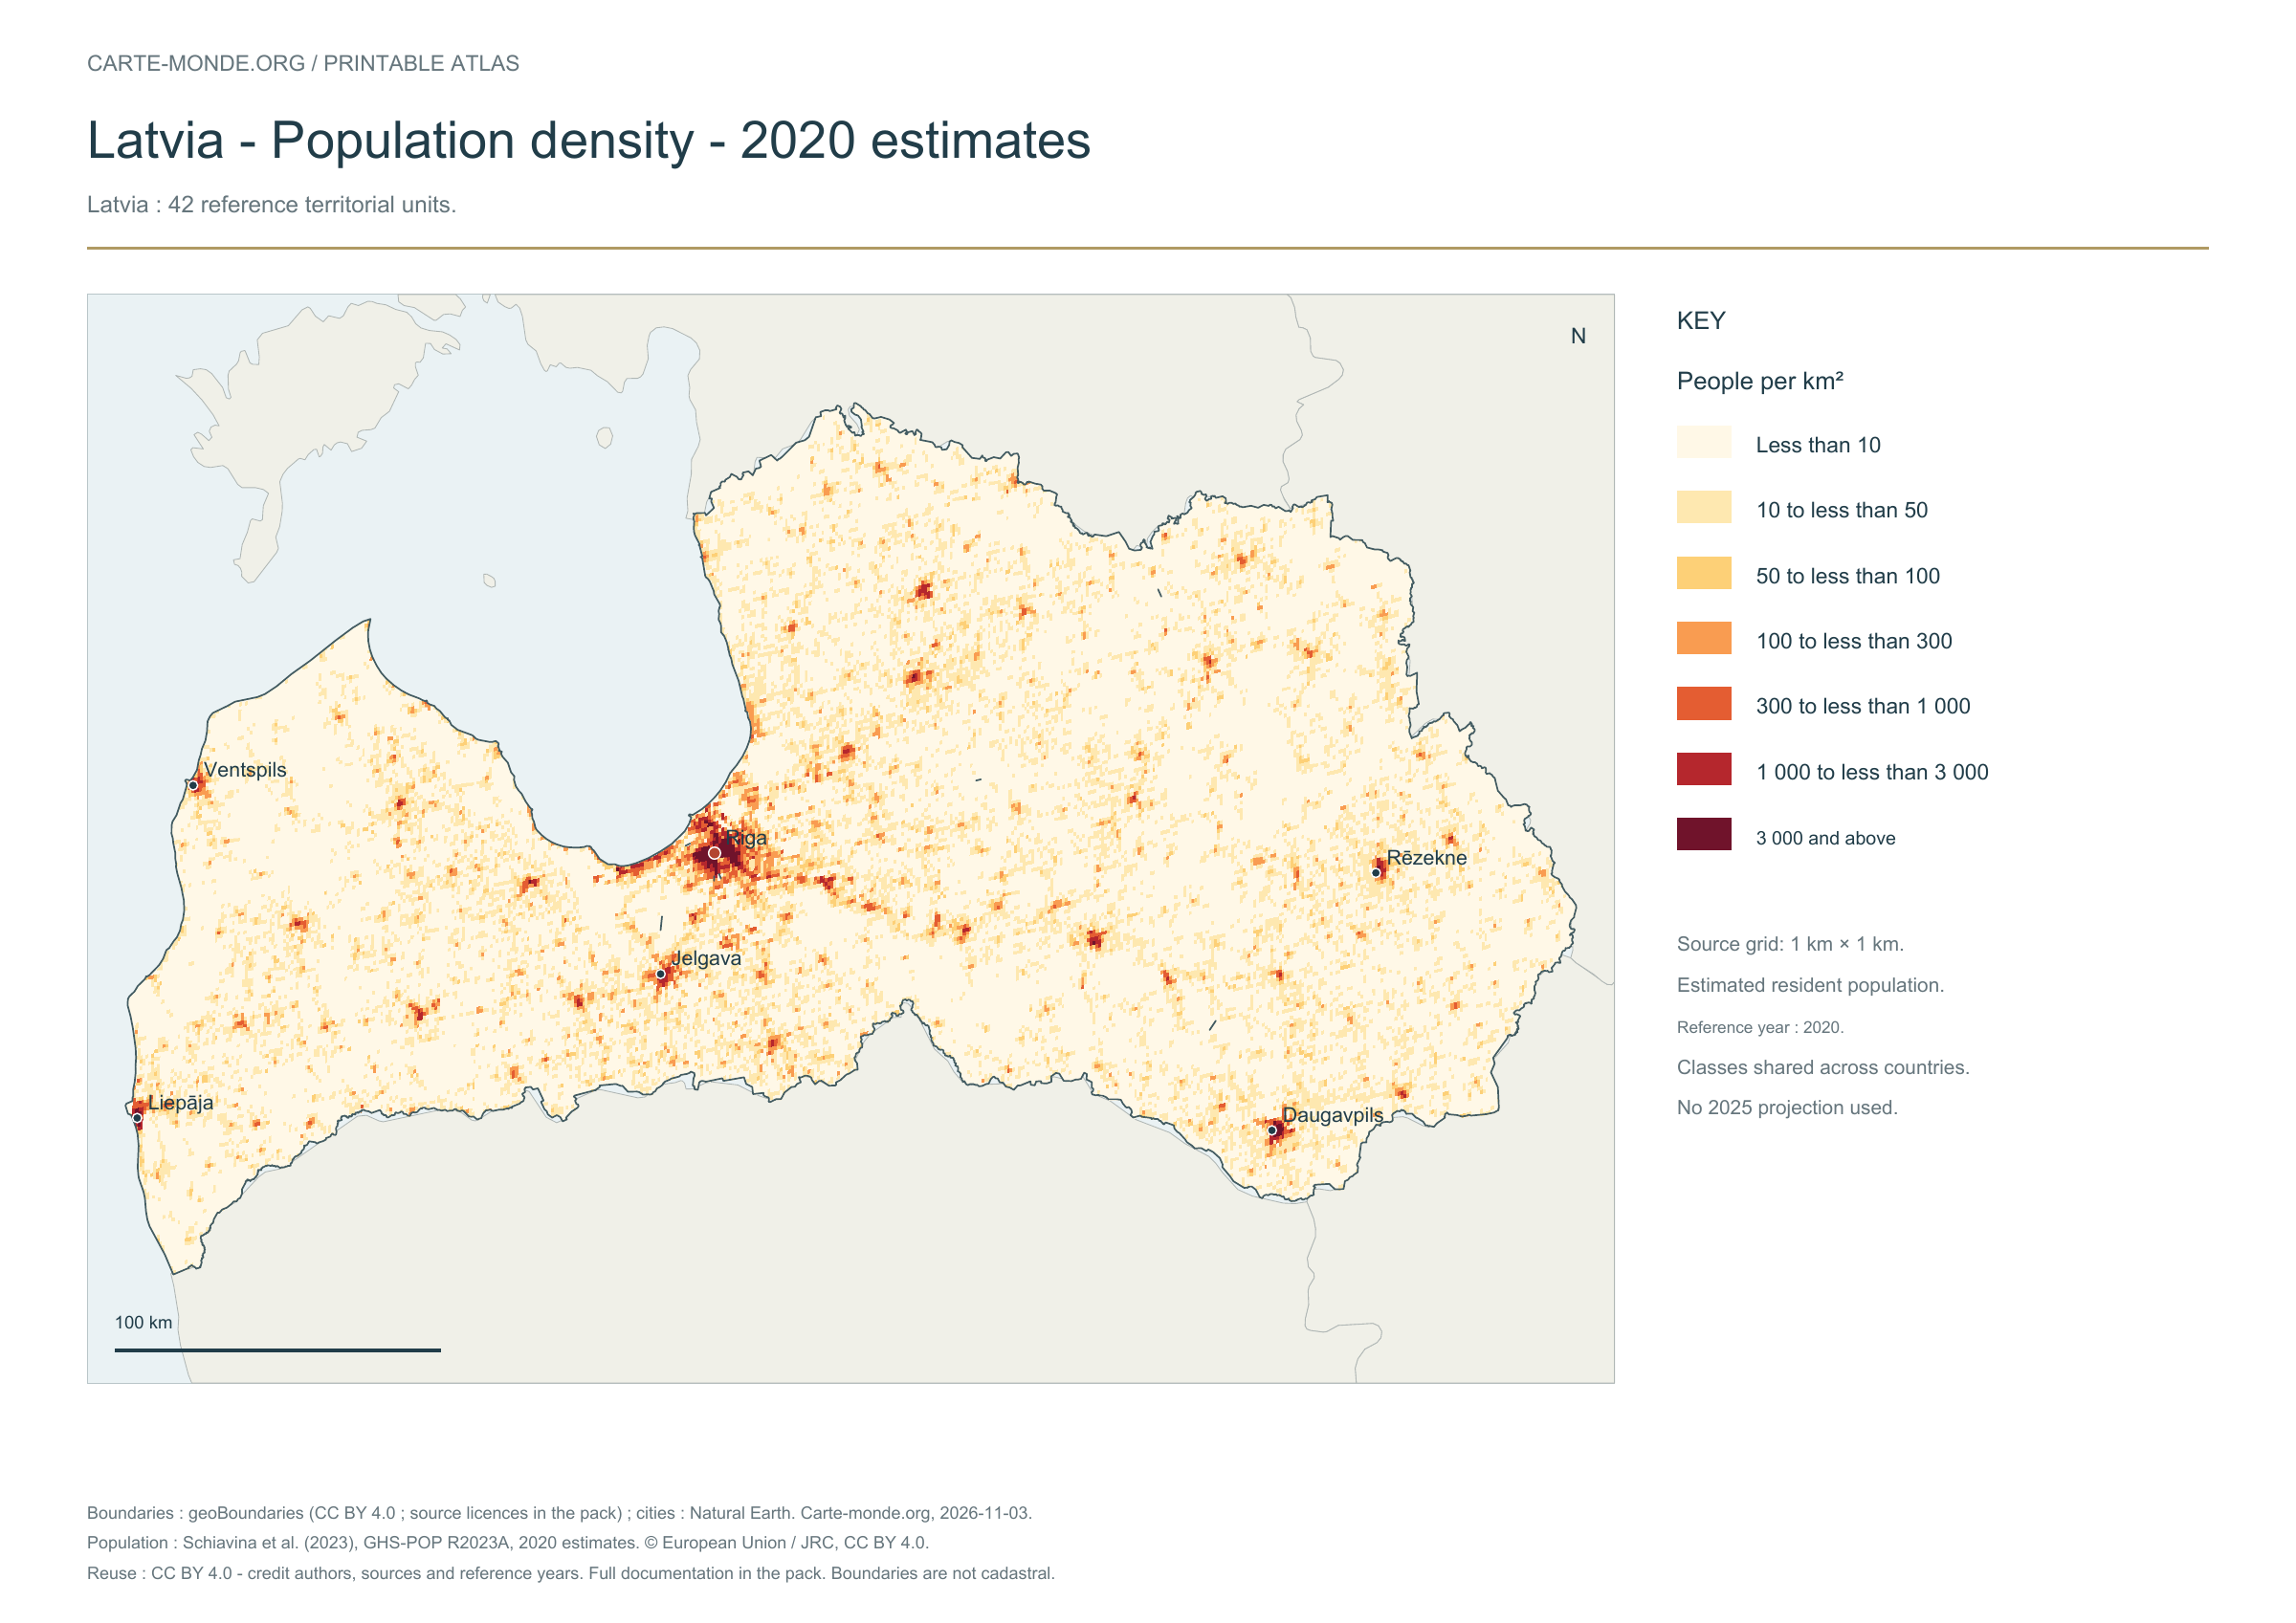
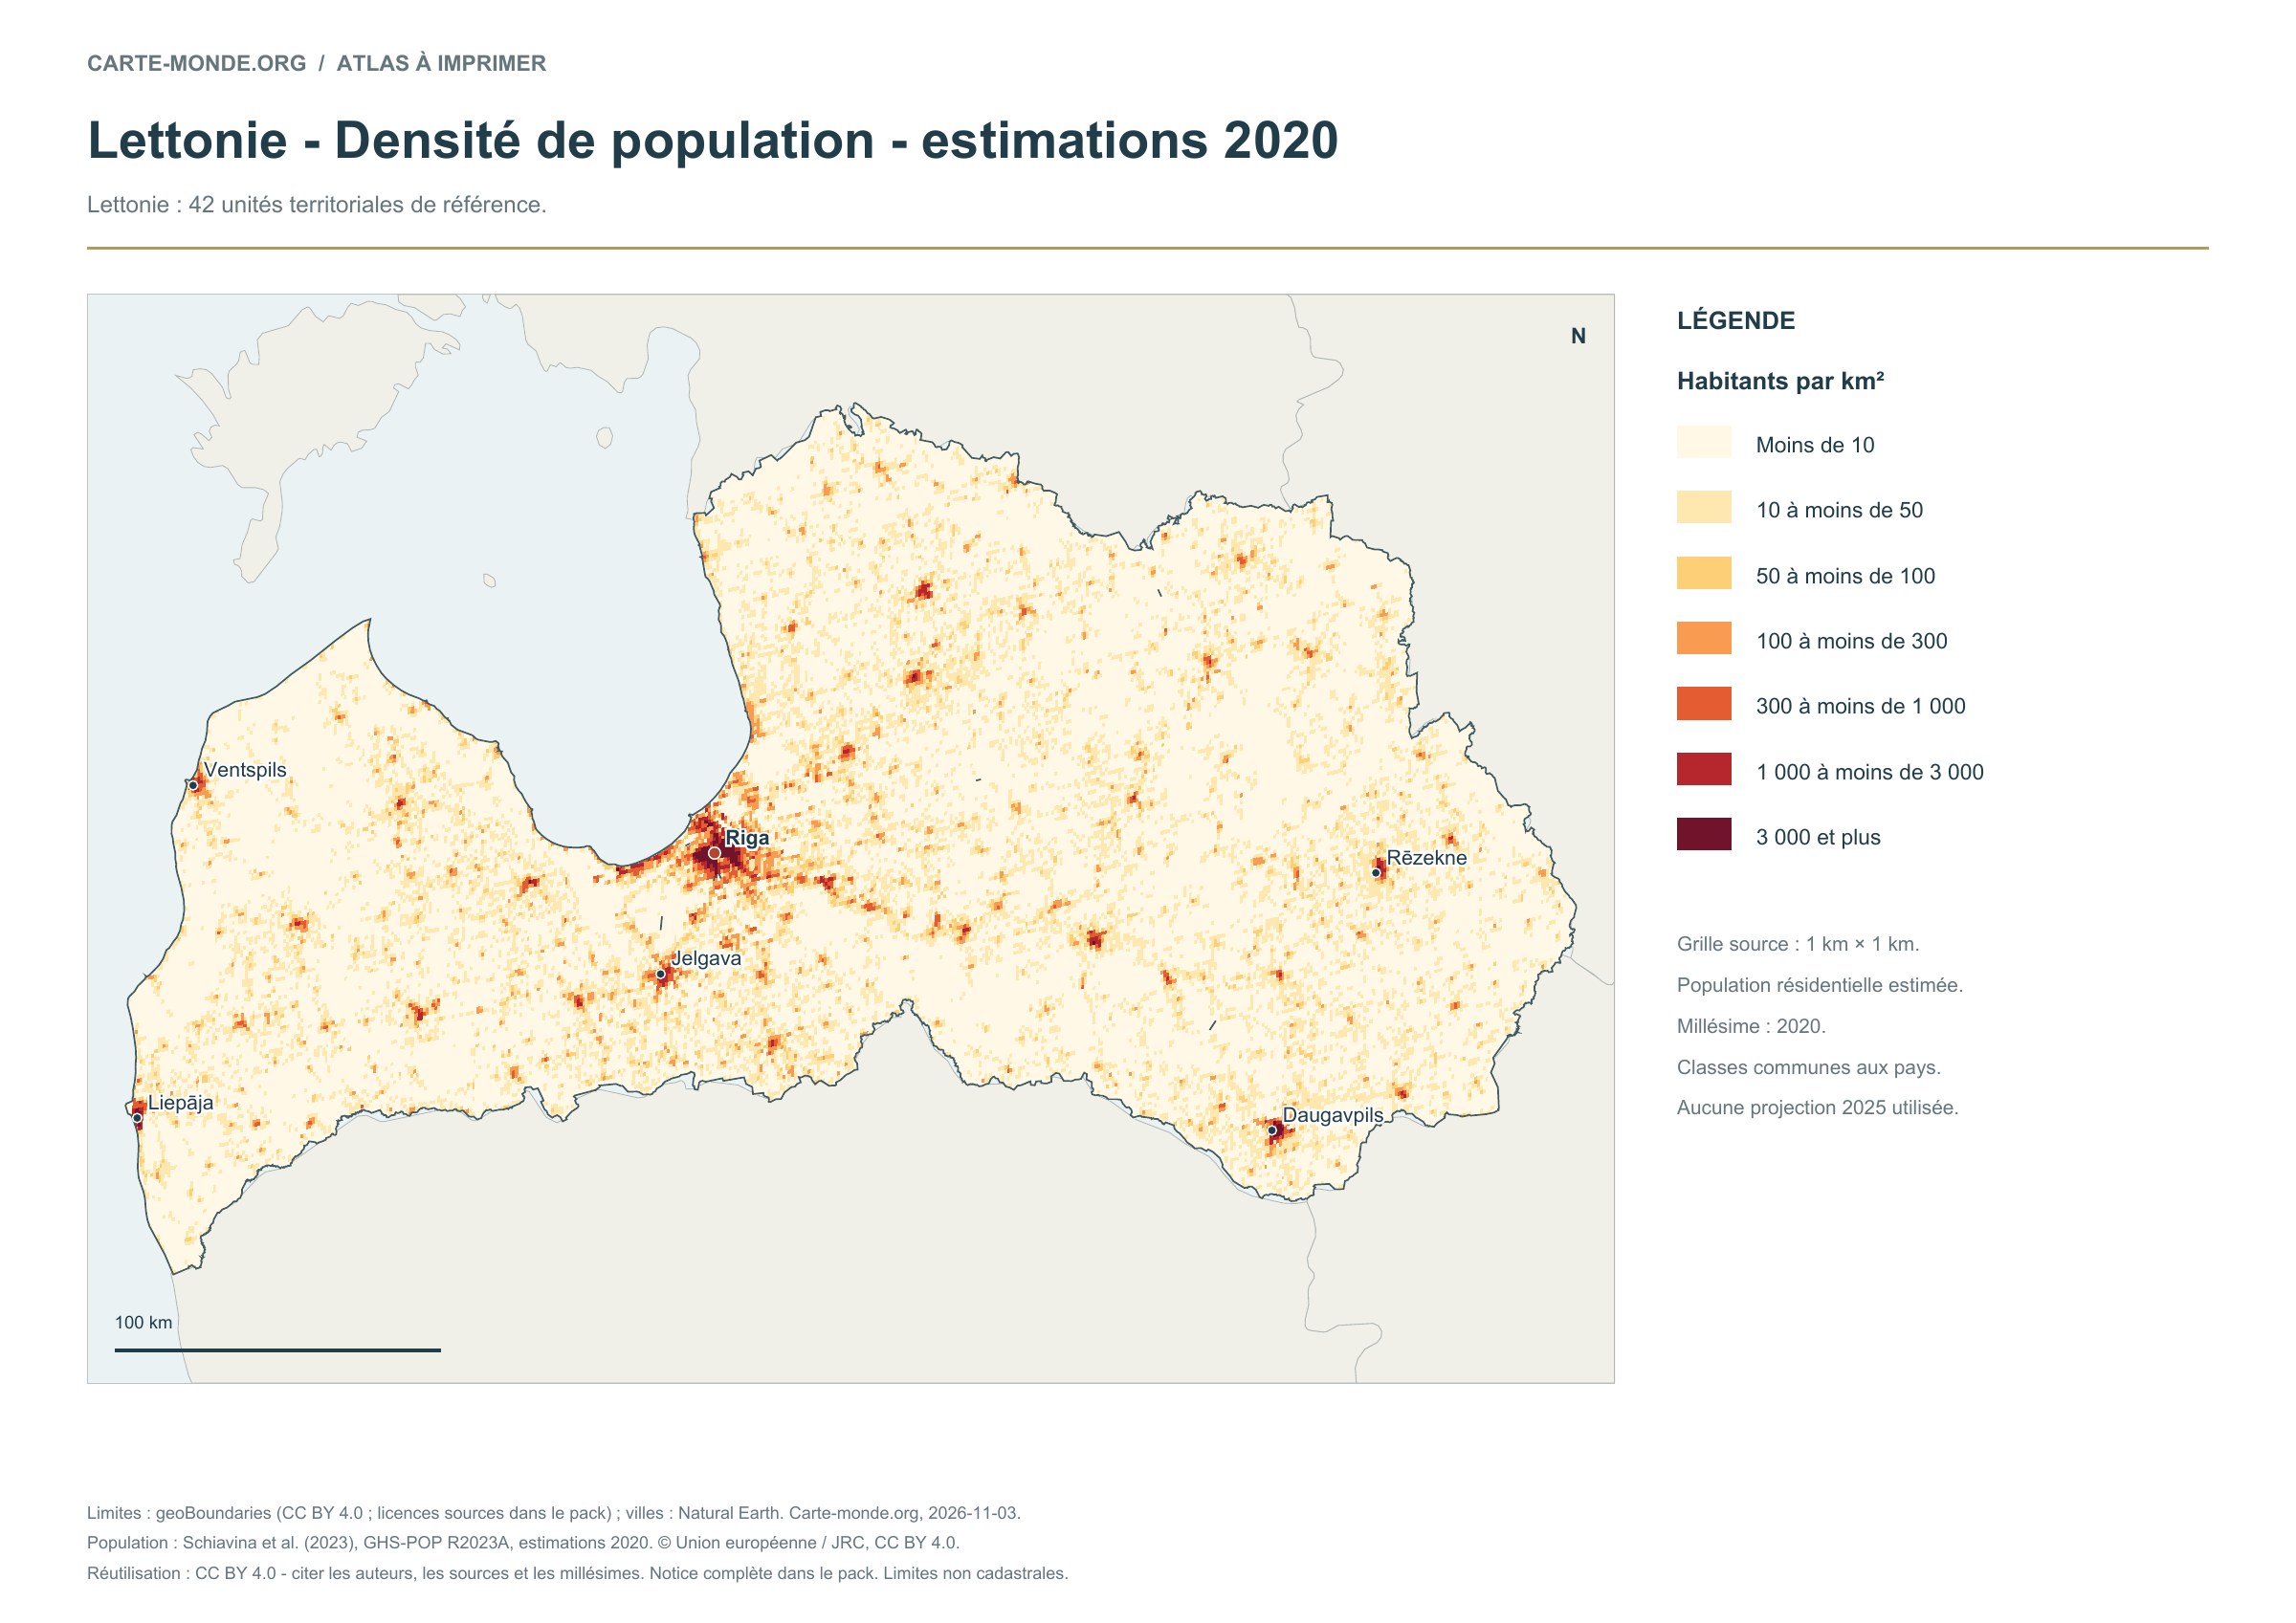
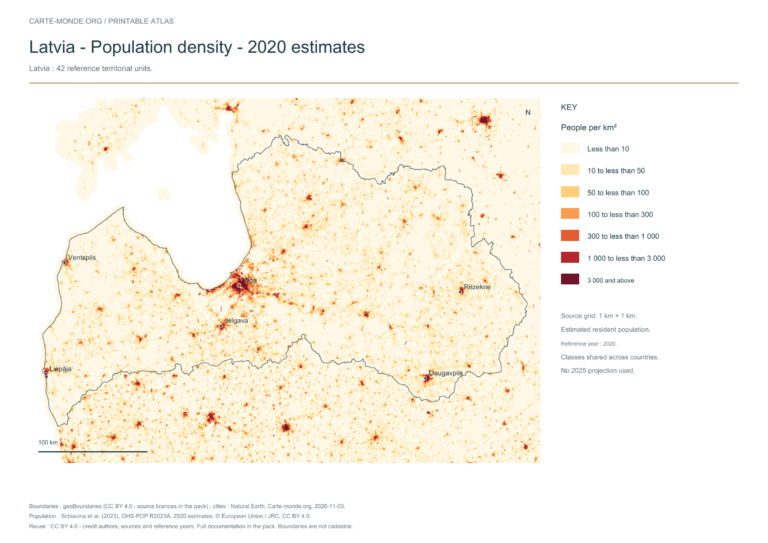
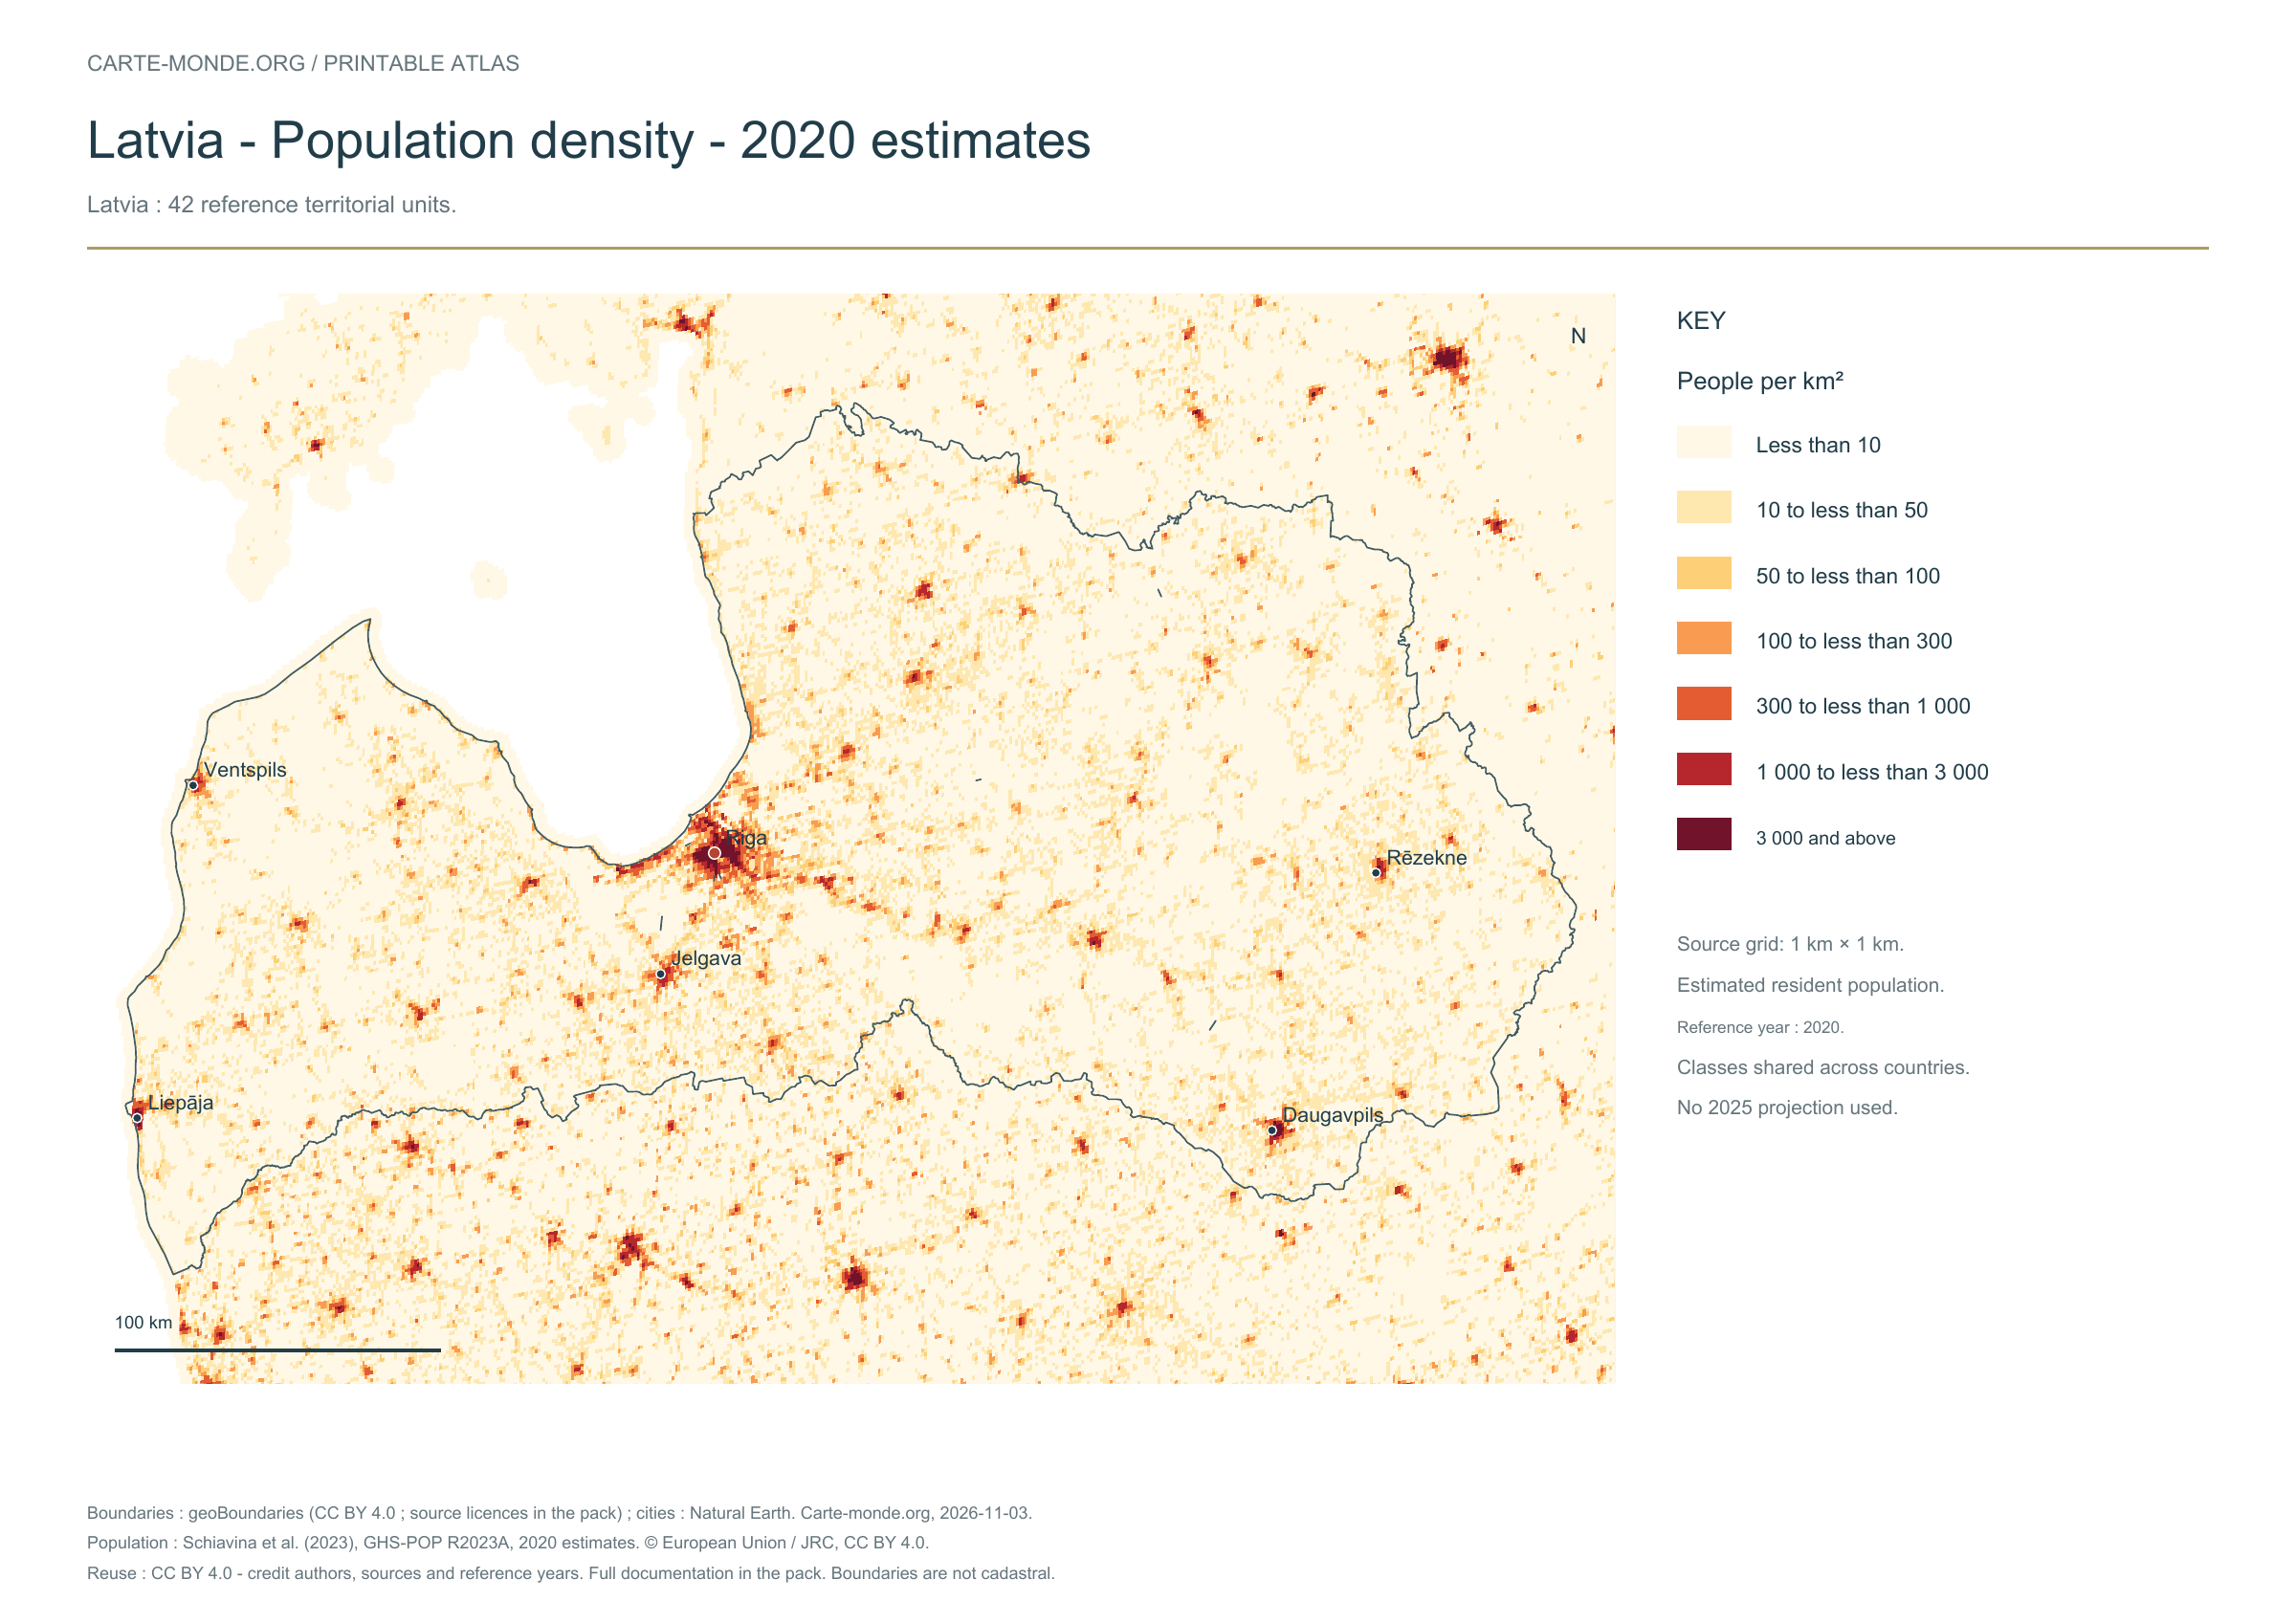
Population density: 2020 estimates

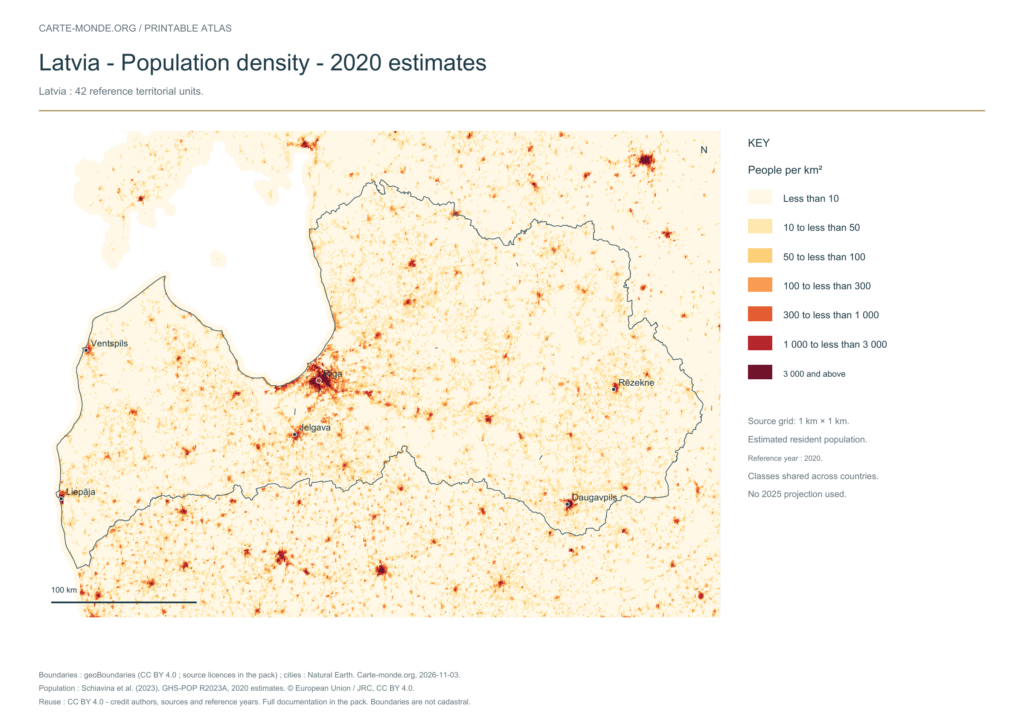
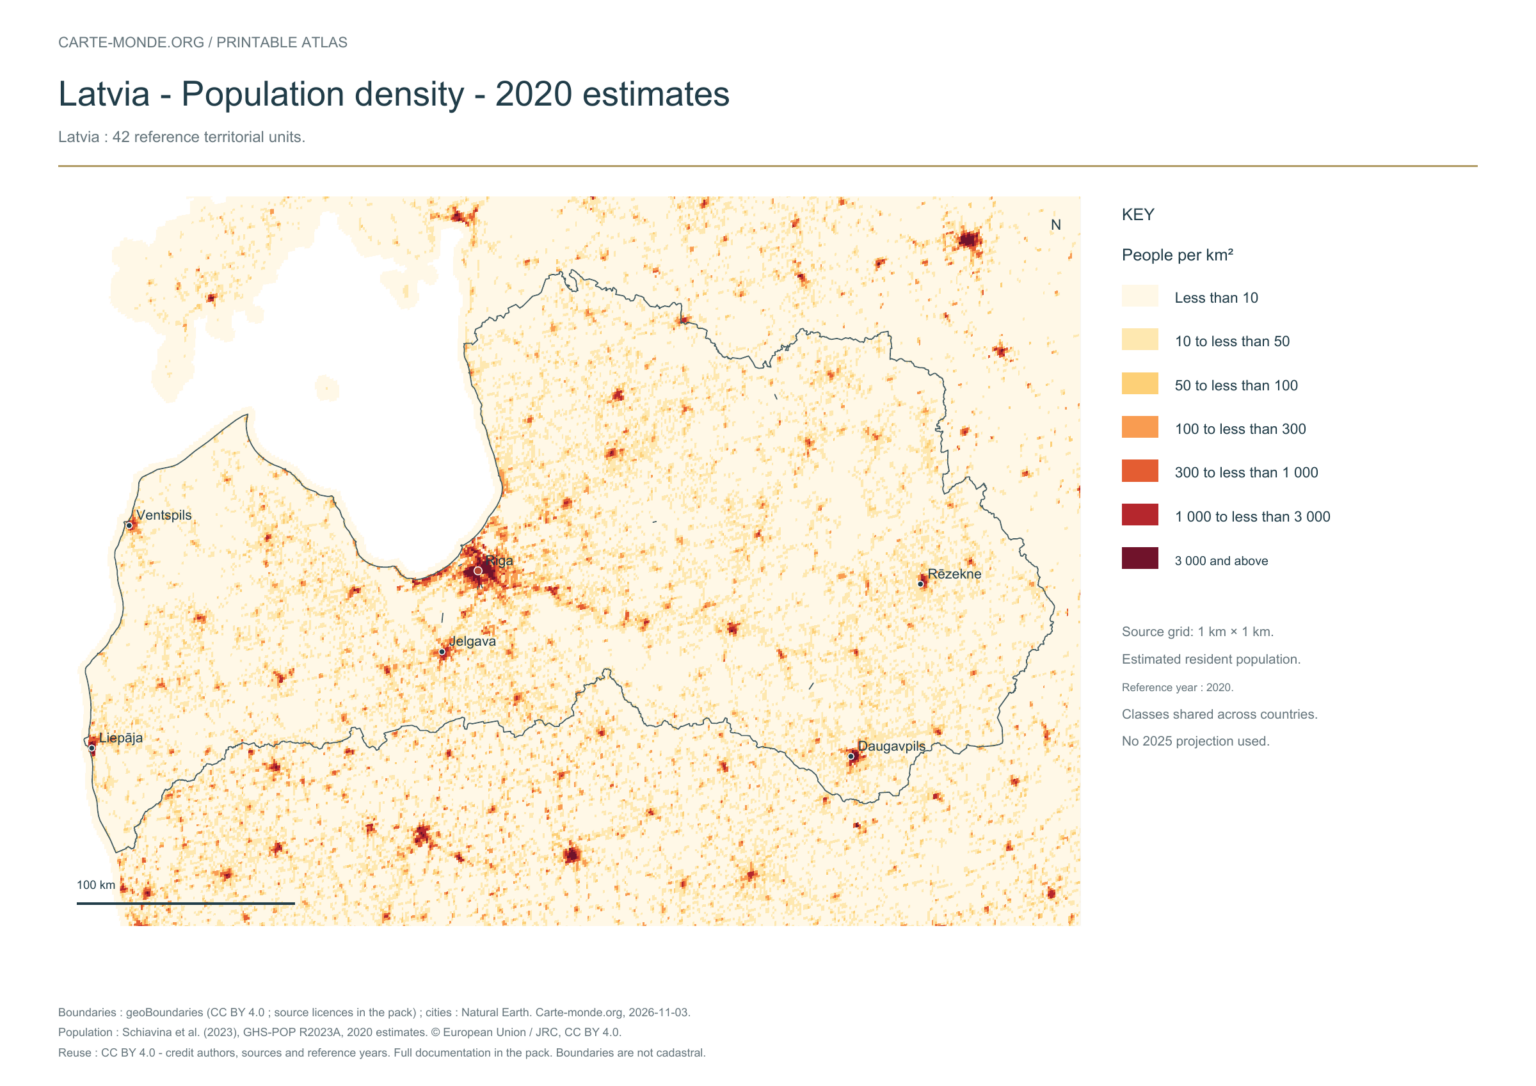
Population density — 2020 estimates — Latvia

Carte-monde.org · November 2026

Population density — 2020 estimates

Estimated residential population in 2020, on a source grid of 1 km². Inhabitants/km² classes are shared across countries; no 2025 projection.

A4 landscape PDF · PNG 2 400 px · CC BY 4.0

The data represents estimated residential population in 2020, on a 1 km² source grid. The document’s creation date does not change this reference year.

The five in-house maps in one pack

Regions and cities, location in Europe, simplified elevations, 2020 population density and shaded relief: five A4 PDFs, their PNGs and SVGs, with sources and licences.

Download the five maps — ZIP
Previous edition packs

The four maps in one pack

Four A4 PDFs, their PNGs and SVGs, with full notes. Terrain and density use an embedded image background; text and linework remain vector-based.

Download the Latvia pack — ZIP

Find the old maps of Latvia

Previously published maps remain accessible at their original URLs, with the collection’s text and credits.

Open the old maps of Latvia

Choose and print a map

Regions and cities show how the territory is organized; the location map places the country; terrain shows the main natural regions; density shows population distribution. Print the in-house PDFs in A4 landscape with “Fit to page”. Insets have their own scales.

For exercises: six blank base maps of Latvia.

Sources, reference years and reuse

Administrative boundaries: geoBoundaries / Geoportal of Latvia. Latvia — geoBoundaries 2021 geometries; incorporation of Varakļāni into Madona taken into account (2025). Boundary source and terms. Primary license: Creative Commons Attribution 4.0 International (CC BY 4.0). The geometries used and credits are included in the pack; derived databases under ODbL remain under ODbL.

Neighbouring area, cities and hydrography: Natural Earth 5.1.1, public domain, generalised boundaries not for cadastral use.

Relief: SRTM15+ / Tozer et al. (2019), reference publication, via GMT earth_relief_02m derived from SRTM15+V2.7. Grid smoothed to two arc minutes, suitable for a national overview, without topographic precision.

Population: Schiavina et al. (2023), GHS-POP R2023A, 2020 residential estimates, © European Union / JRC, CC BY 4.0. The 1 km² Mollweide cells are expressed in inhabitants/km². Methodology: Pesaresi et al. (2024).

The four new maps: created by Carte-monde.org, November 2026, under CC BY 4.0. Cite authors, sources and reference years, and indicate adaptations. Additional and older maps retain their own rights.

Country maps · Other maps and archives

Previous versions: maps and files preserved

These files remain available at their original URLs. For corrected maps, use the main links above. Each edition retains its credits and date.

Raster base map, cities, rivers and lakes: Natural Earth, public domain. Other boundary credits and licences are retained in the pack. Cartographic work CC BY 4.0; ODbL-derived data retains its licence. No topographic accuracy is claimed.

Previous collection — original files preserved
Flag of Latvia
Flag of Latvia
Maps of Latvia
general map of Latvia
Latvia terrain map
Latvia terrain map
Original French files
Previous language edition

Maps of Lithuania: regions, cities, relief and population

Flag of Lithuania
Flag of Lithuania

LITHUANIA · PRINTABLE MAPS

Five printable maps of Lithuania: regions and cities, location in Europe, two views of the relief and population. PDFs, images and sources are available below.

Our five maps have English labels. Maps from other publishers retain their original language.

Regions, cities and location in Europe

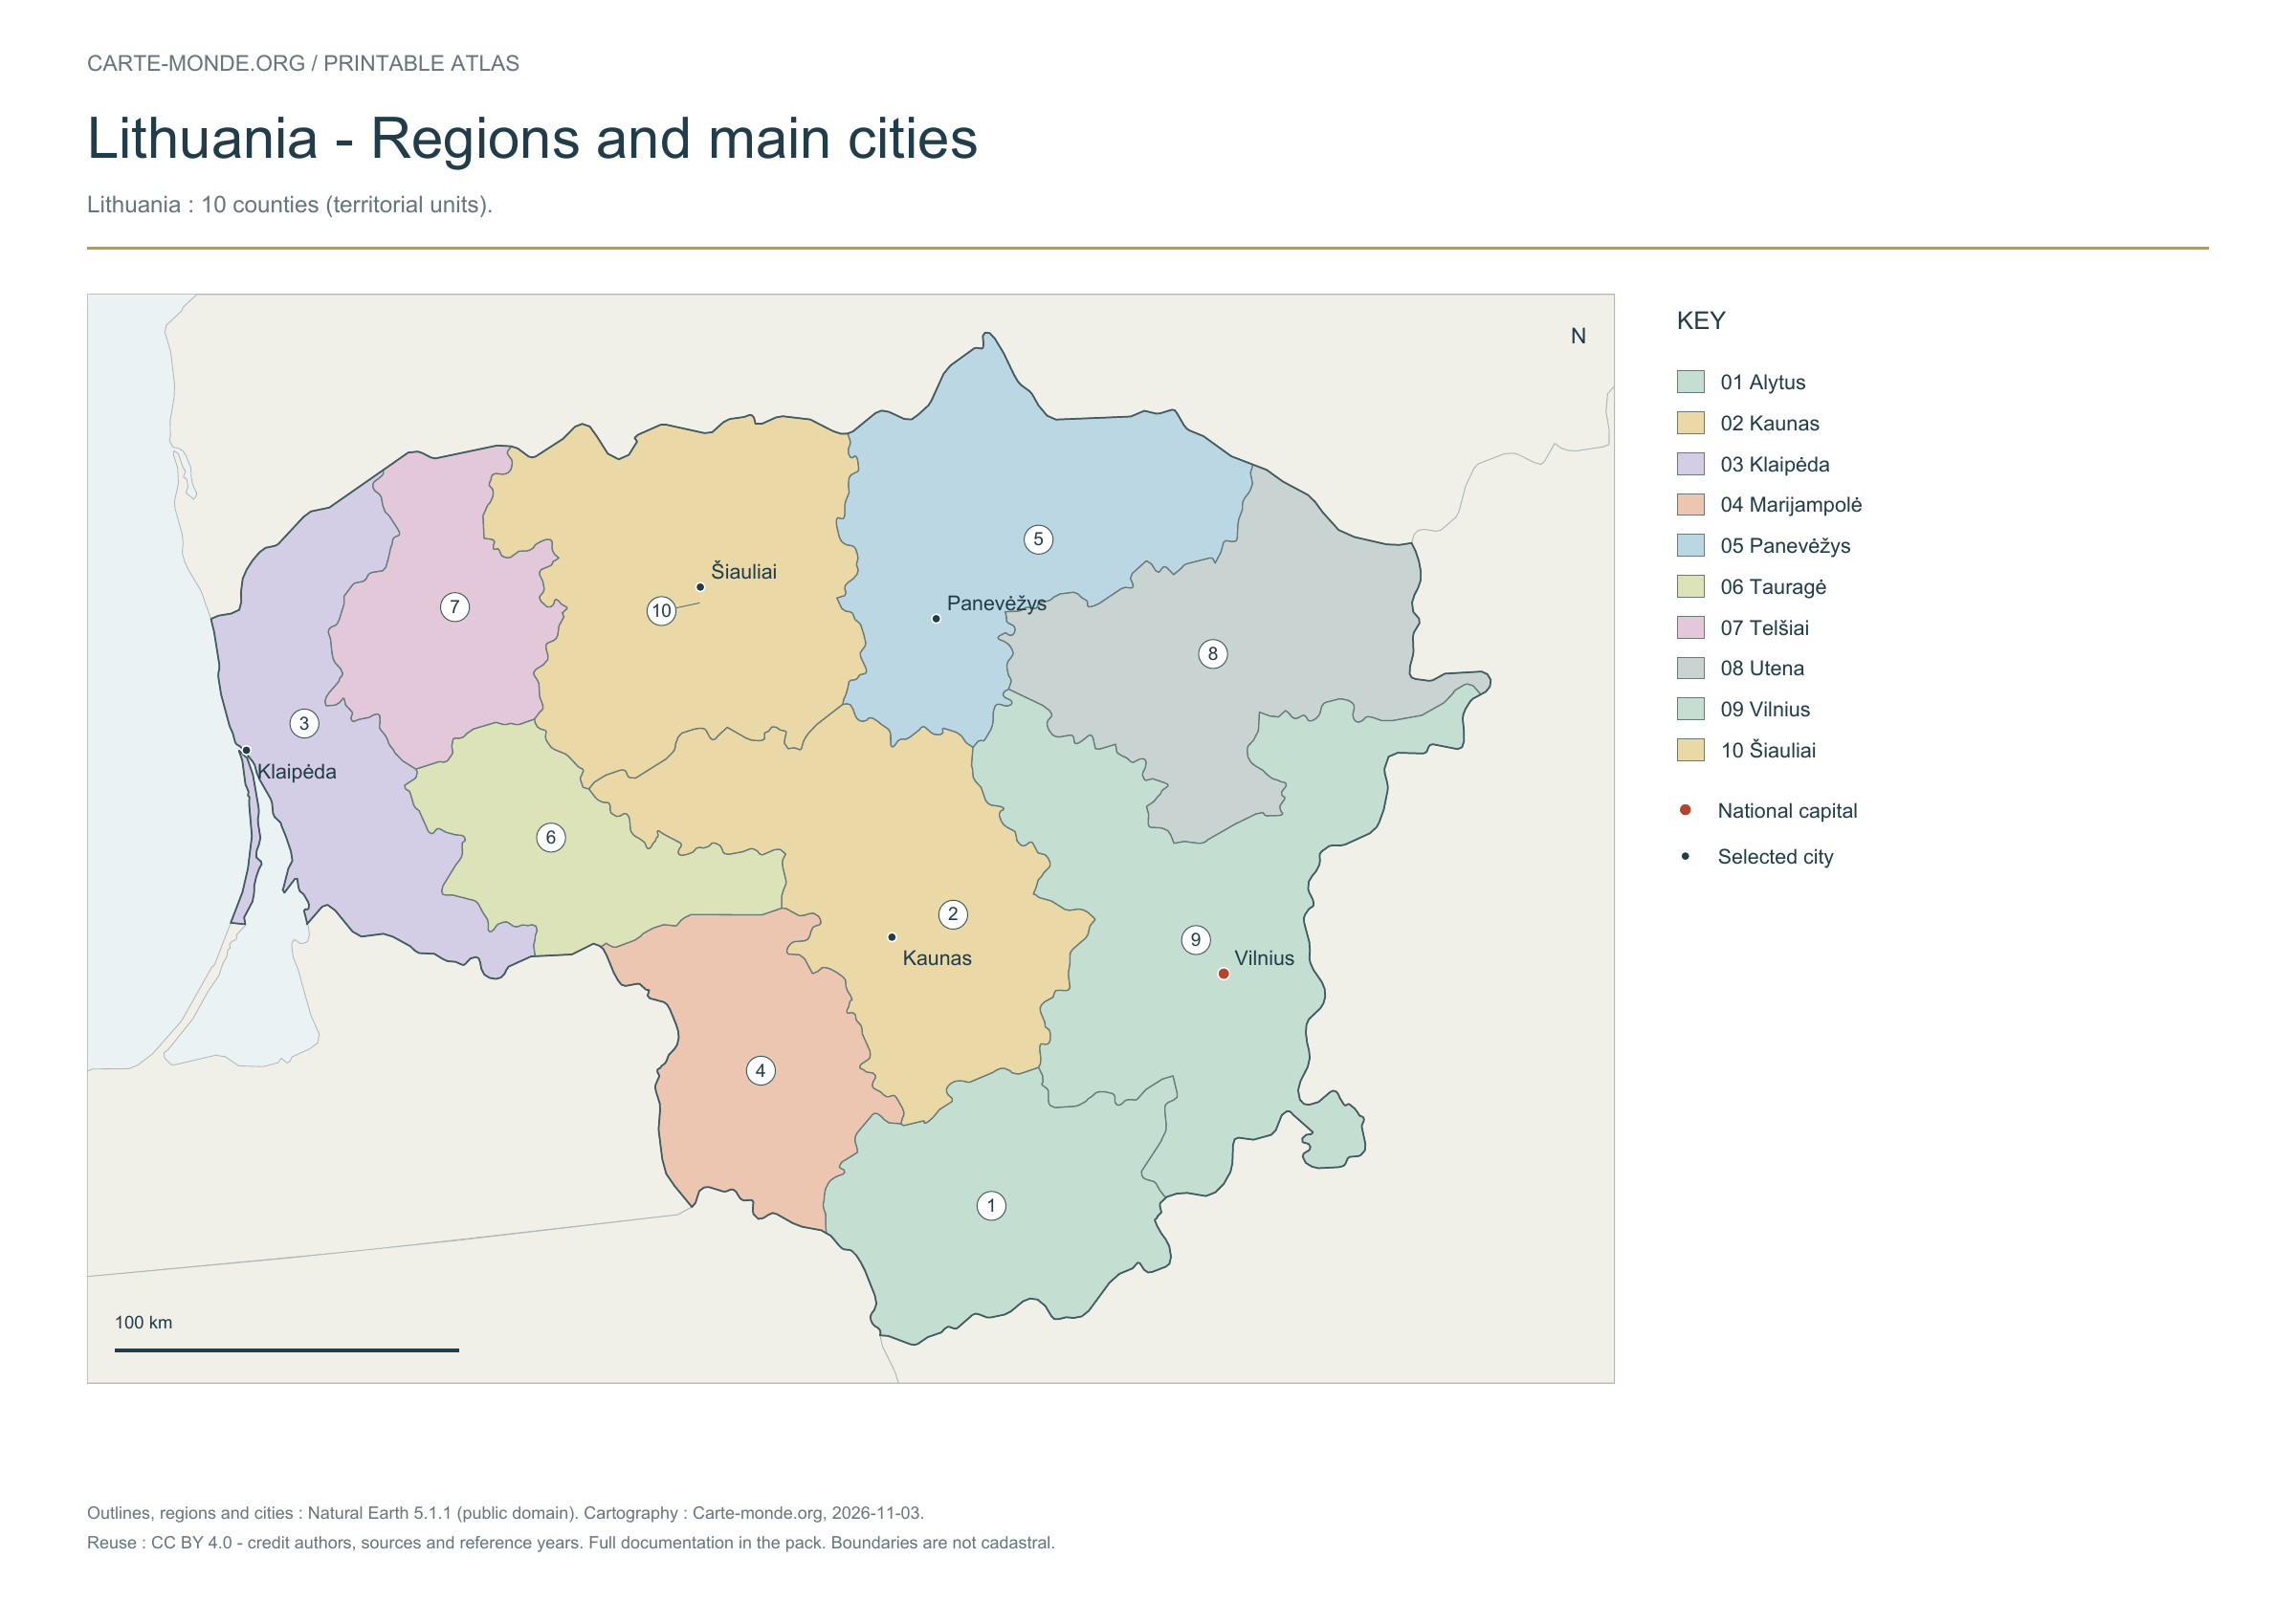
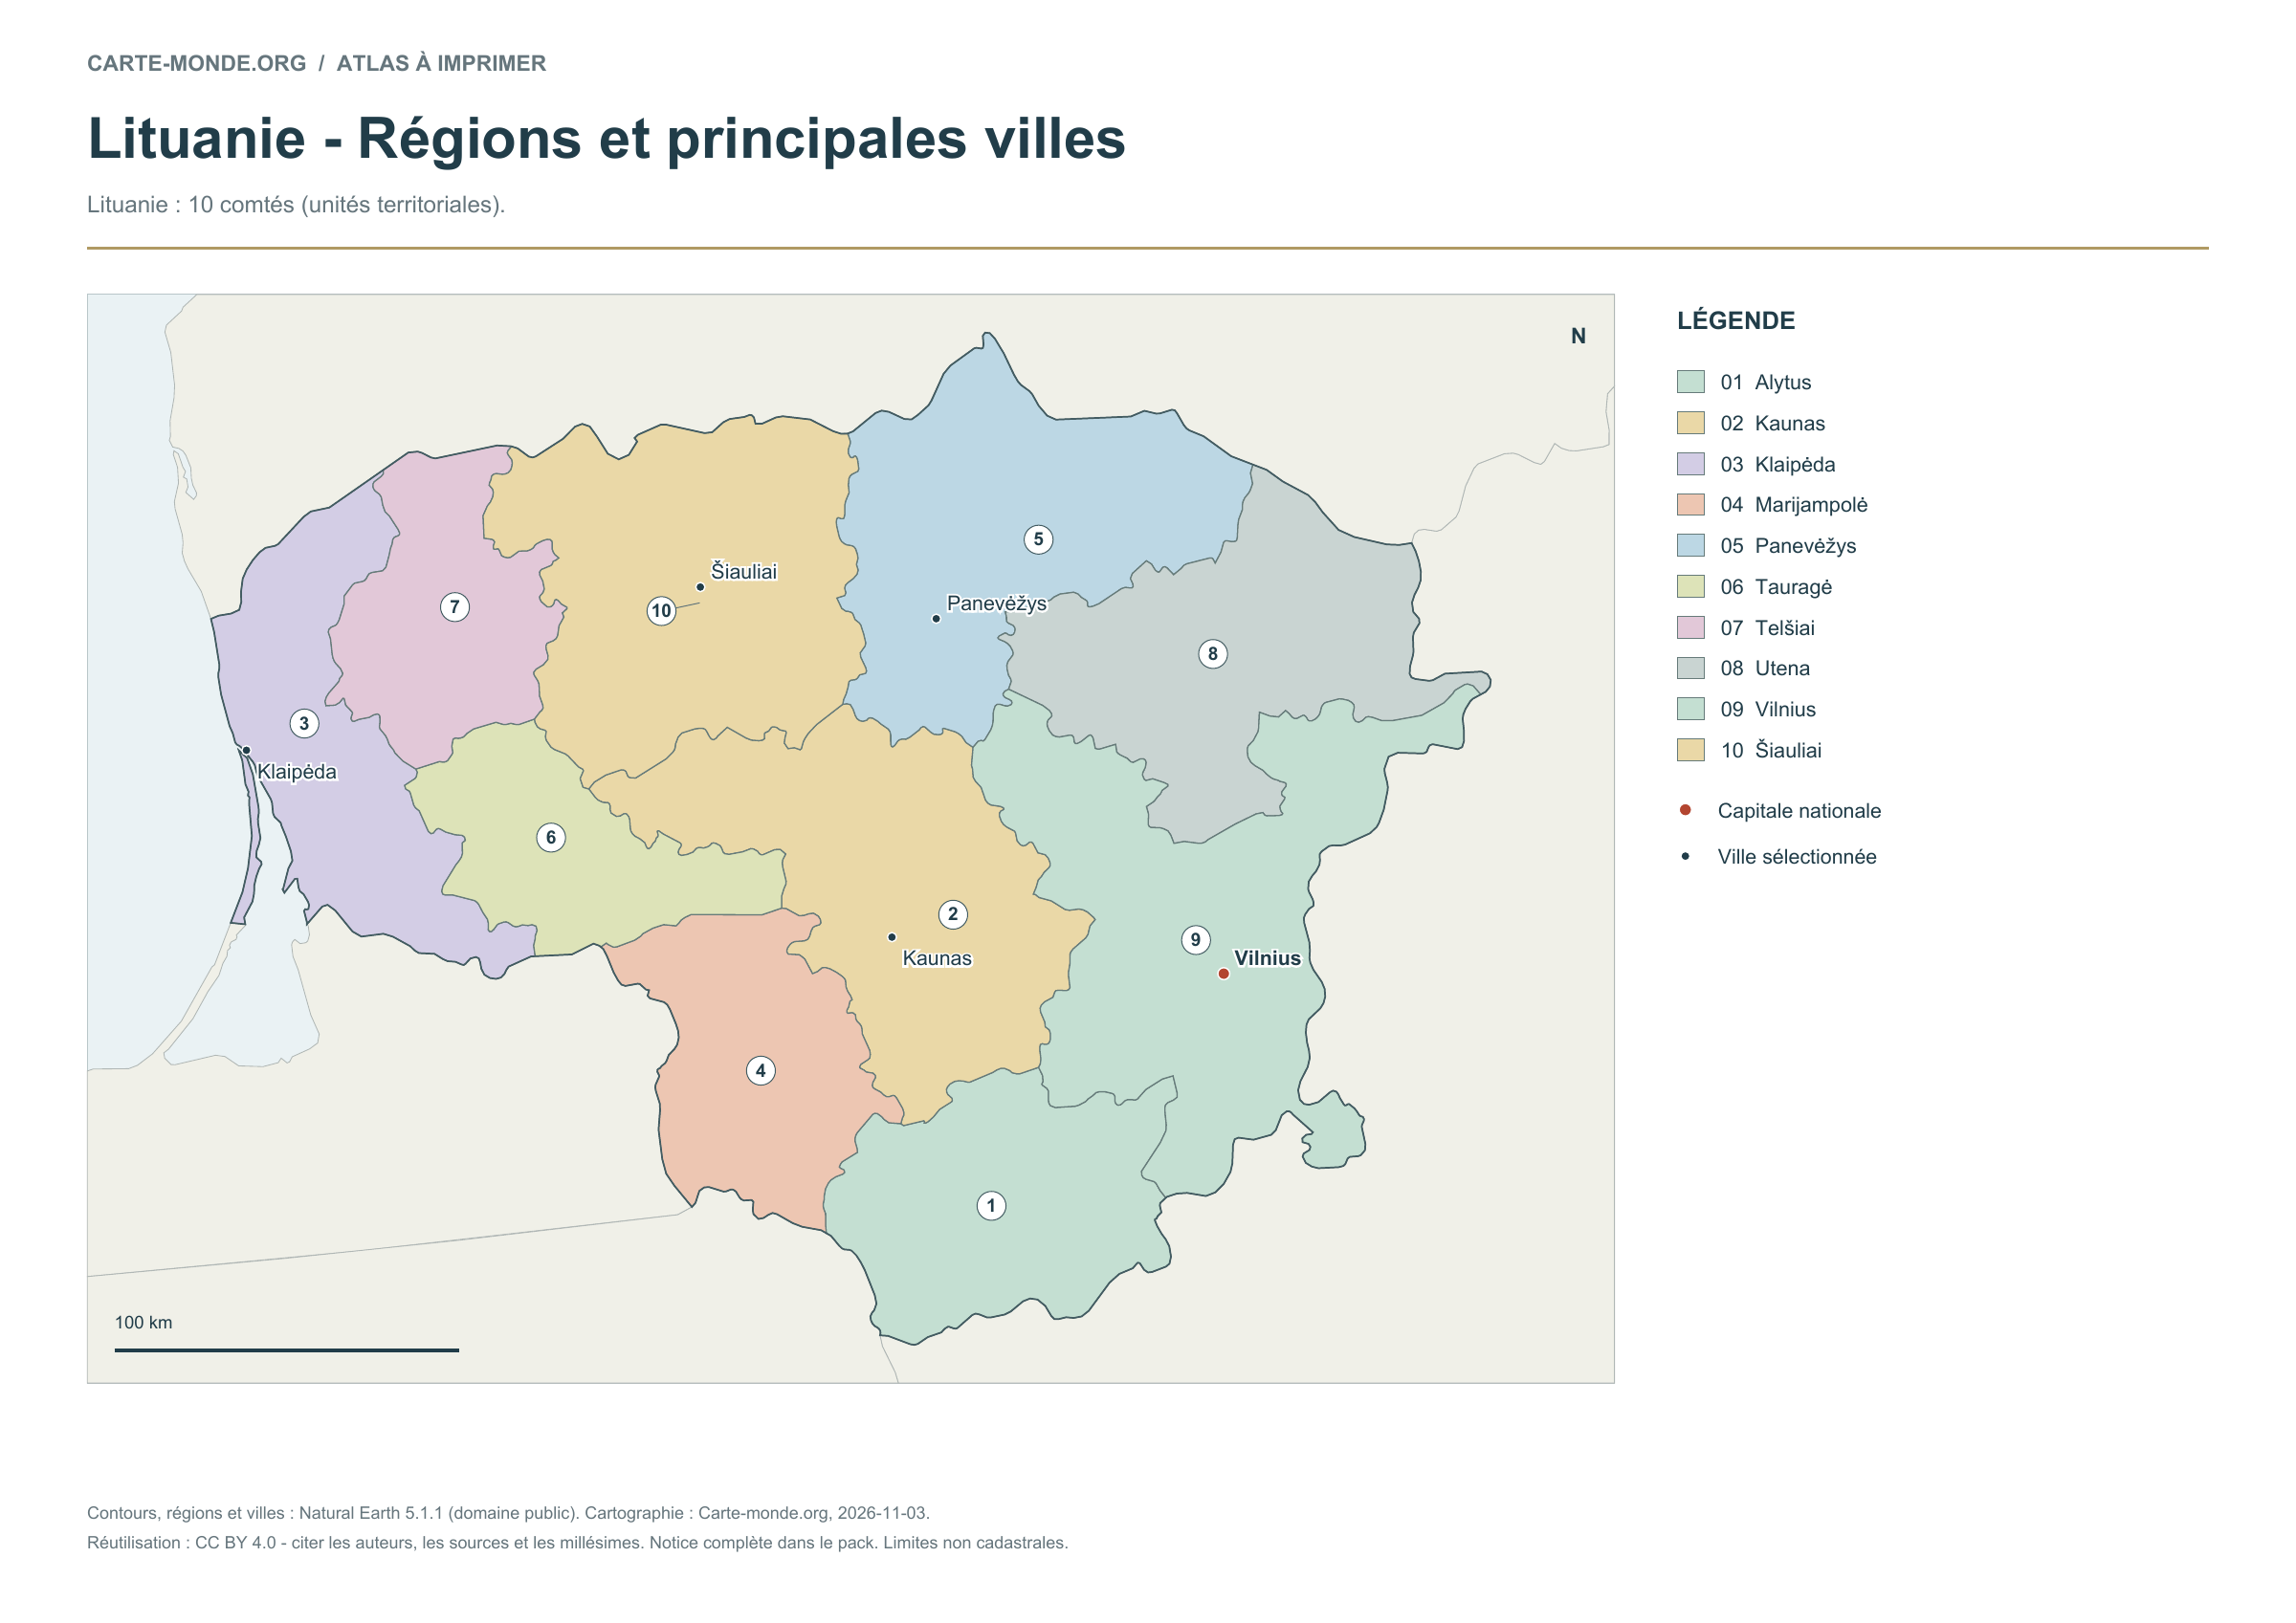
Lithuania: 10 counties (territorial units).

Regions and main cities — Lithuania

Carte-monde.org · November 2026

Regions and main cities

The 10 counties (territorial units) are numbered and named in the key, with selected cities and the capital.

A4 landscape PDF · PNG 2 400 px · CC BY 4.0

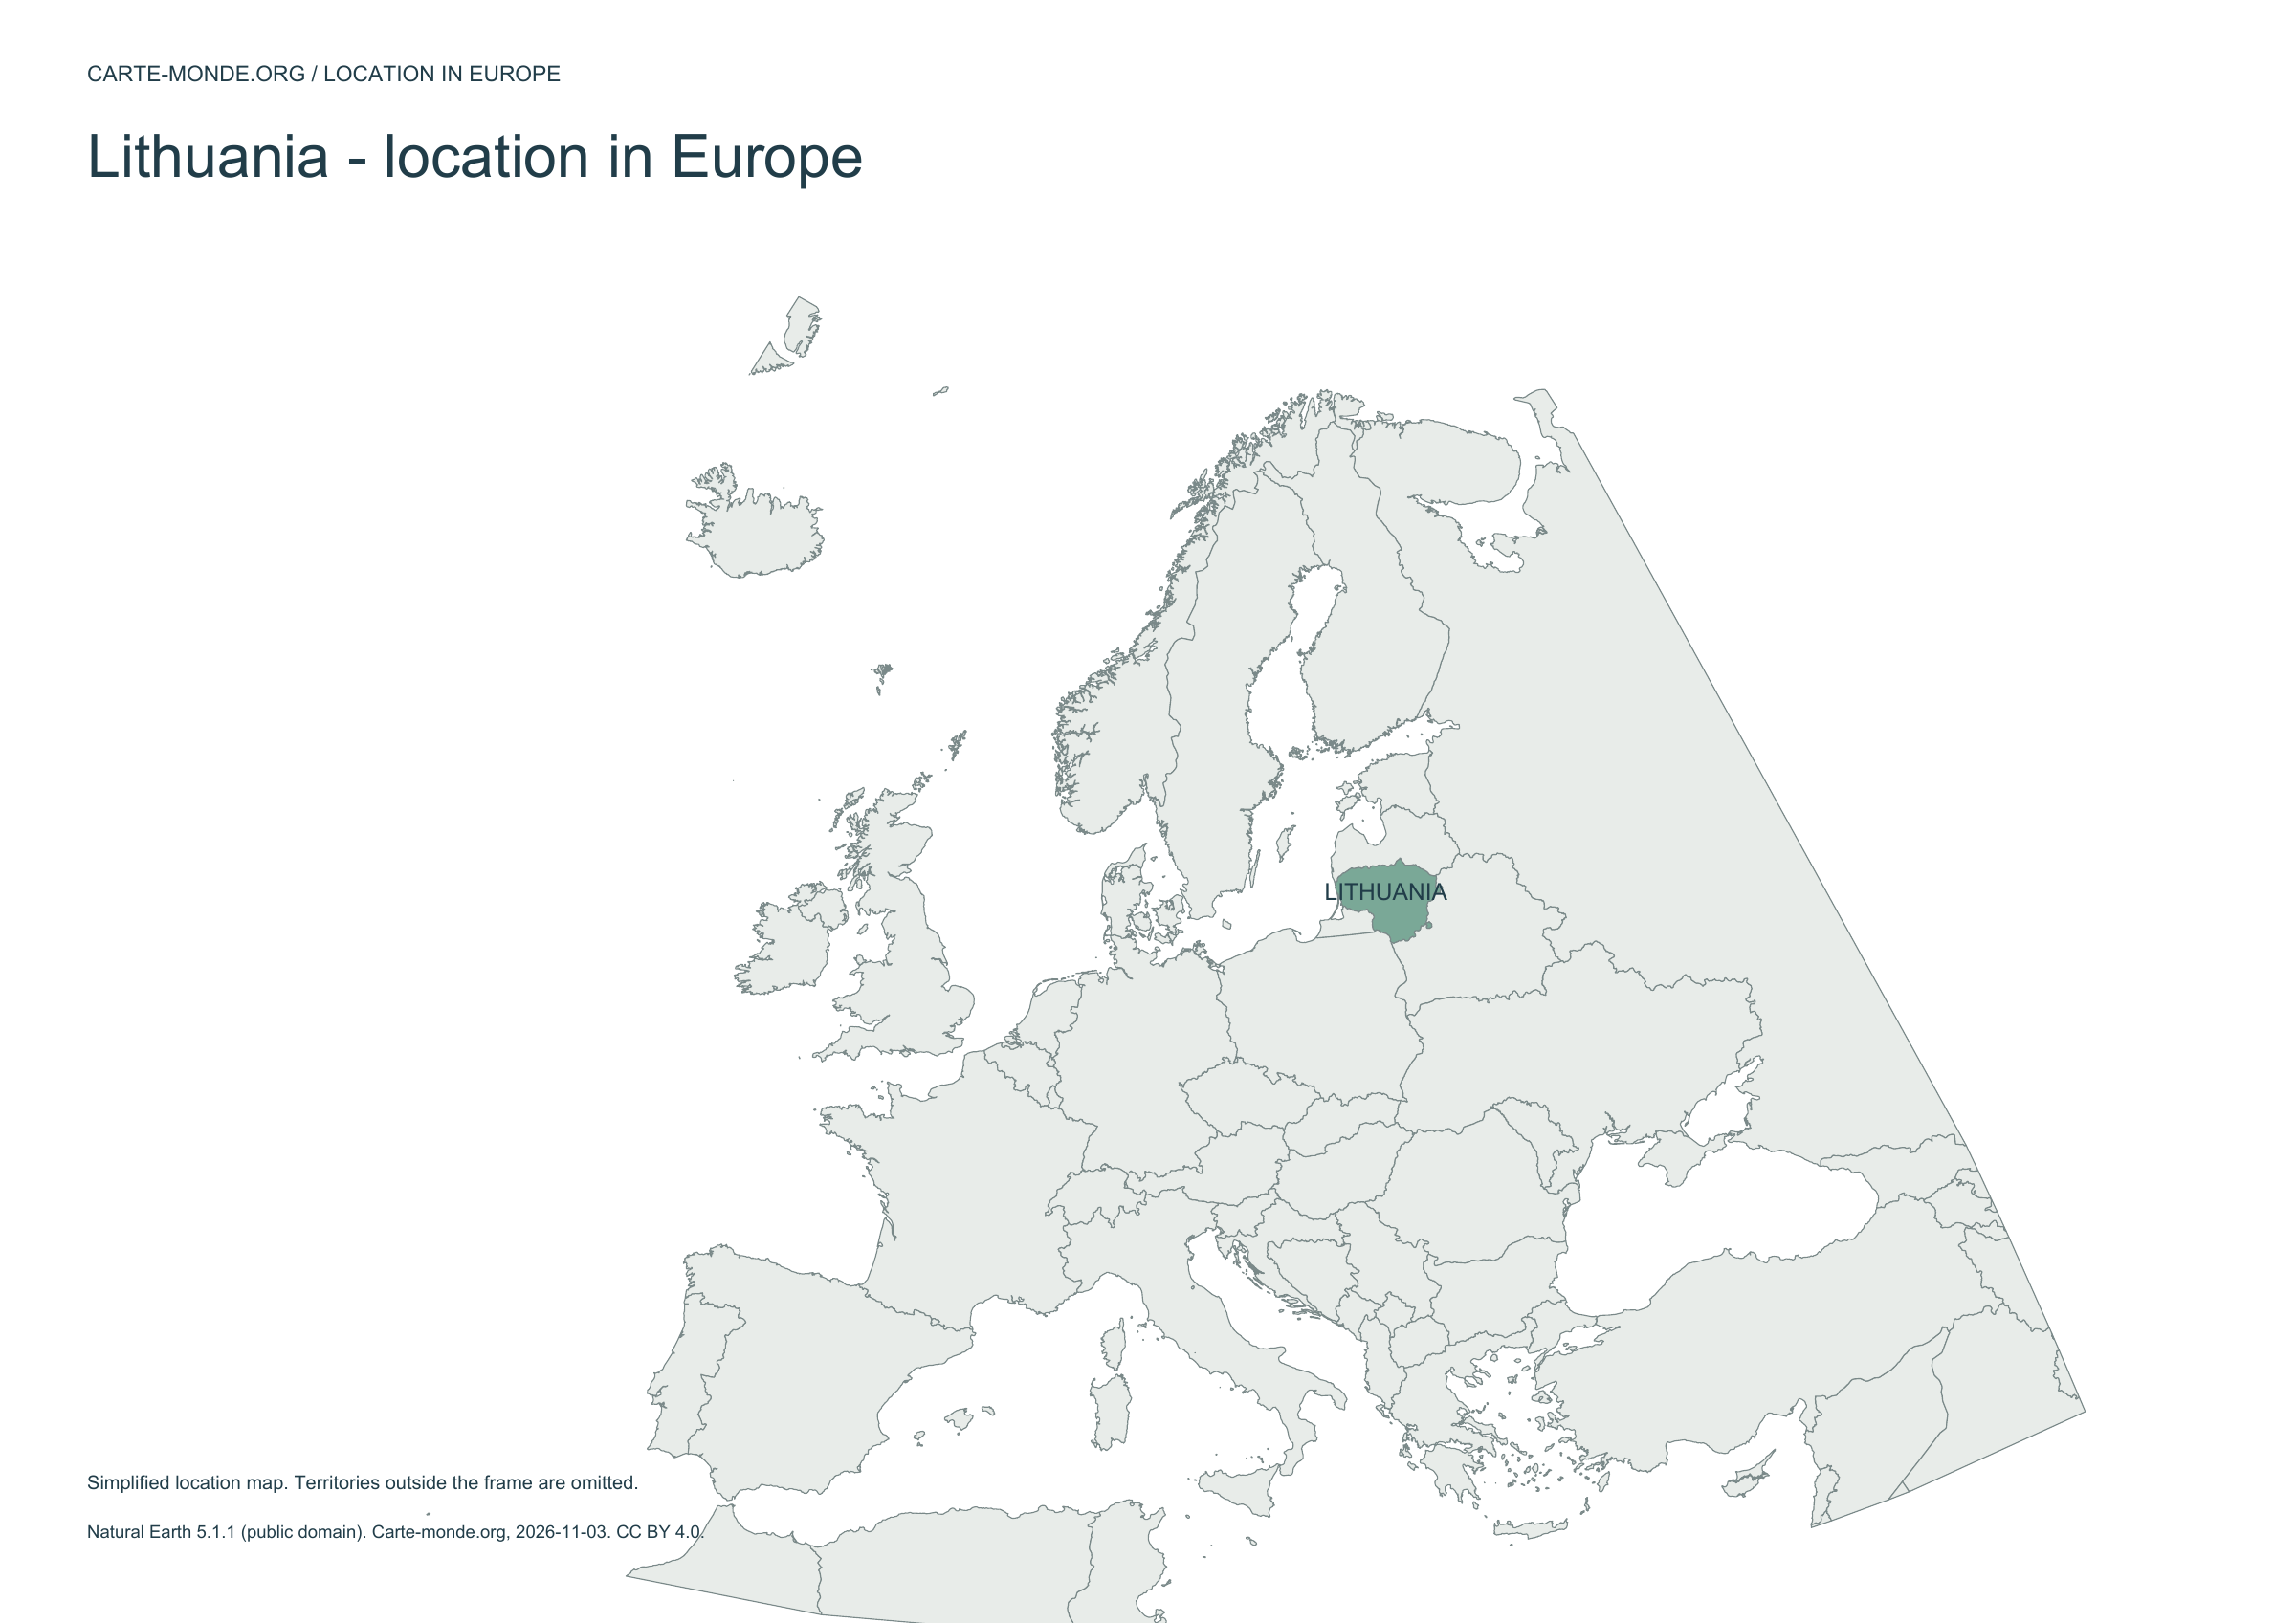
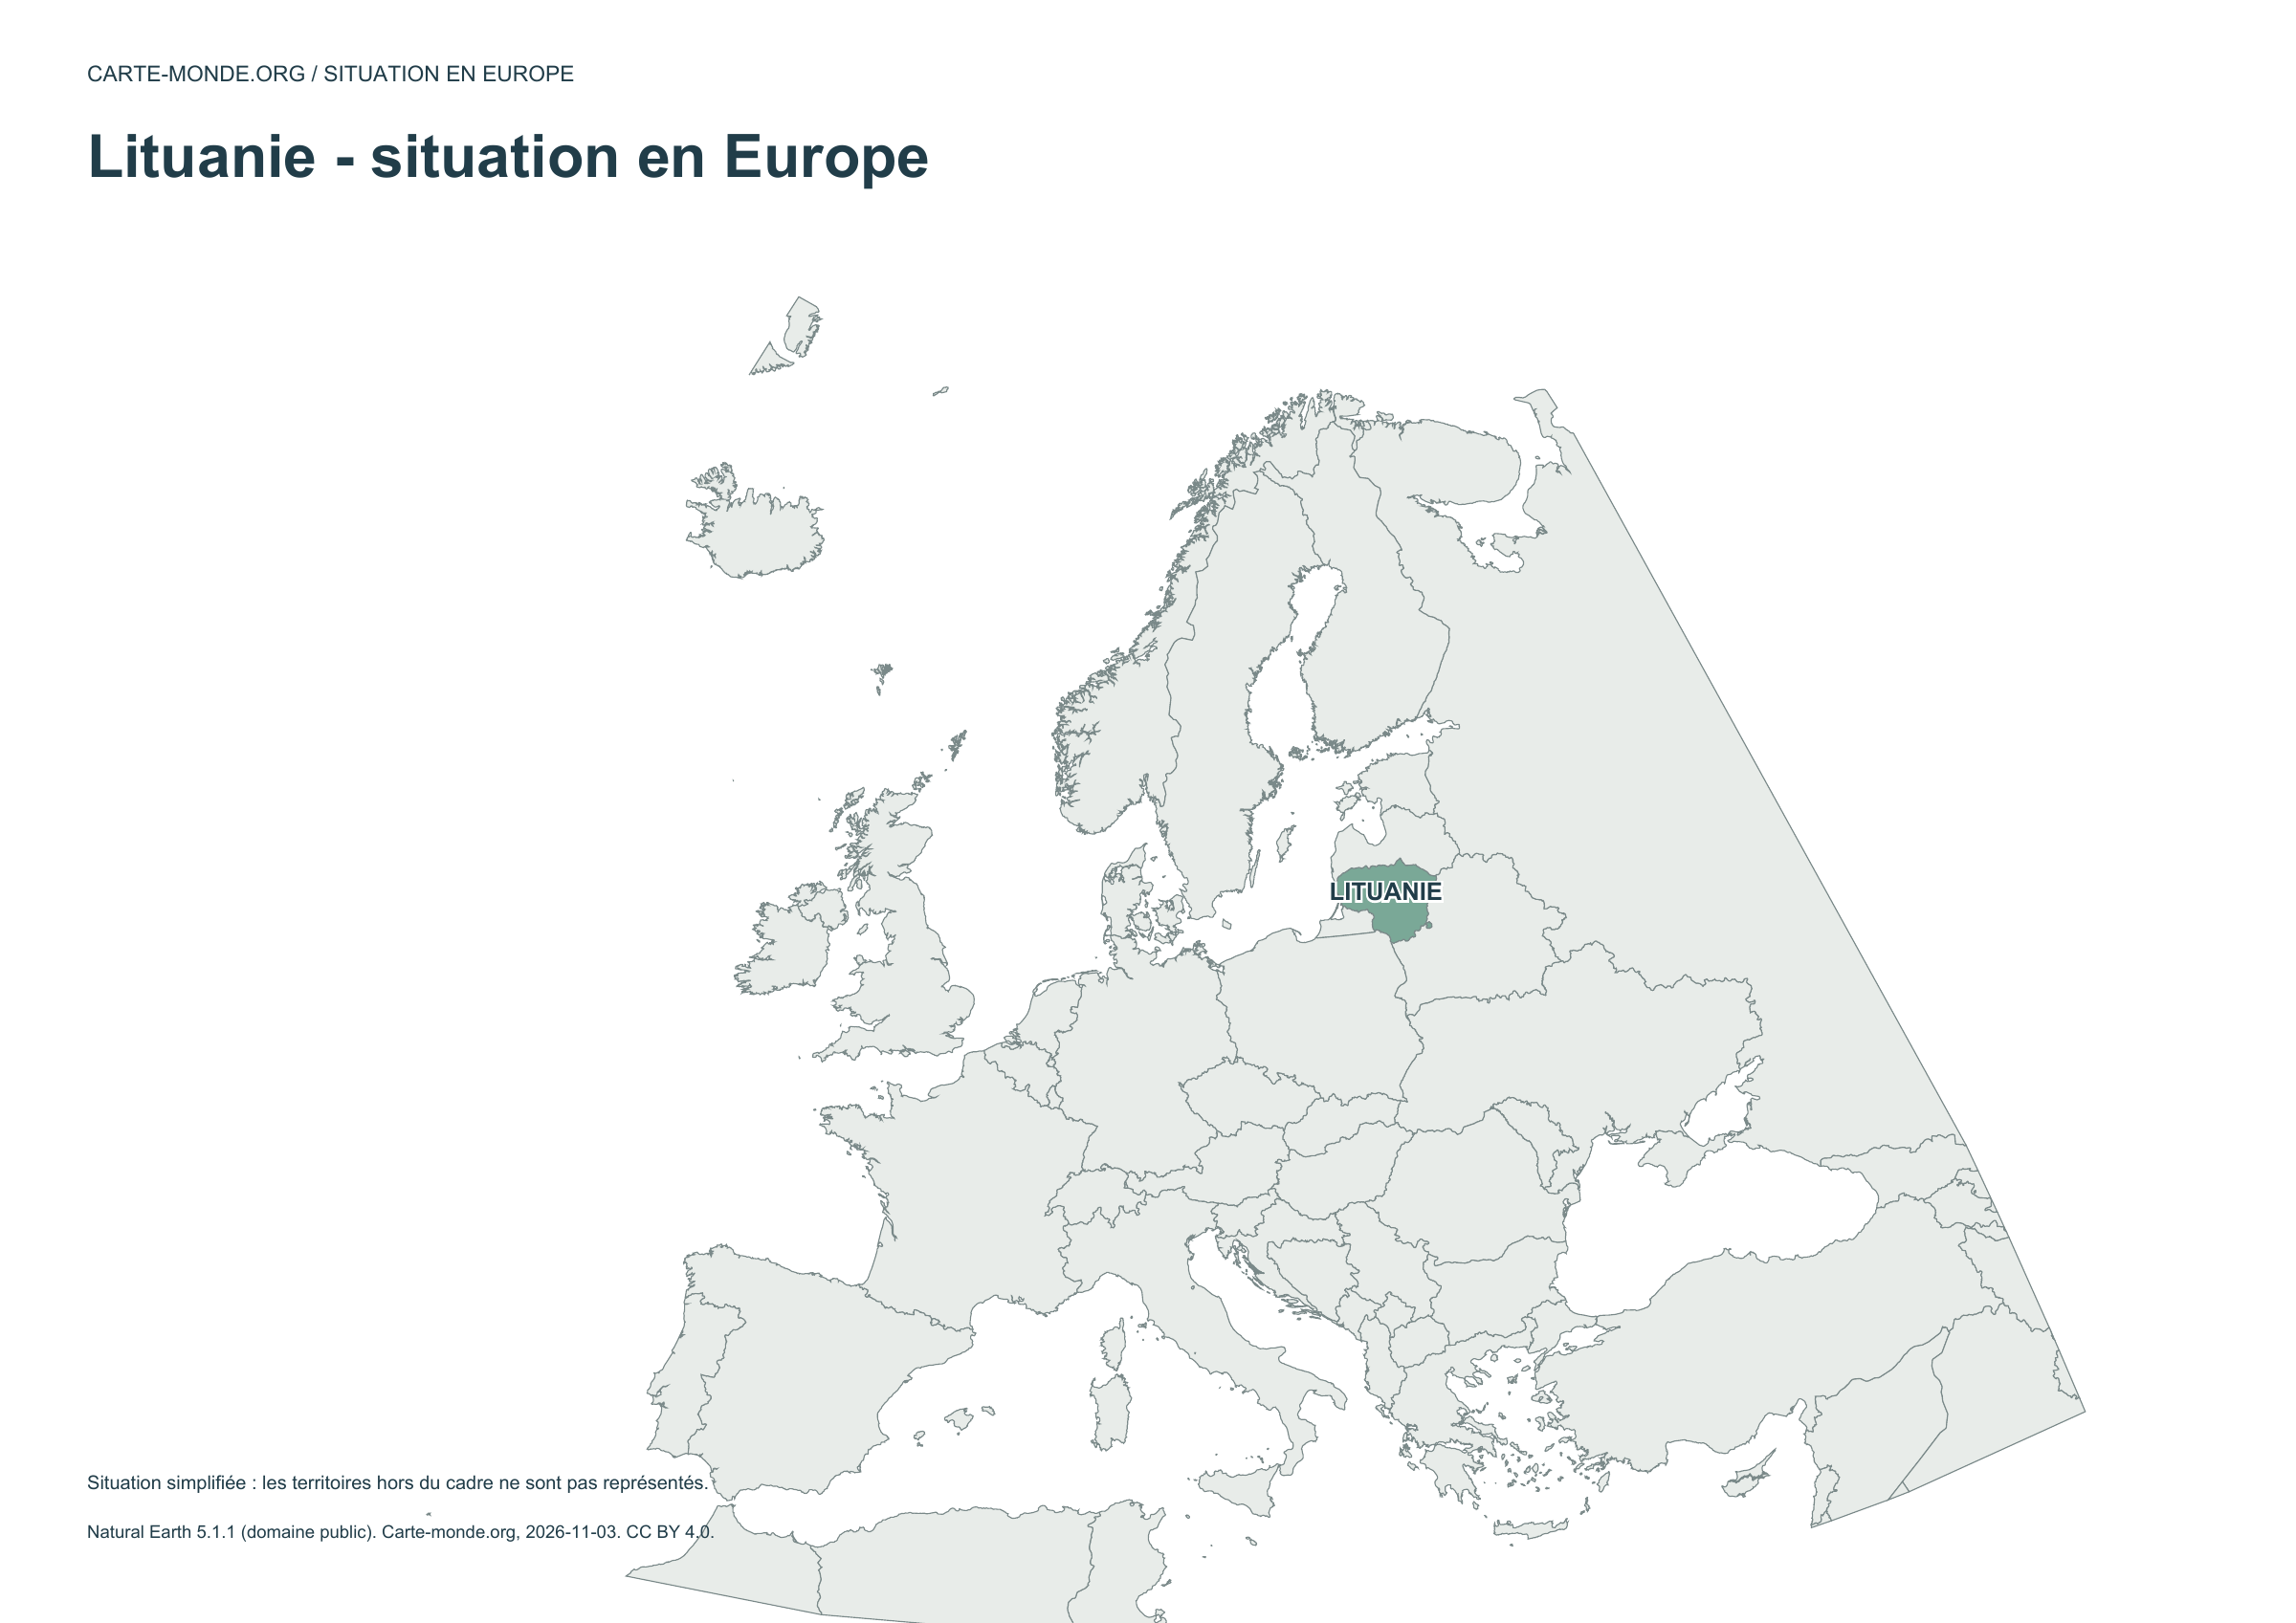
Location in Europe — Lithuania

Carte-monde.org · November 2026

Location in Europe

The country is highlighted within a simplified European frame; territories outside this frame are not shown.

A4 landscape PDF · PNG 2 400 px · CC BY 4.0

Two maps to understand the relief

Choose shaded relief for an overview, or elevation classes for school use.

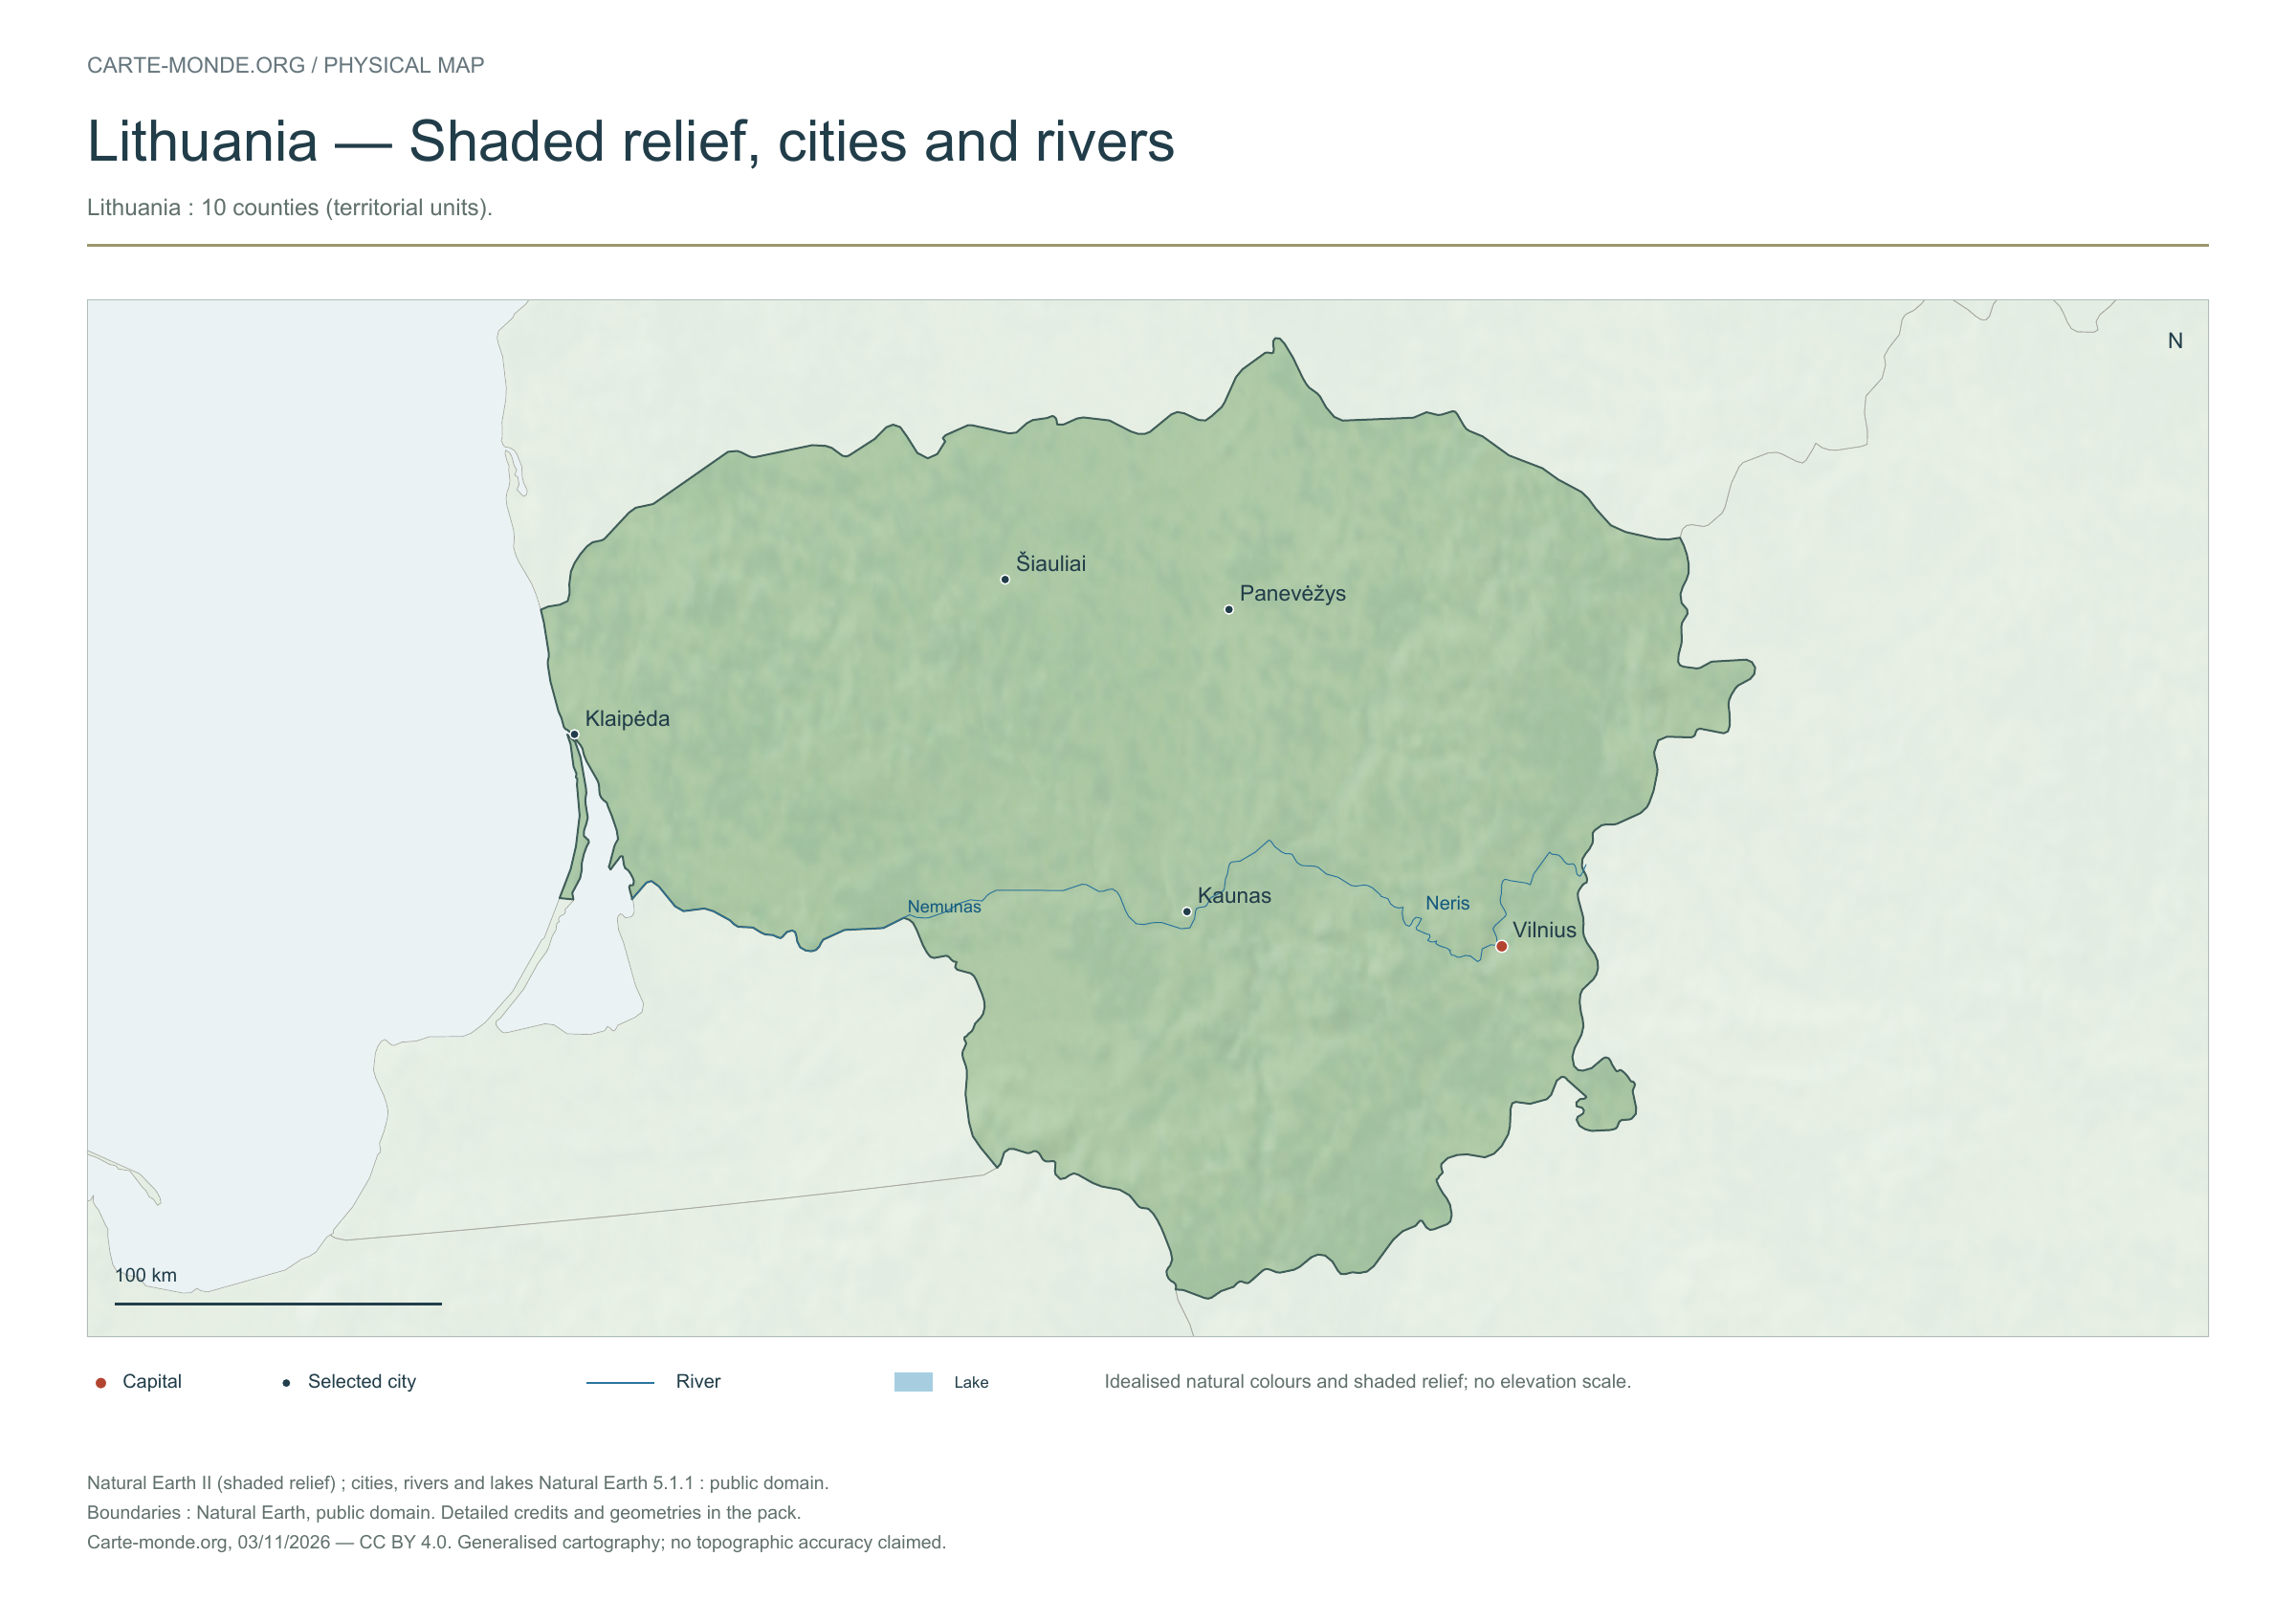
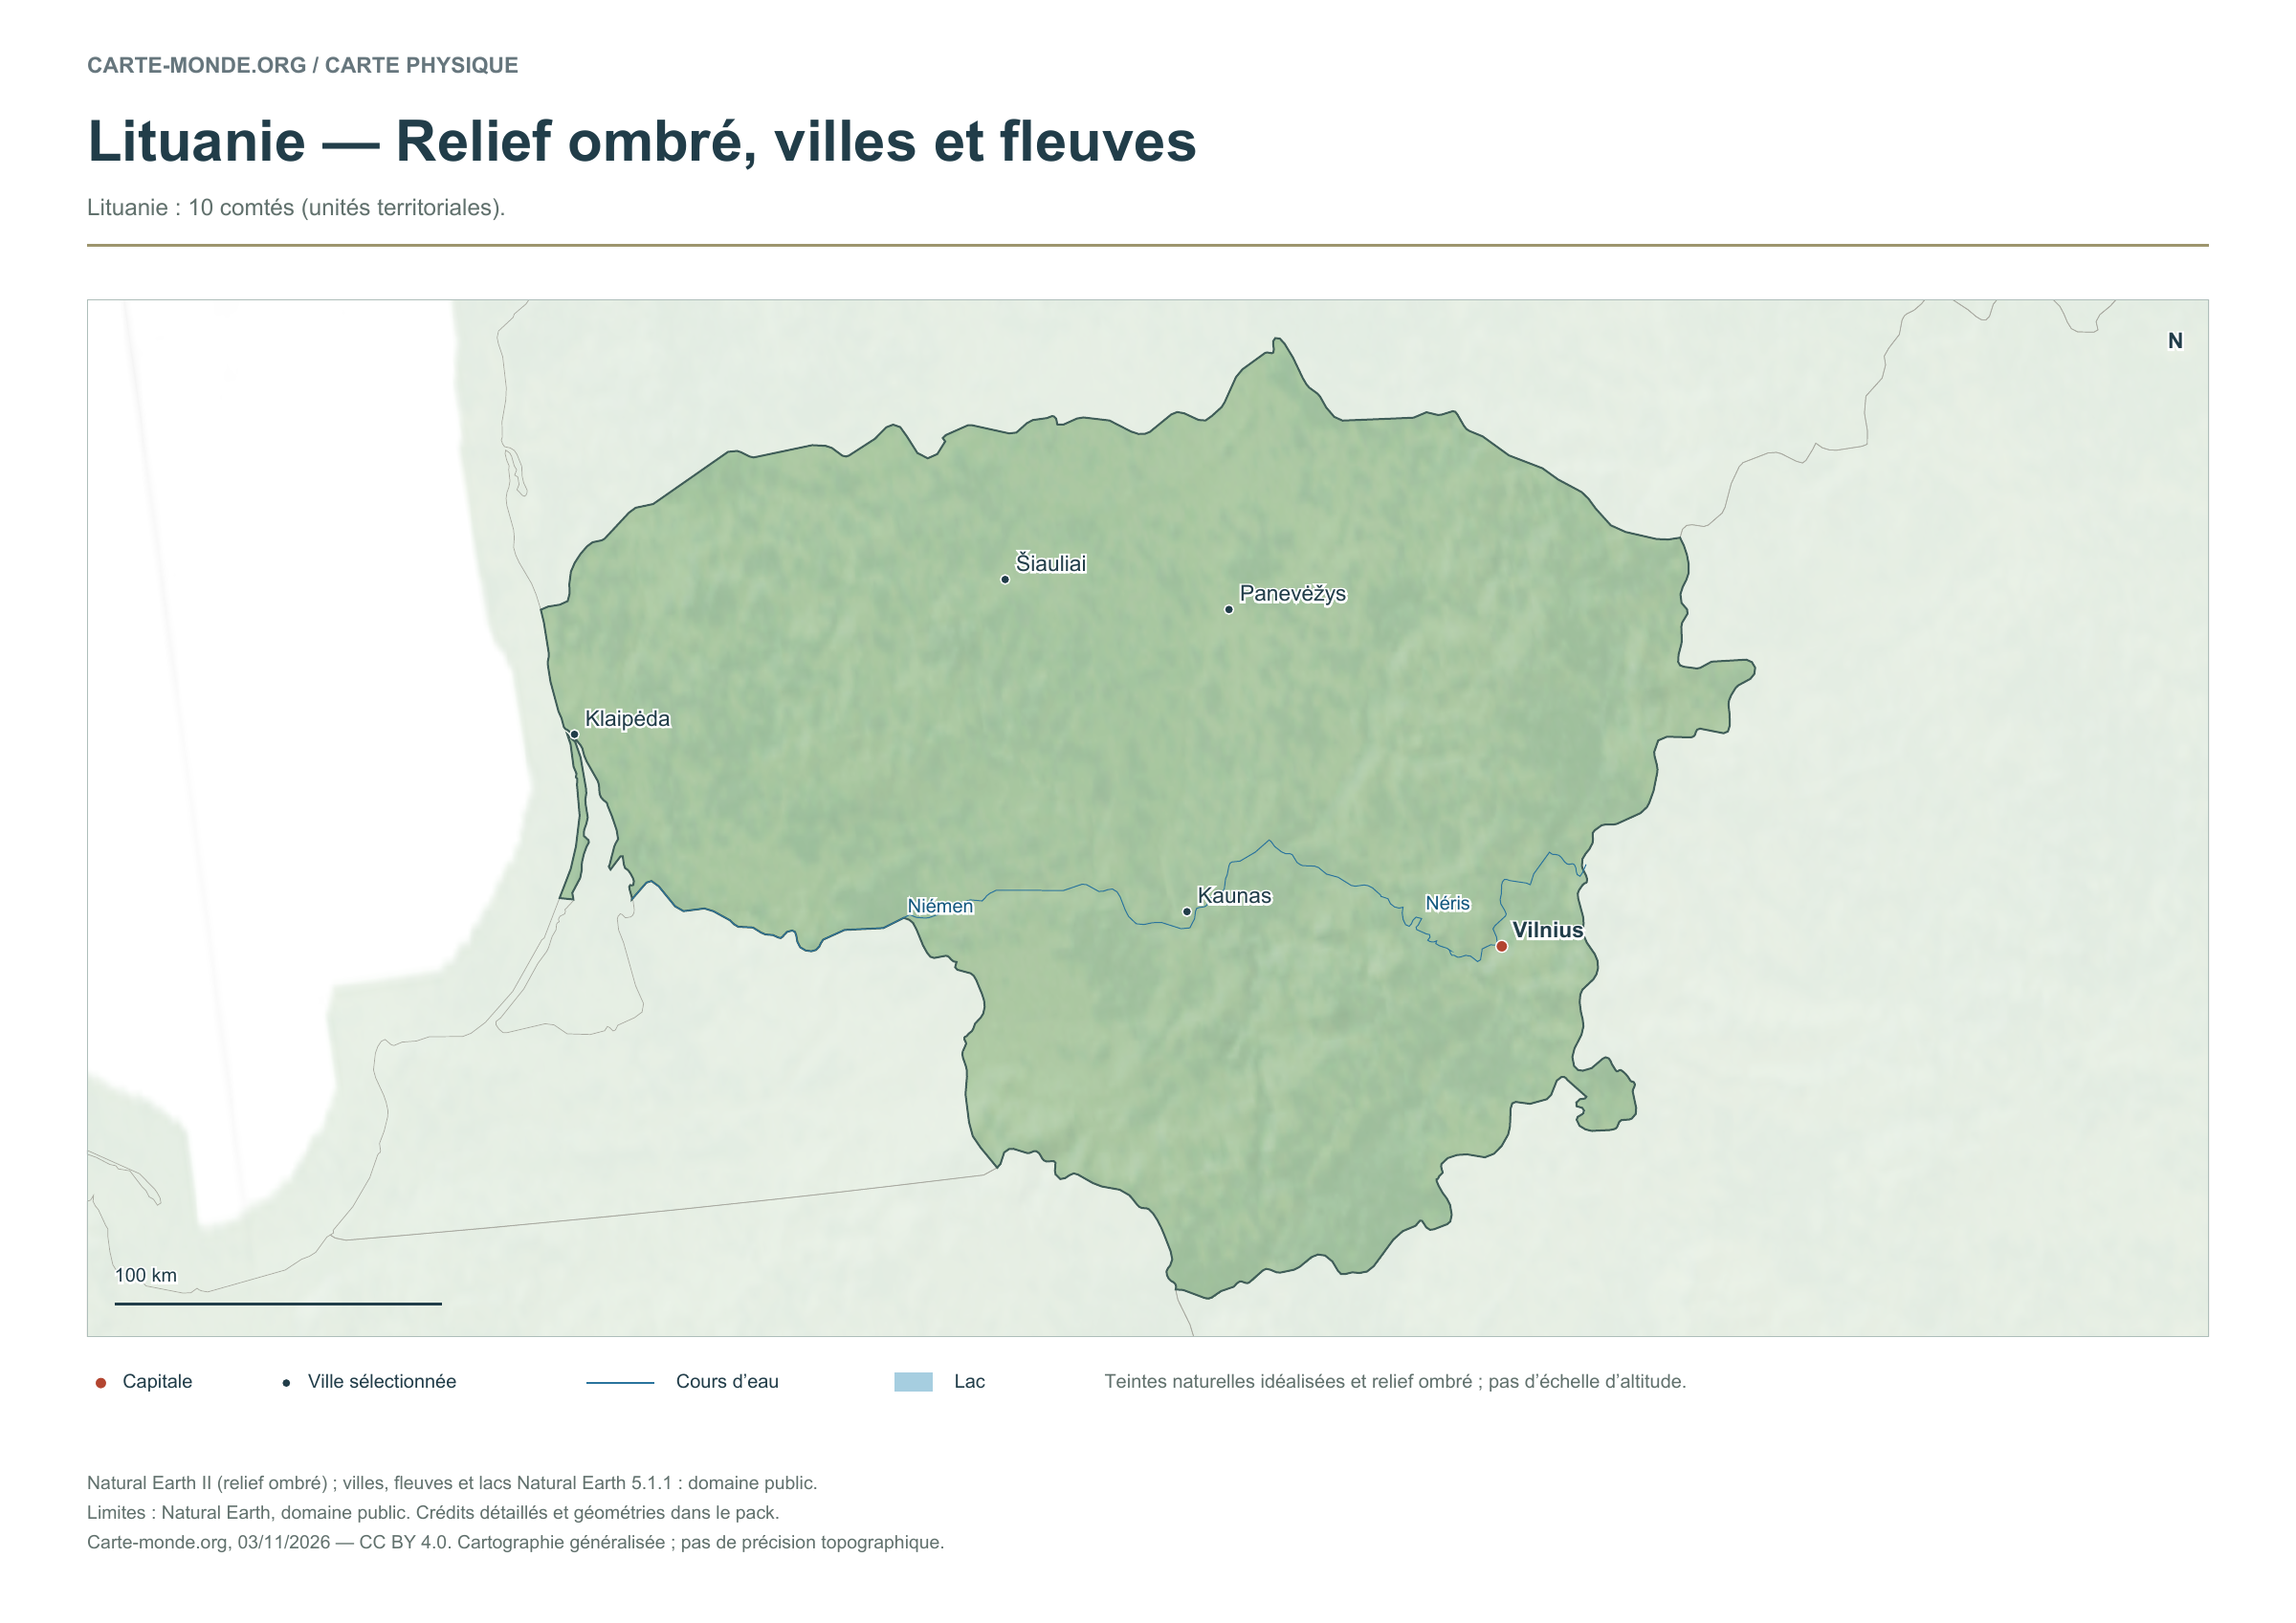
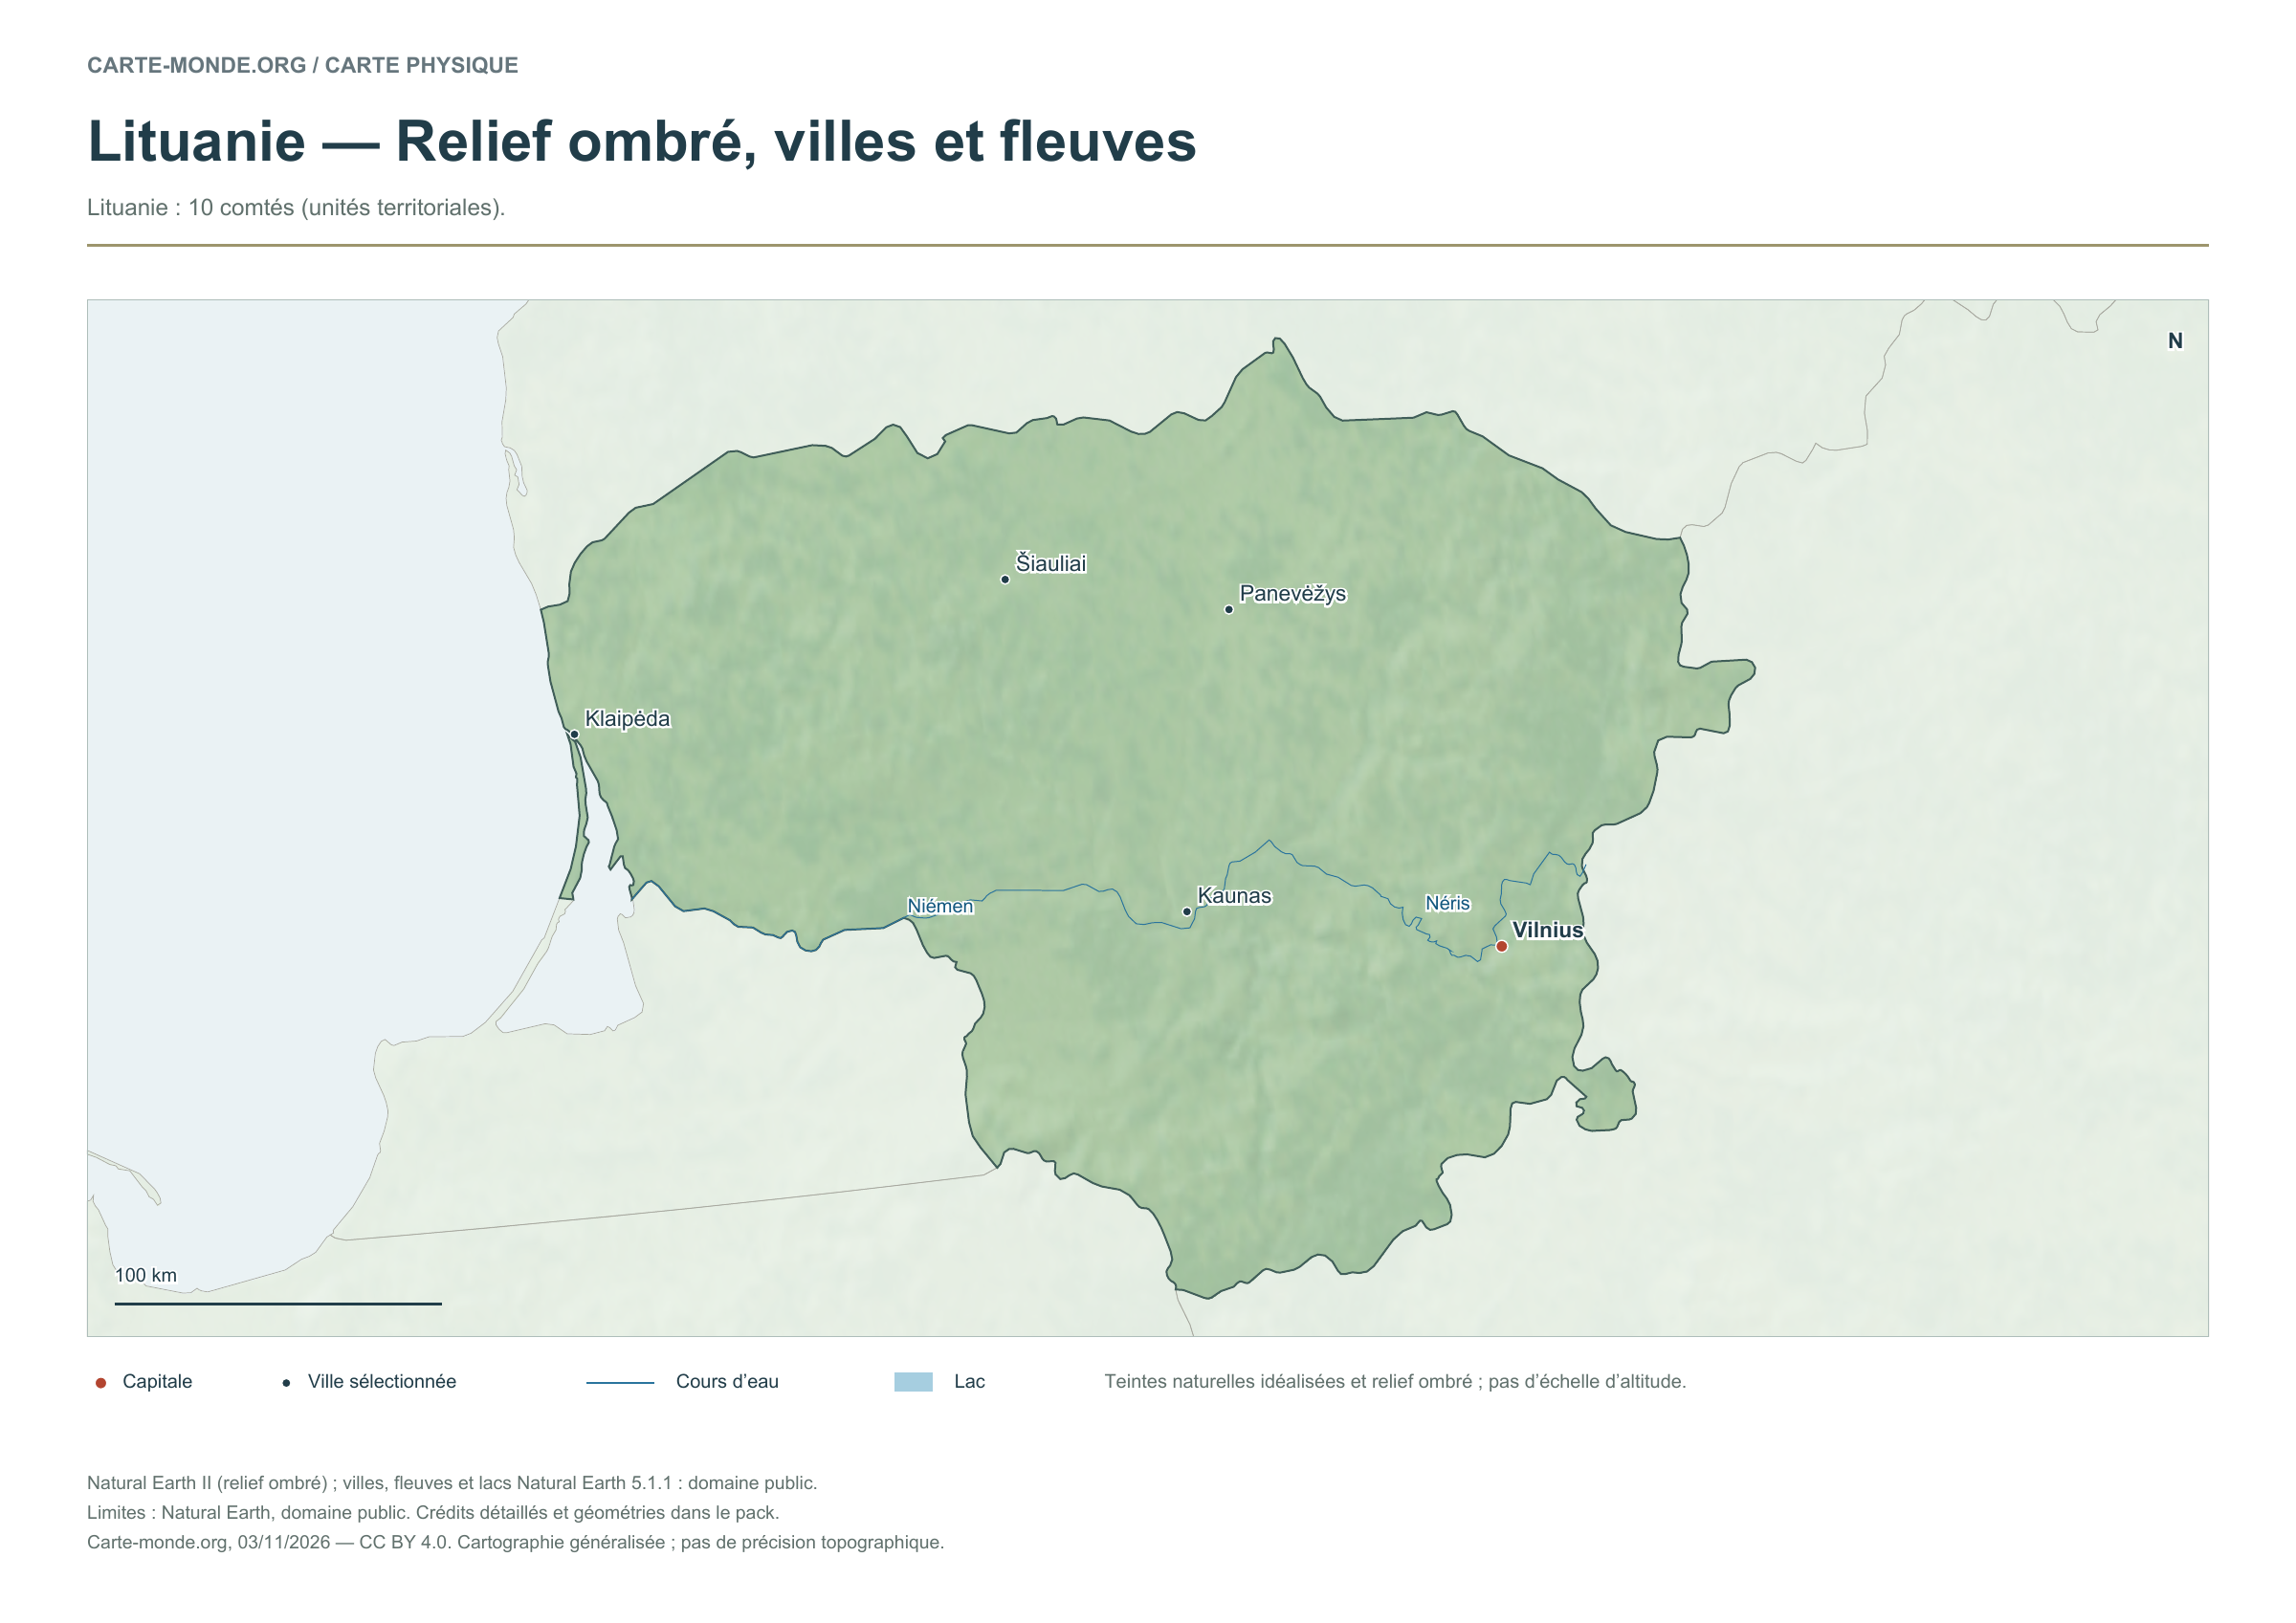
Lithuania — Shaded relief, cities and rivers

Carte-monde.org · November 2026

Shaded relief, cities and rivers

To identify major landforms, cities and the river network. The natural colours are not an elevation scale.

Raster base map, cities, rivers and lakes: Natural Earth, public domain. Other boundary credits and licences are retained in the pack. Cartographic work CC BY 4.0; ODbL-derived data retains its licence. No topographic accuracy is claimed.

Territory, data and selection of names

Lithuania: 10 counties (territorial units).

Natural Earth II shaded relief background, 5 selected cities. Named rivers: Niémen, Néris.

The colours represent idealised natural cover; they do not correspond to elevation classes. This global background remains generalised, particularly for small states.

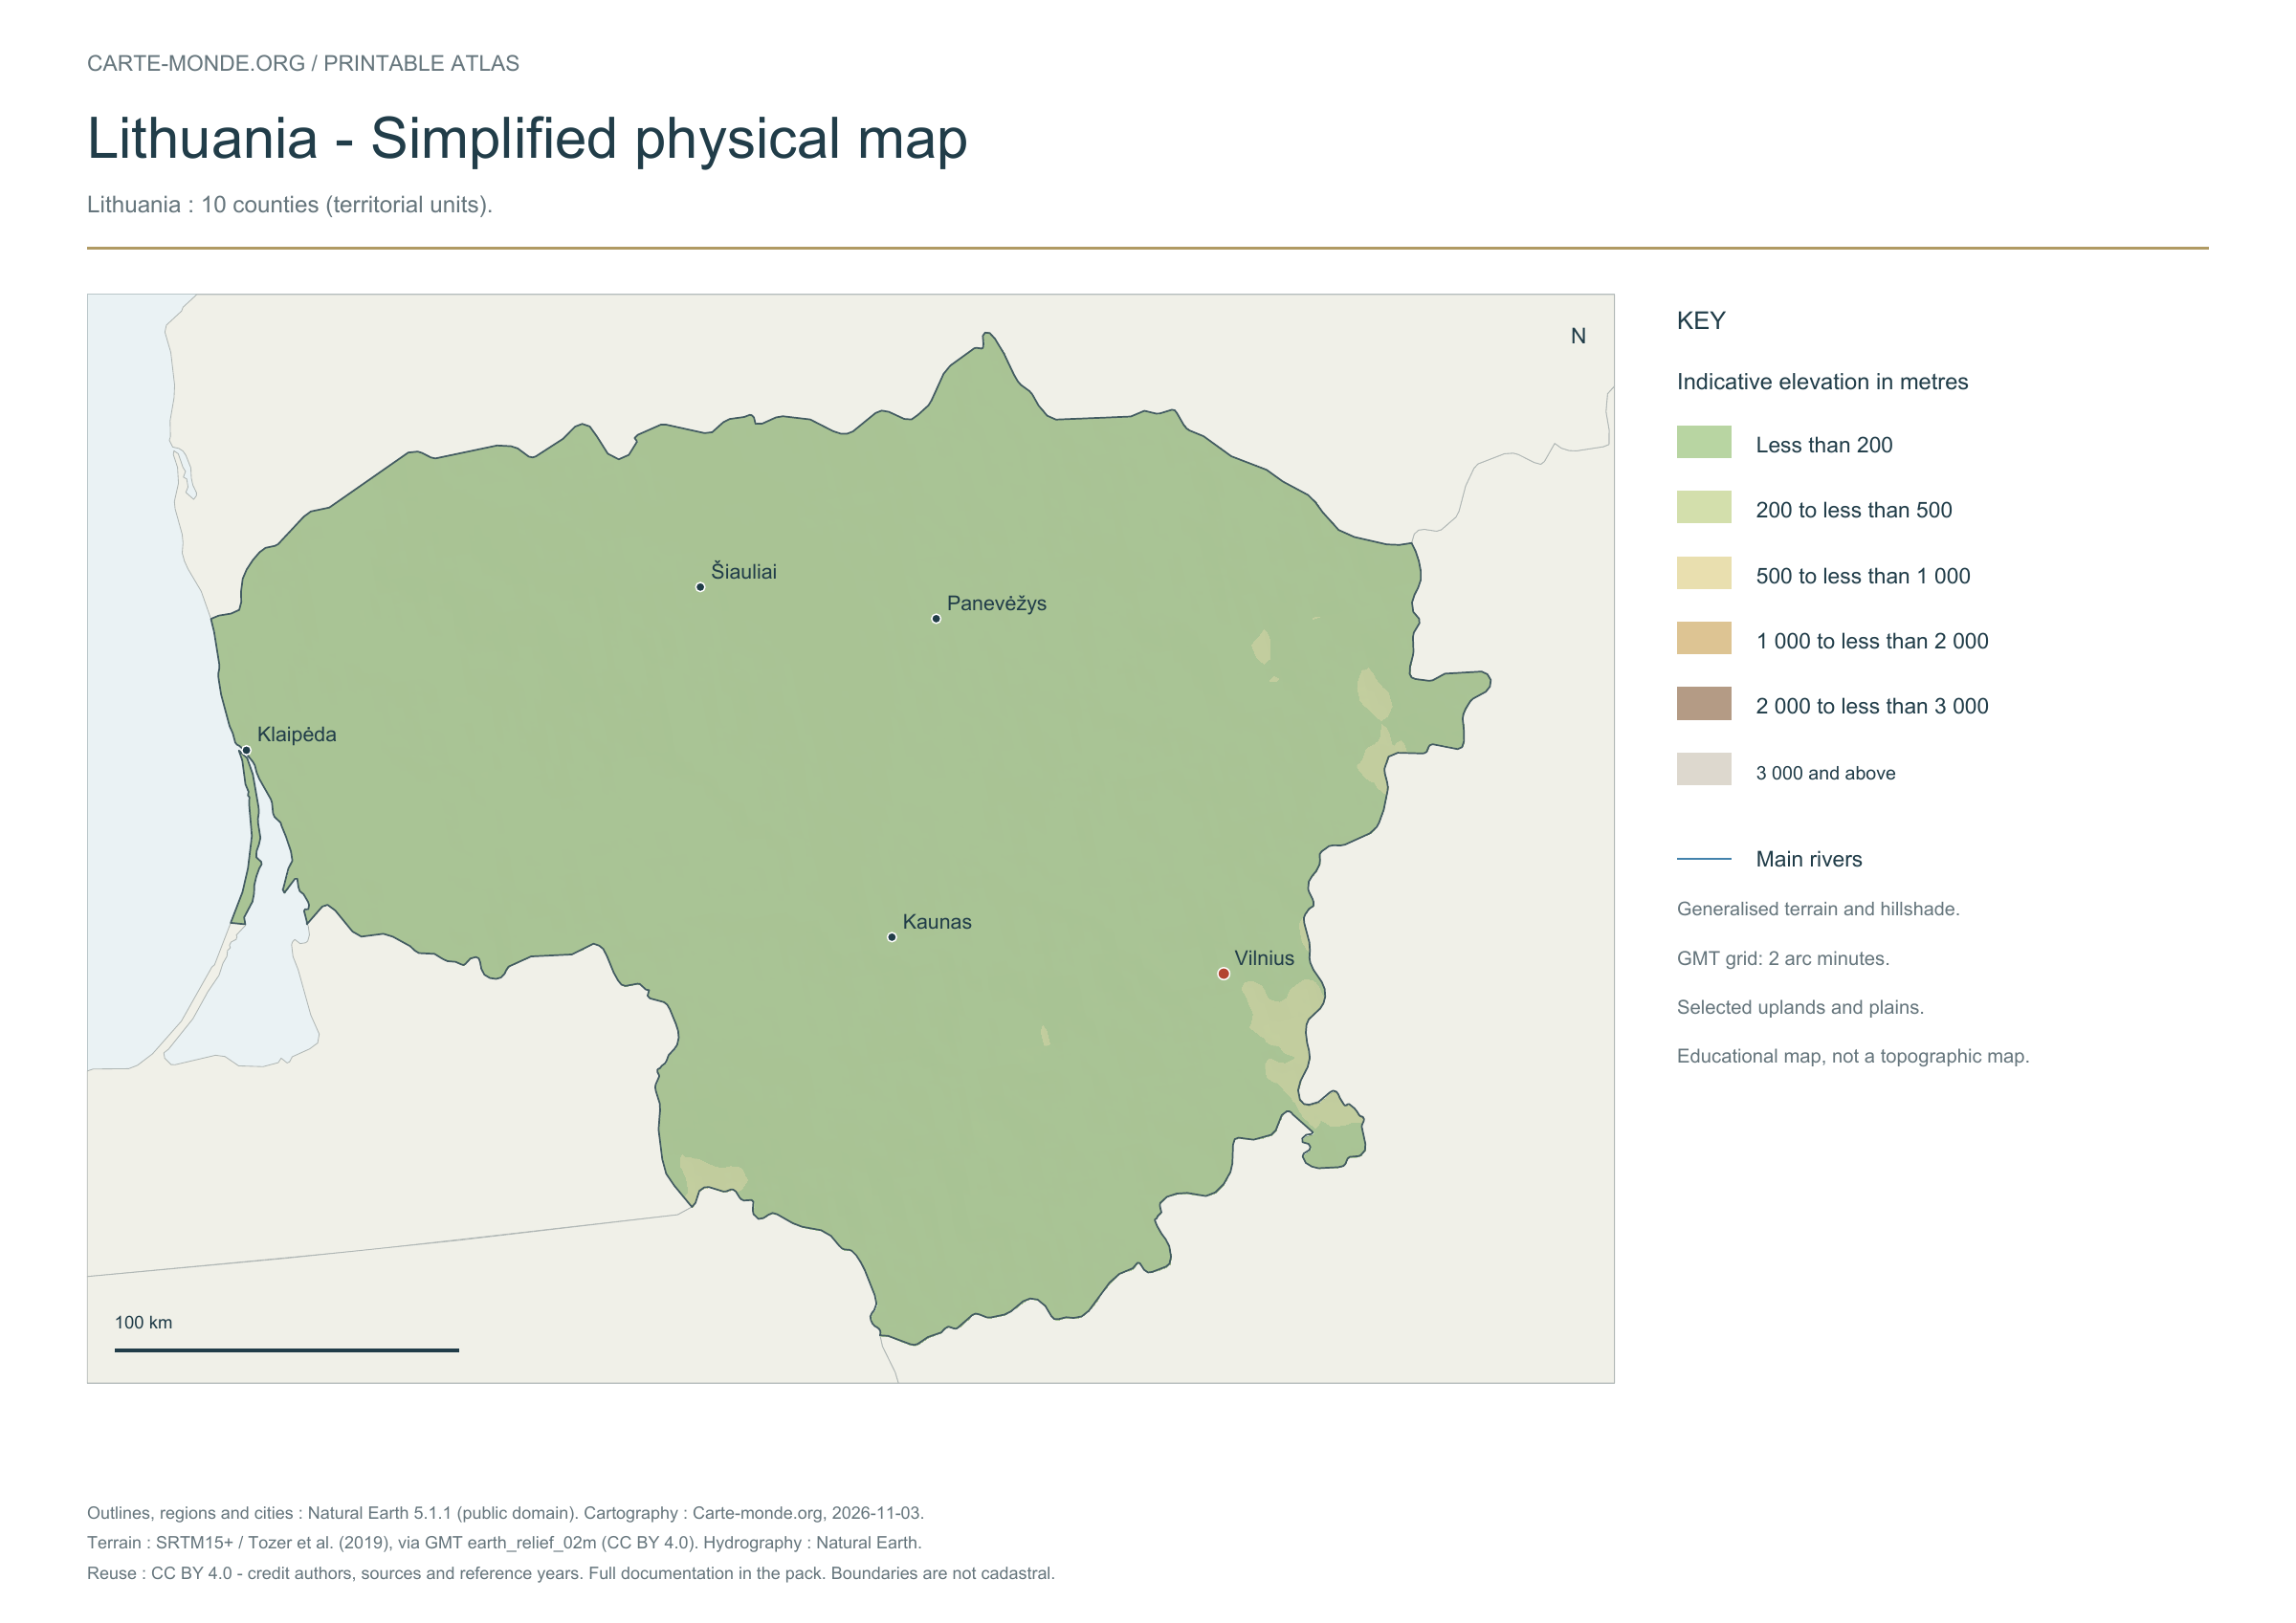
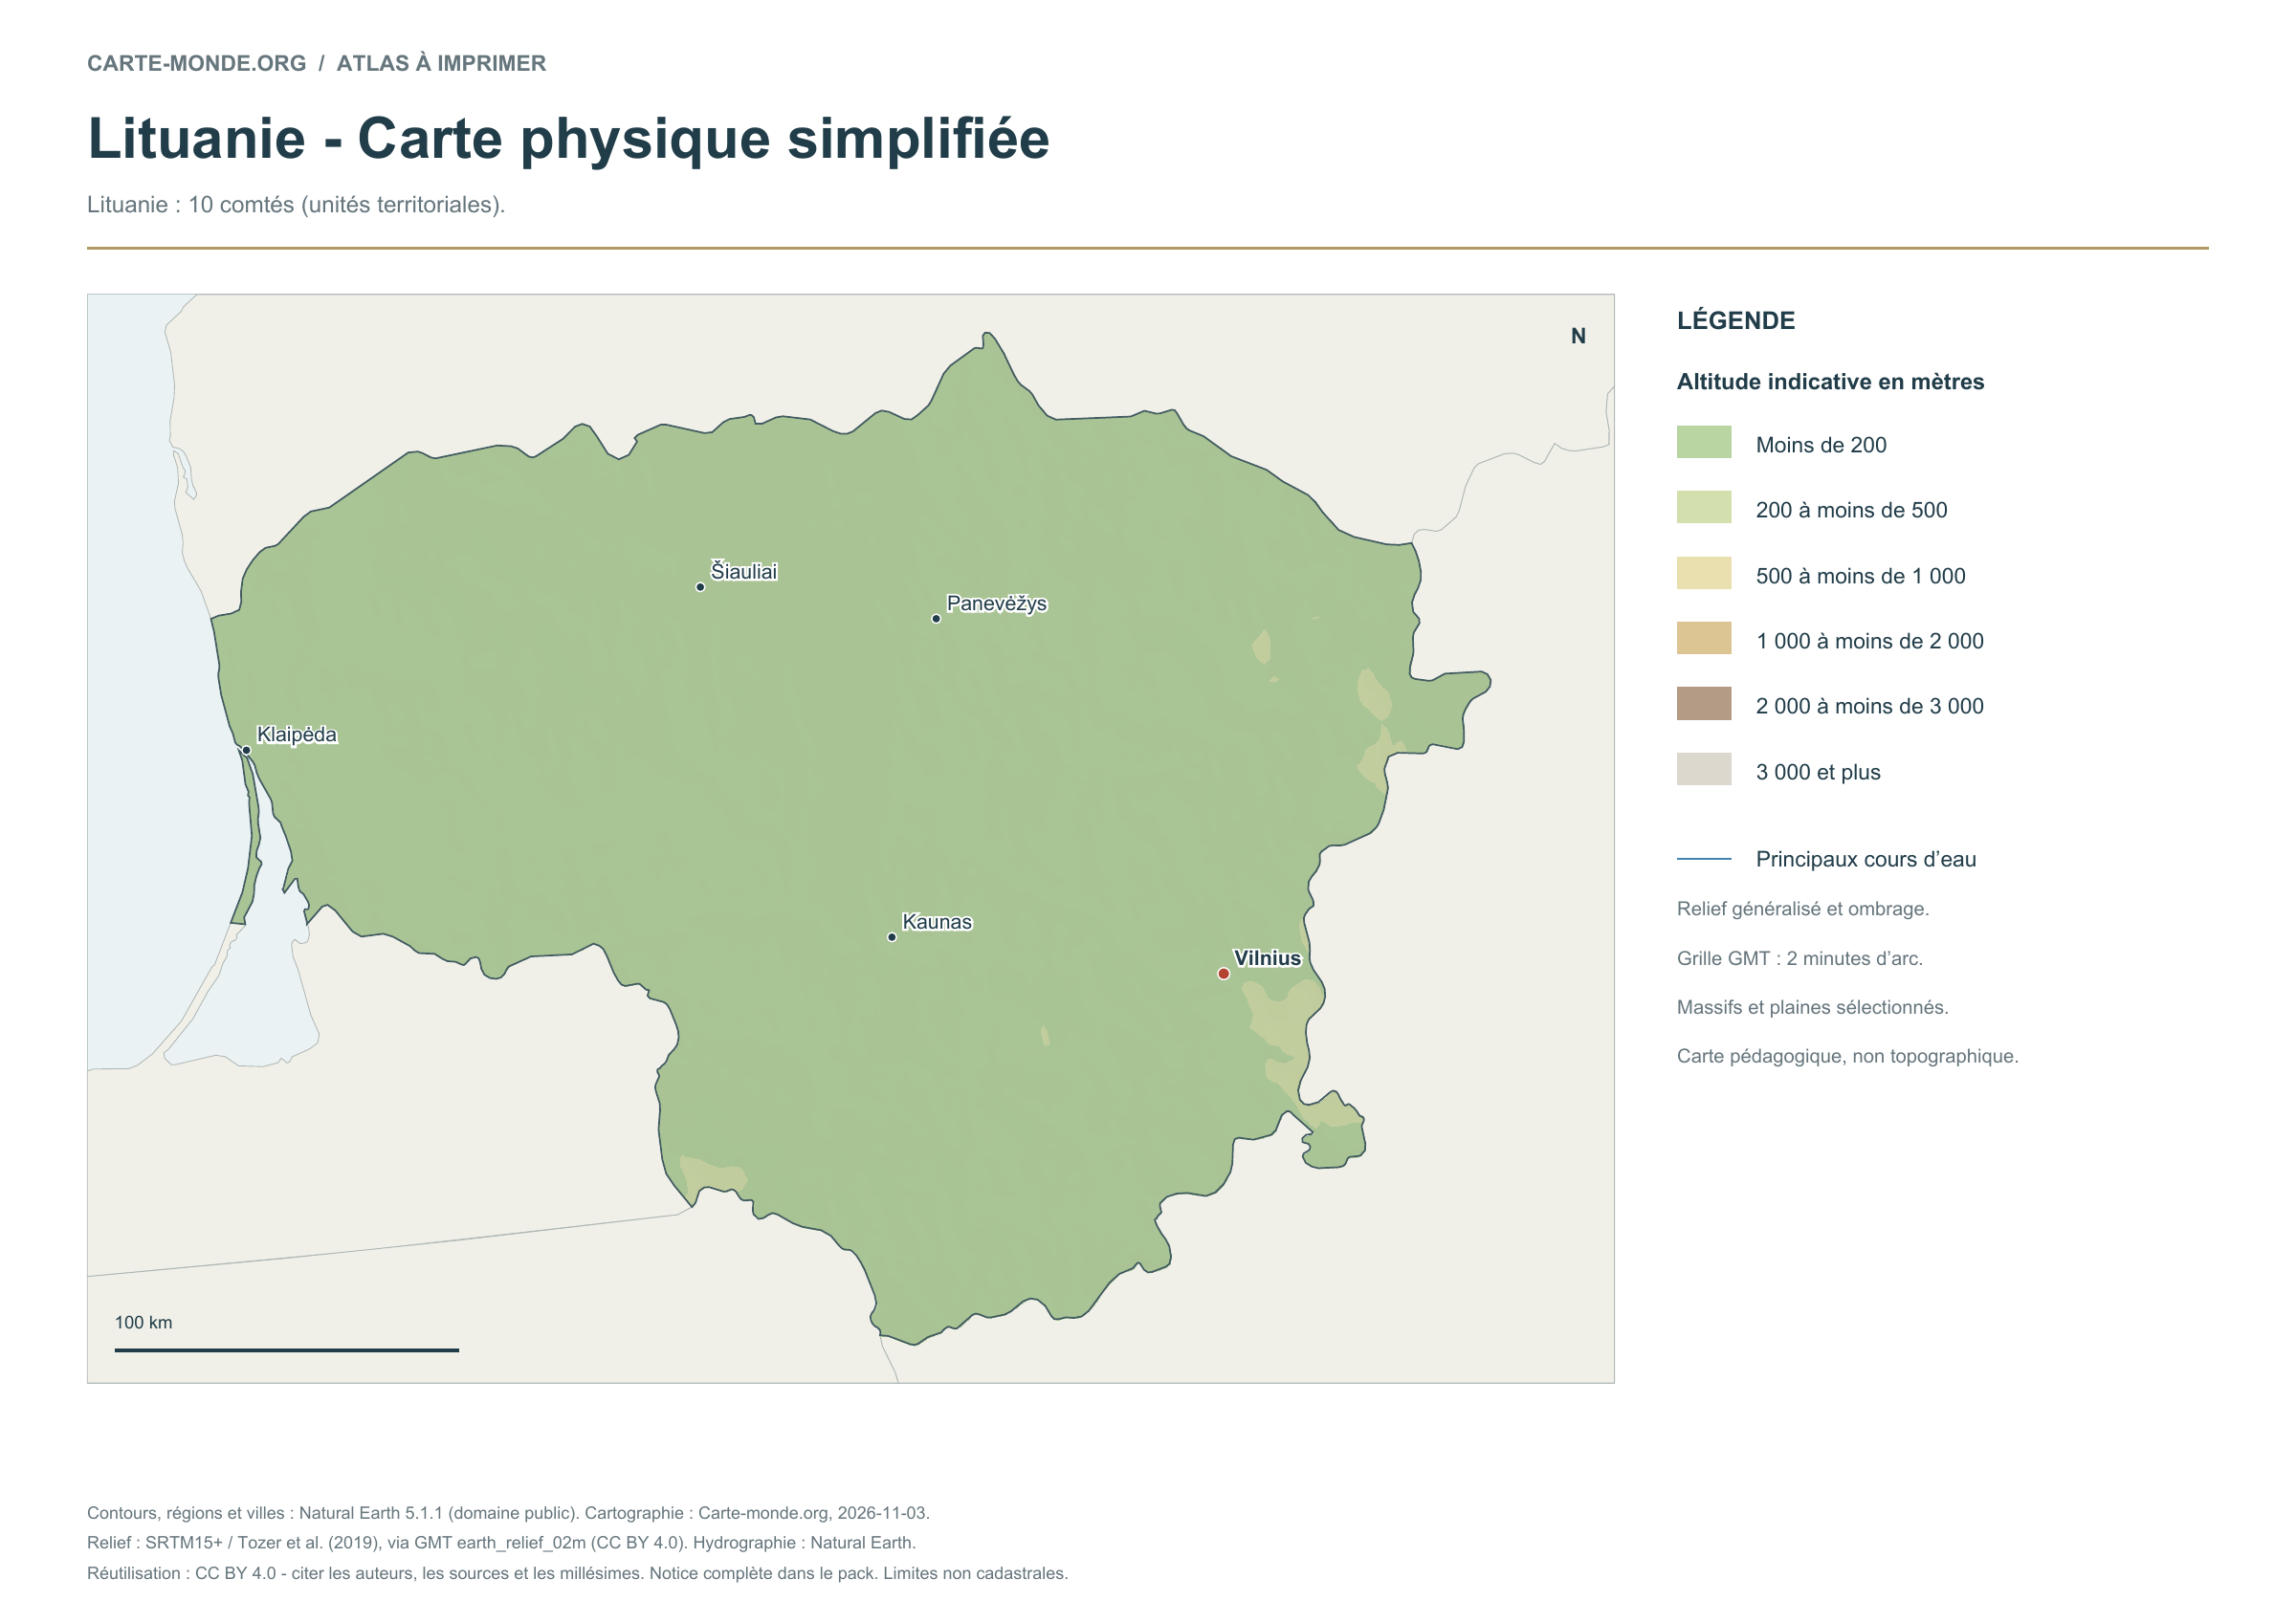
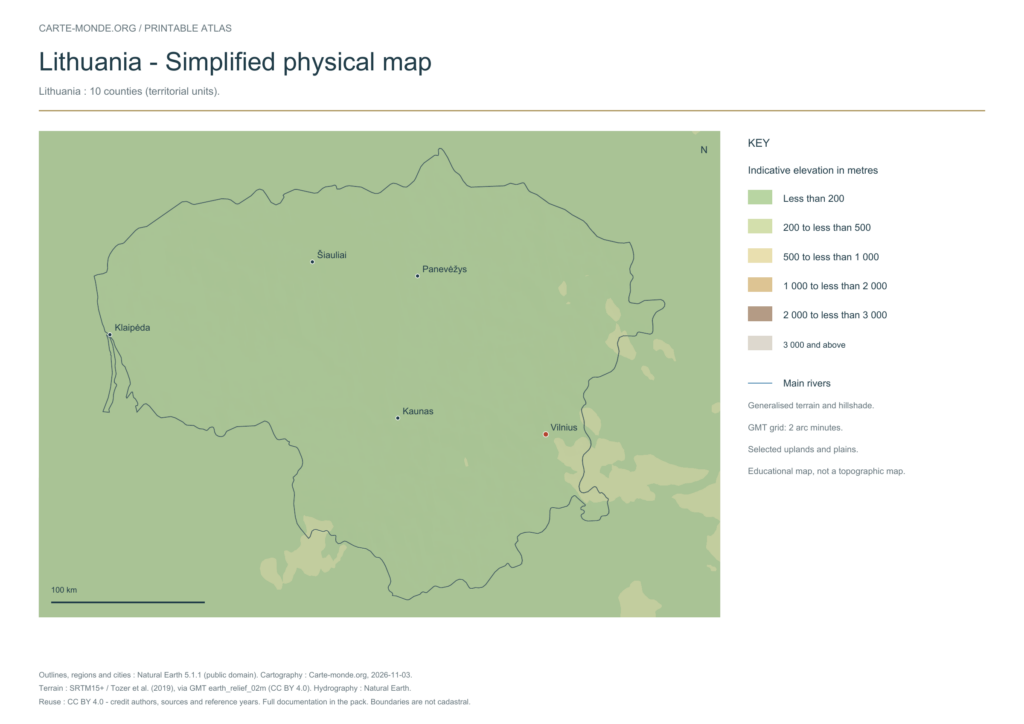
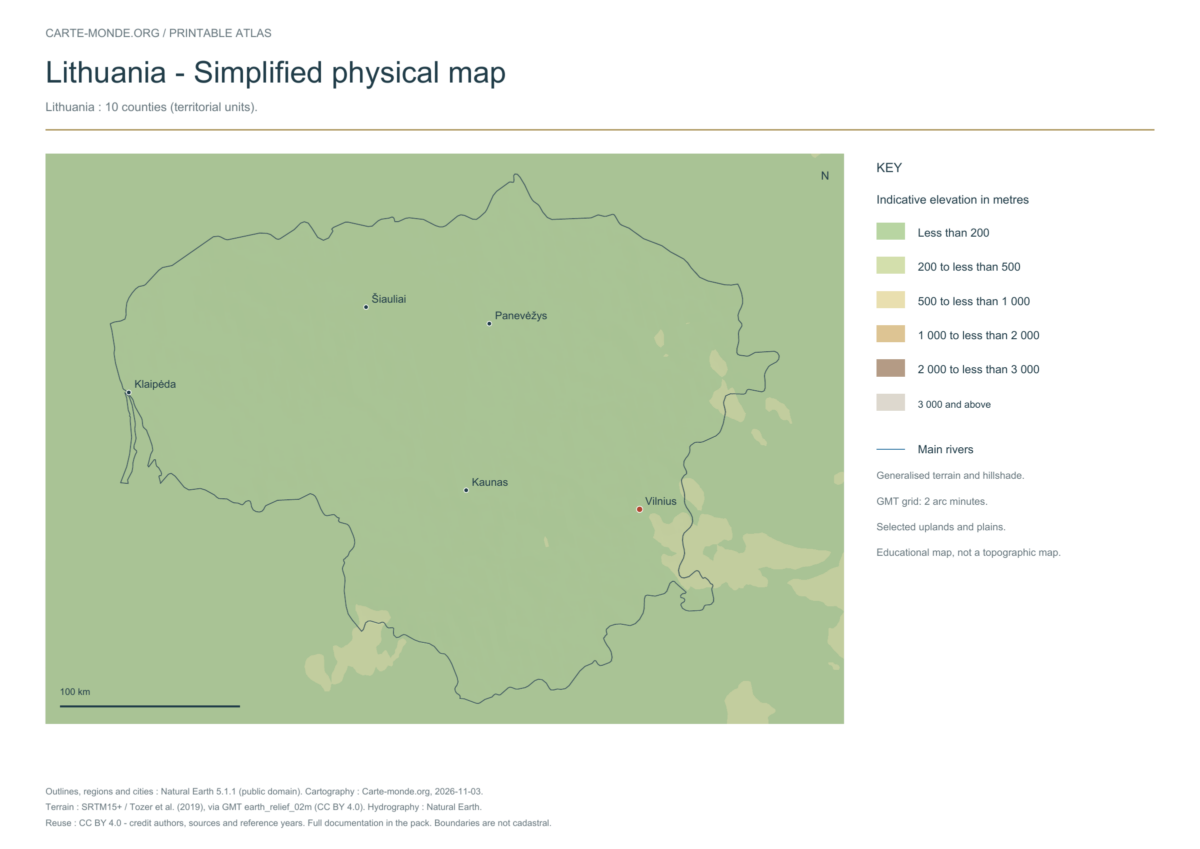
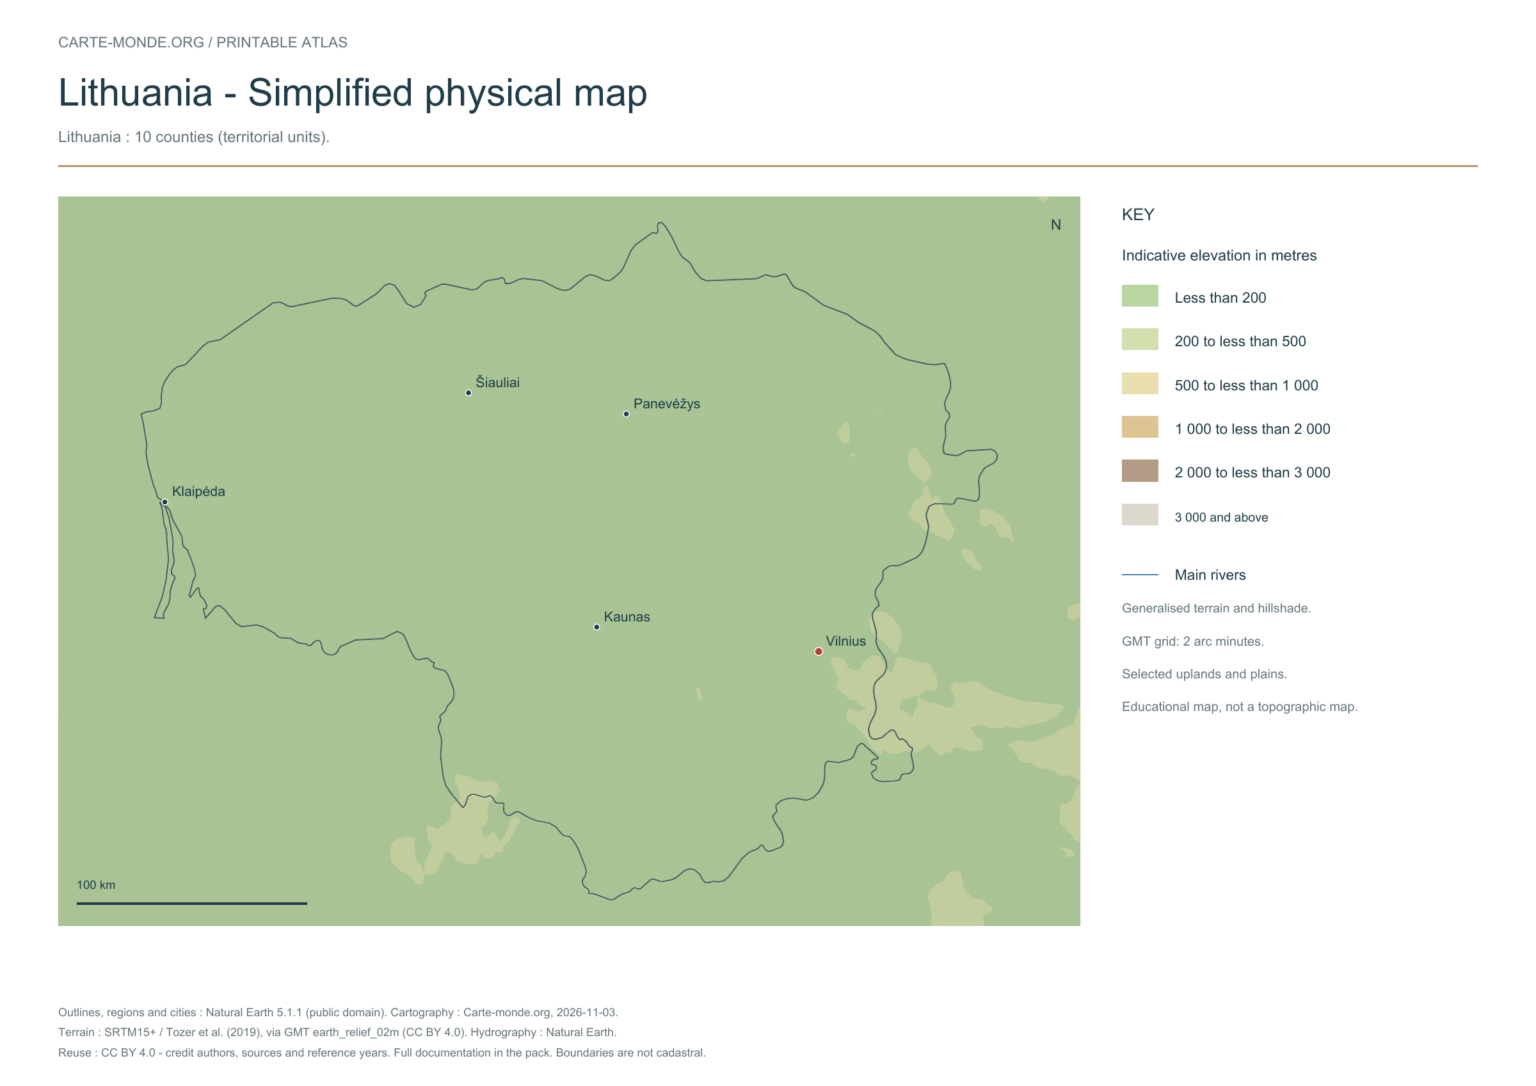
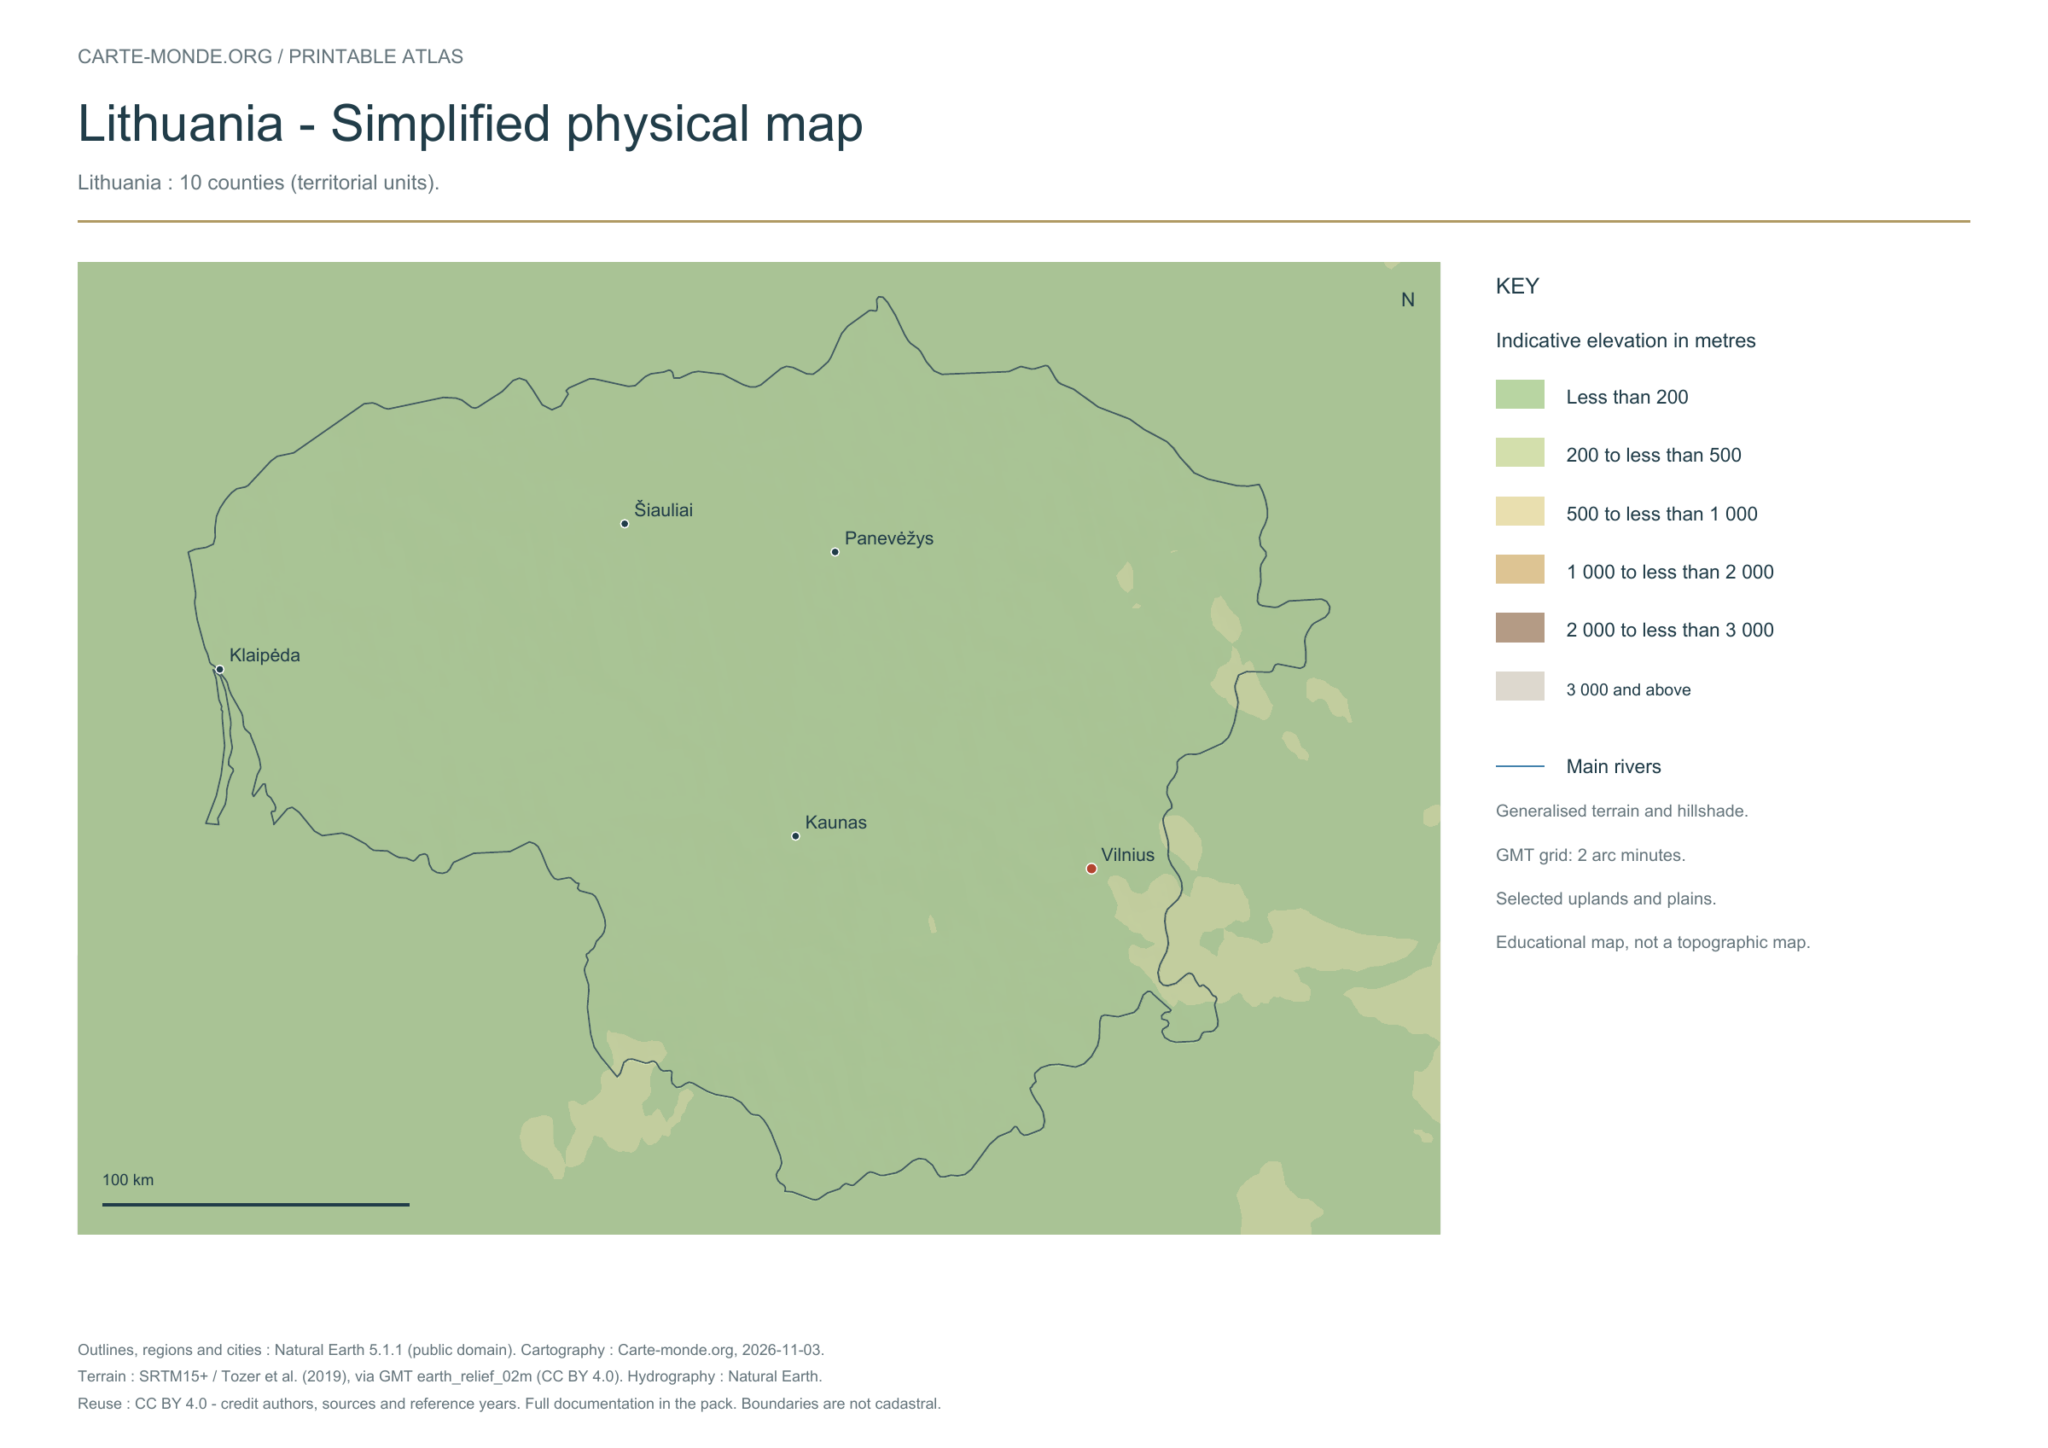
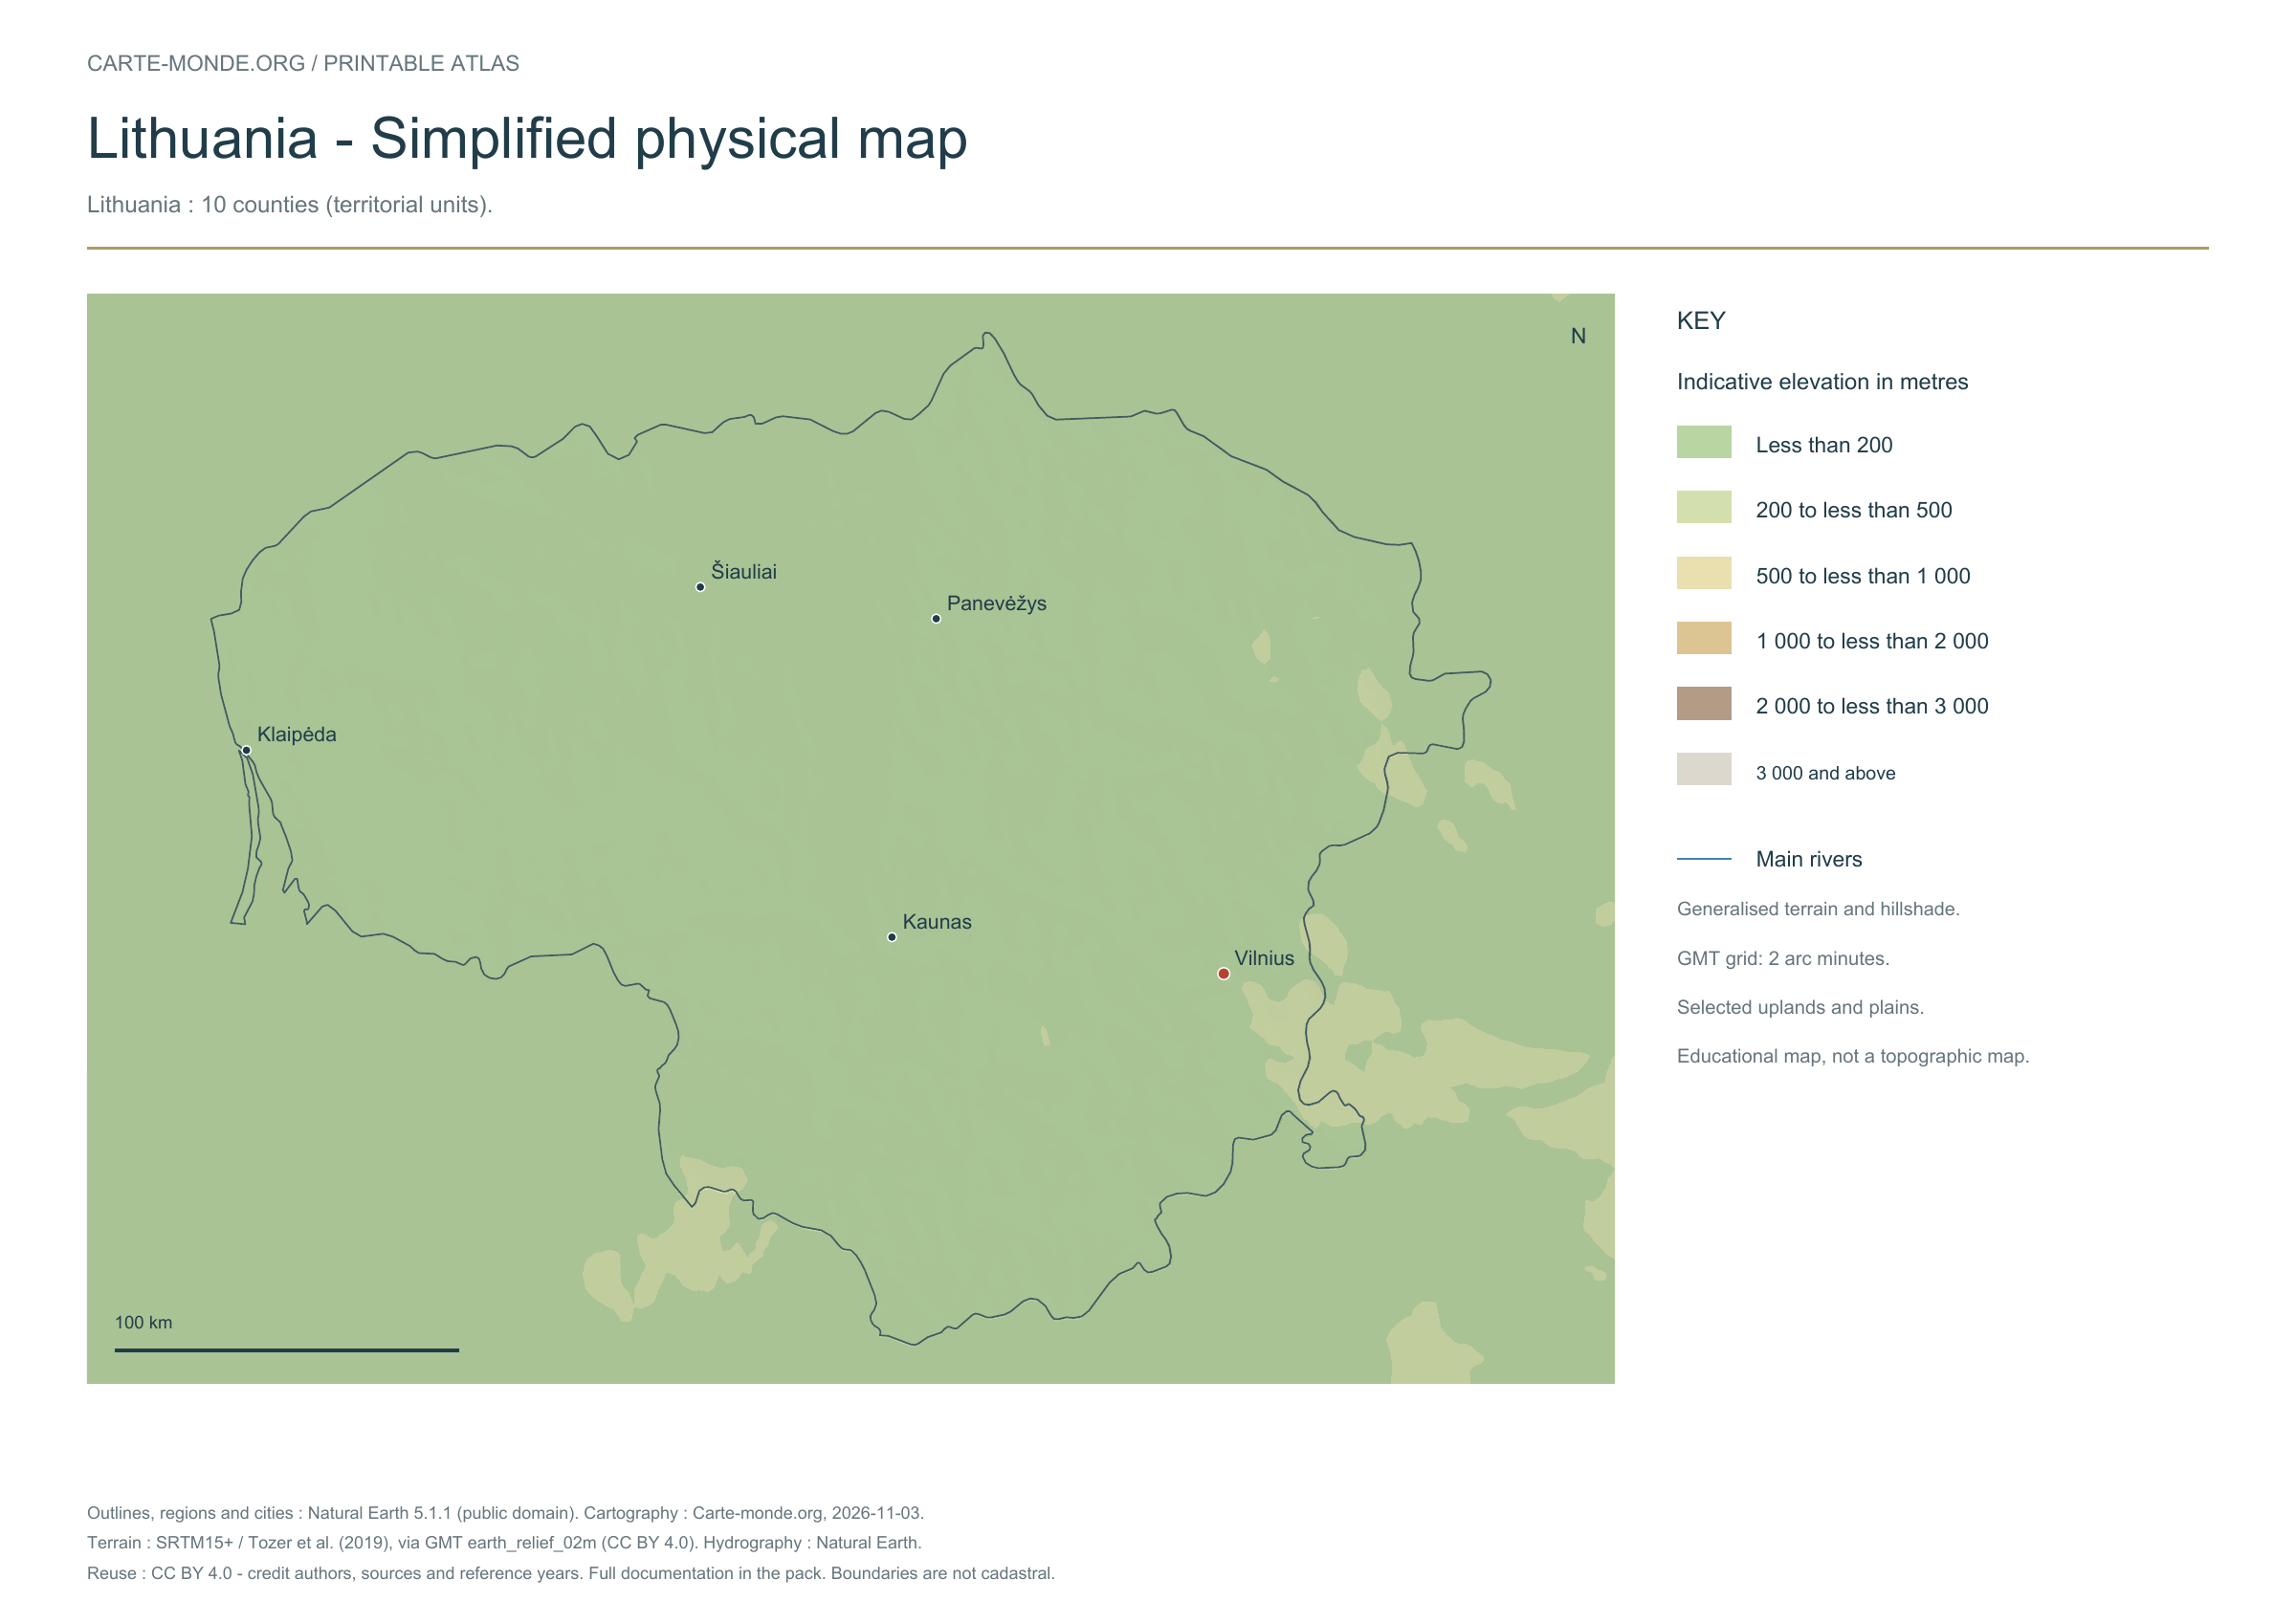
Simplified physical map — Lithuania

Carte-monde.org · November 2026

Simplified elevations

Smoothed relief, elevation colours, main mountain ranges, plains and watercourses. Educational map at national scale.

A4 landscape PDF · PNG 2 400 px · CC BY 4.0

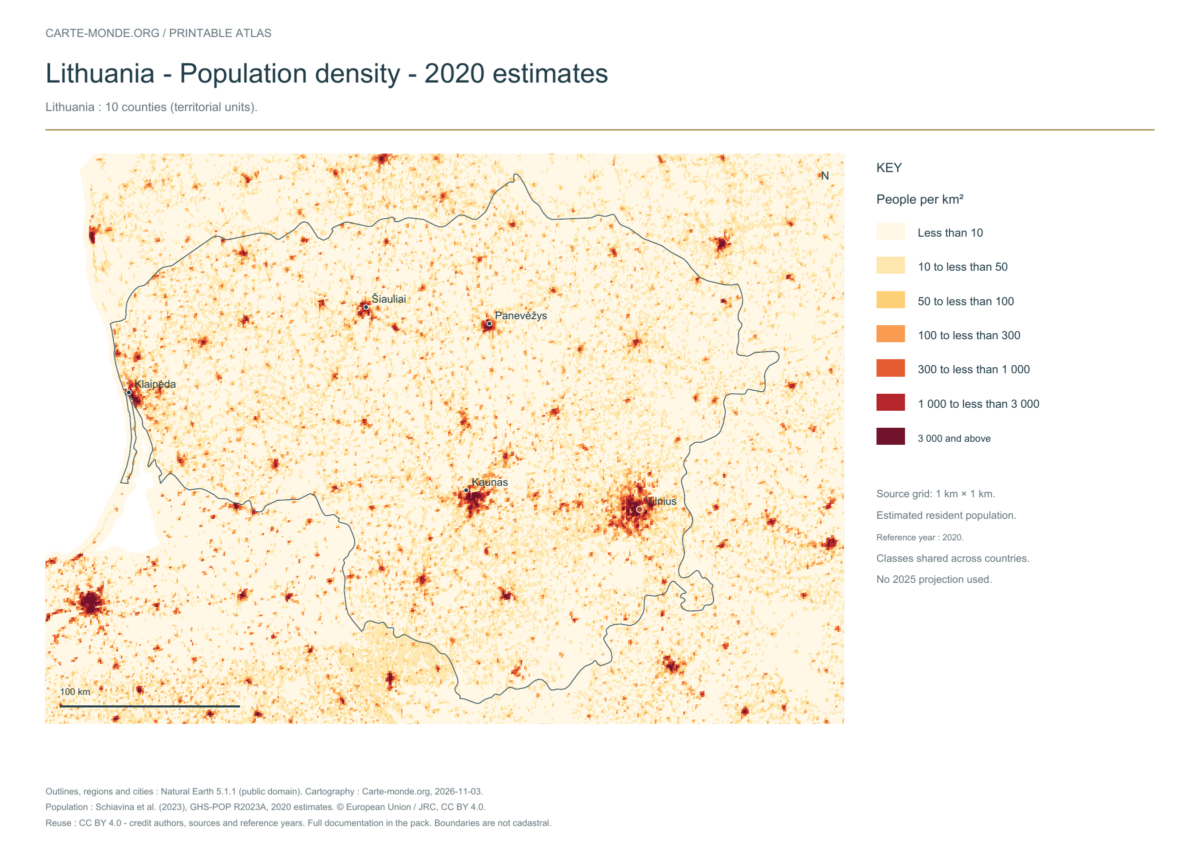
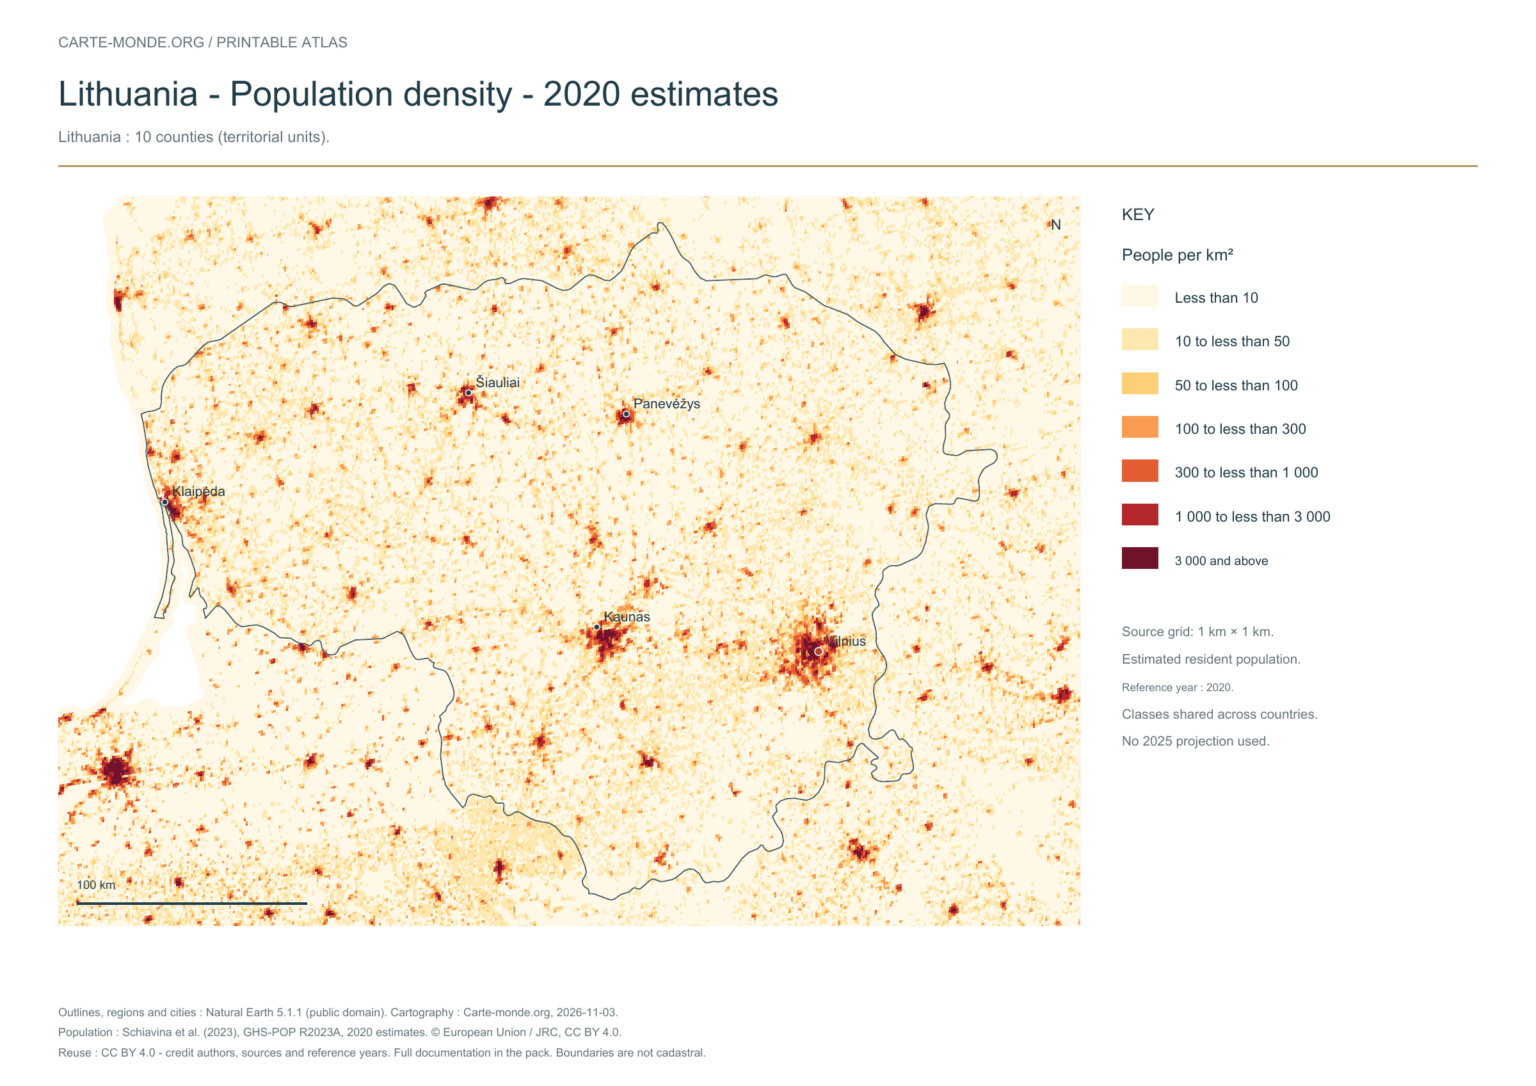
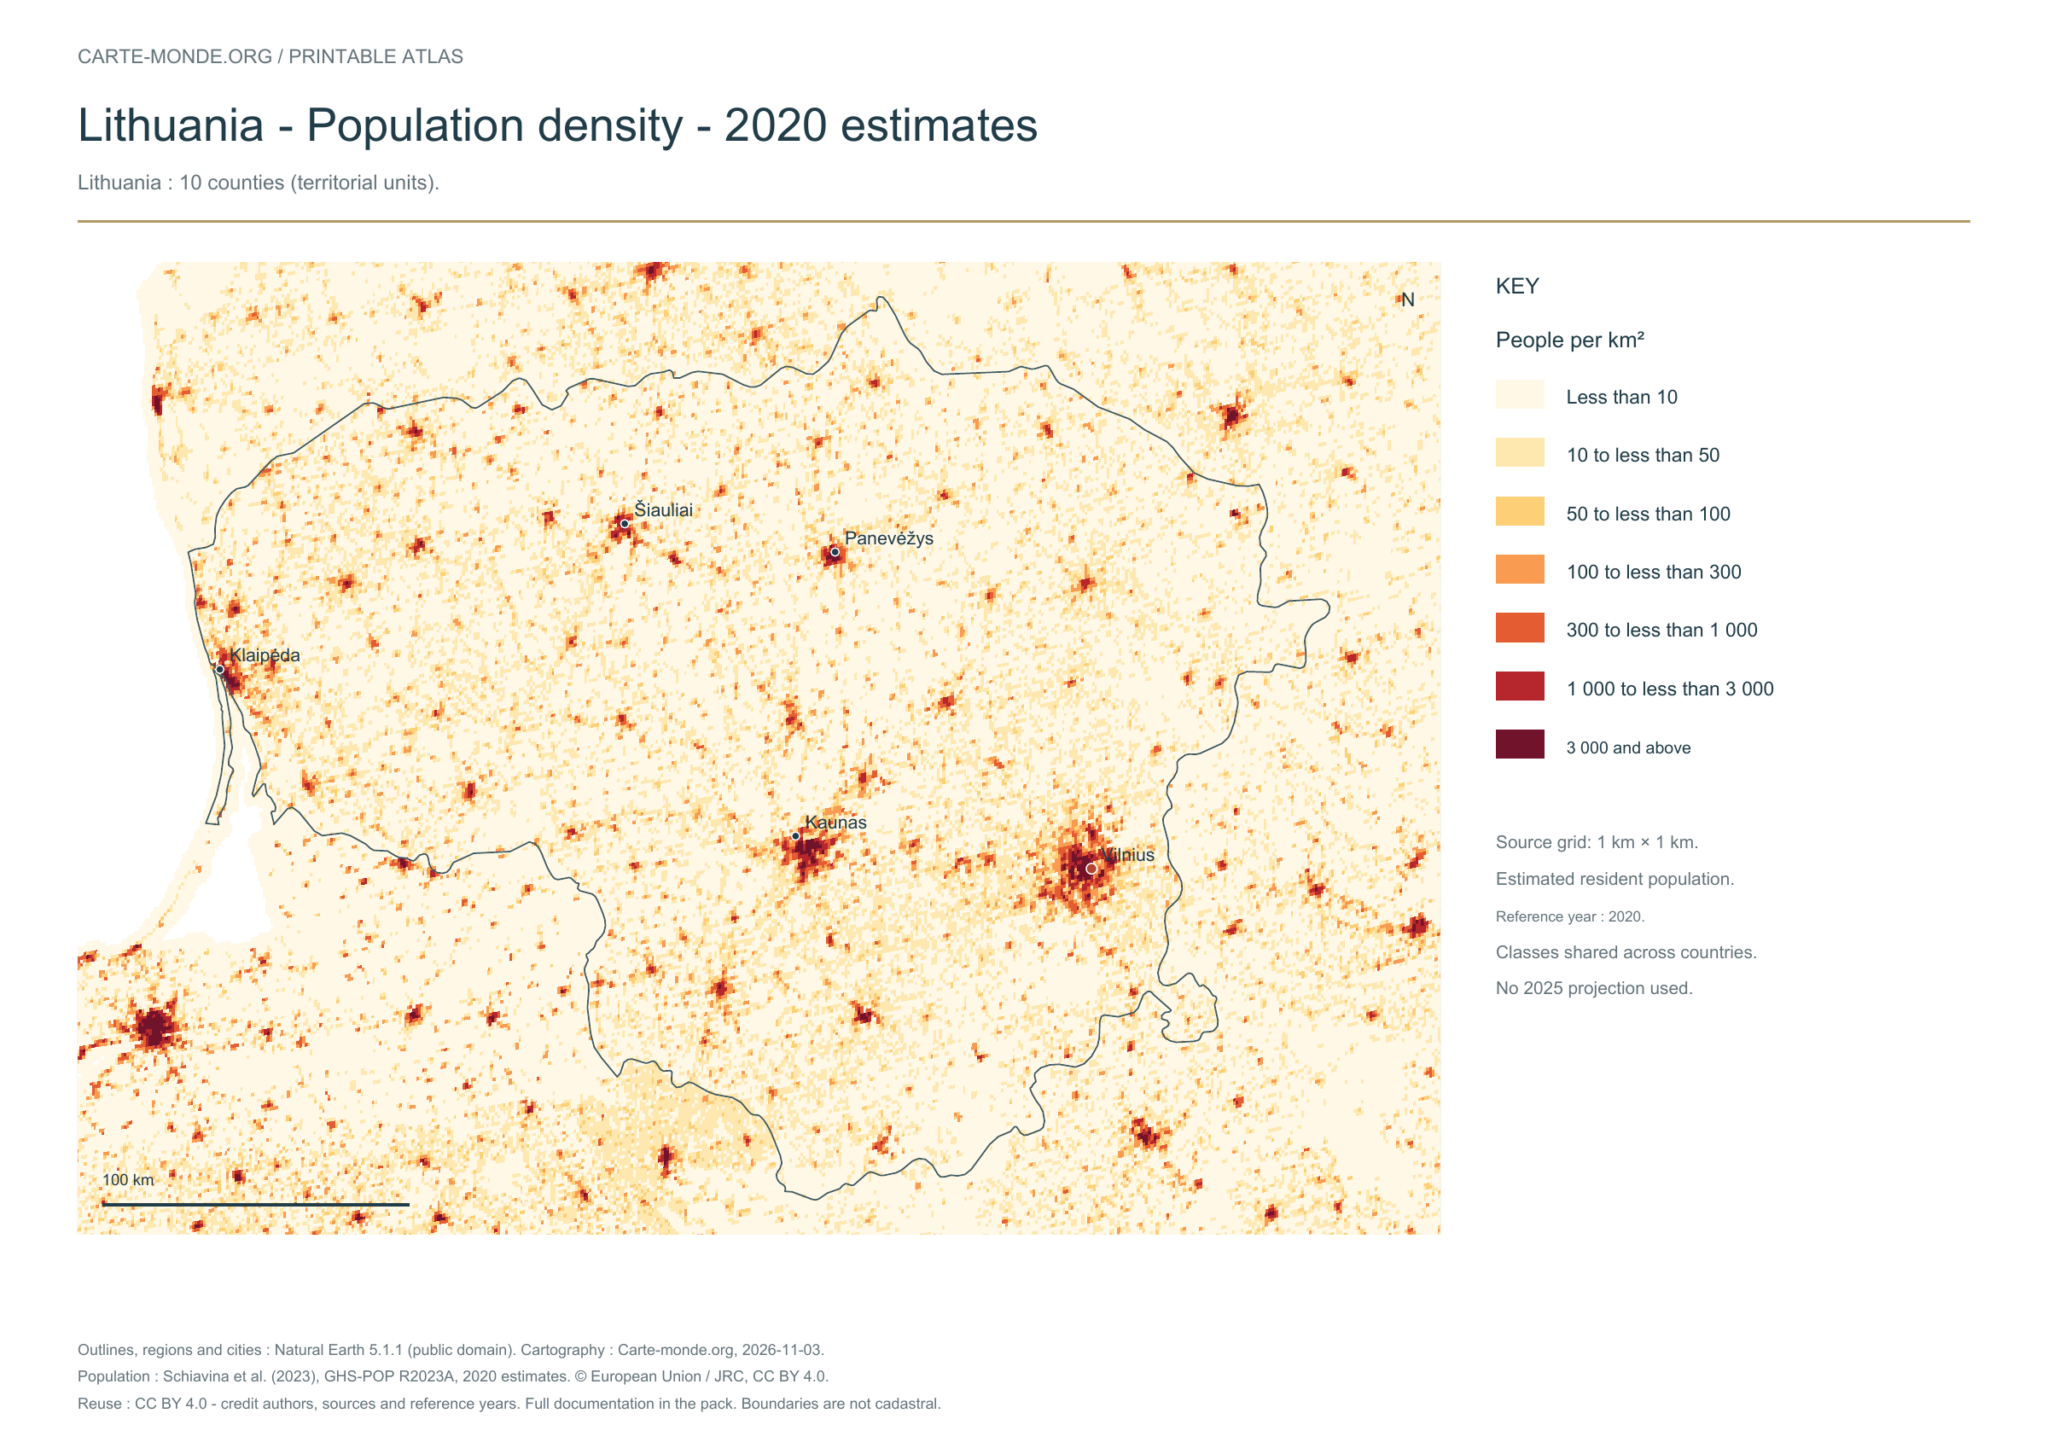
Population density: 2020 estimates

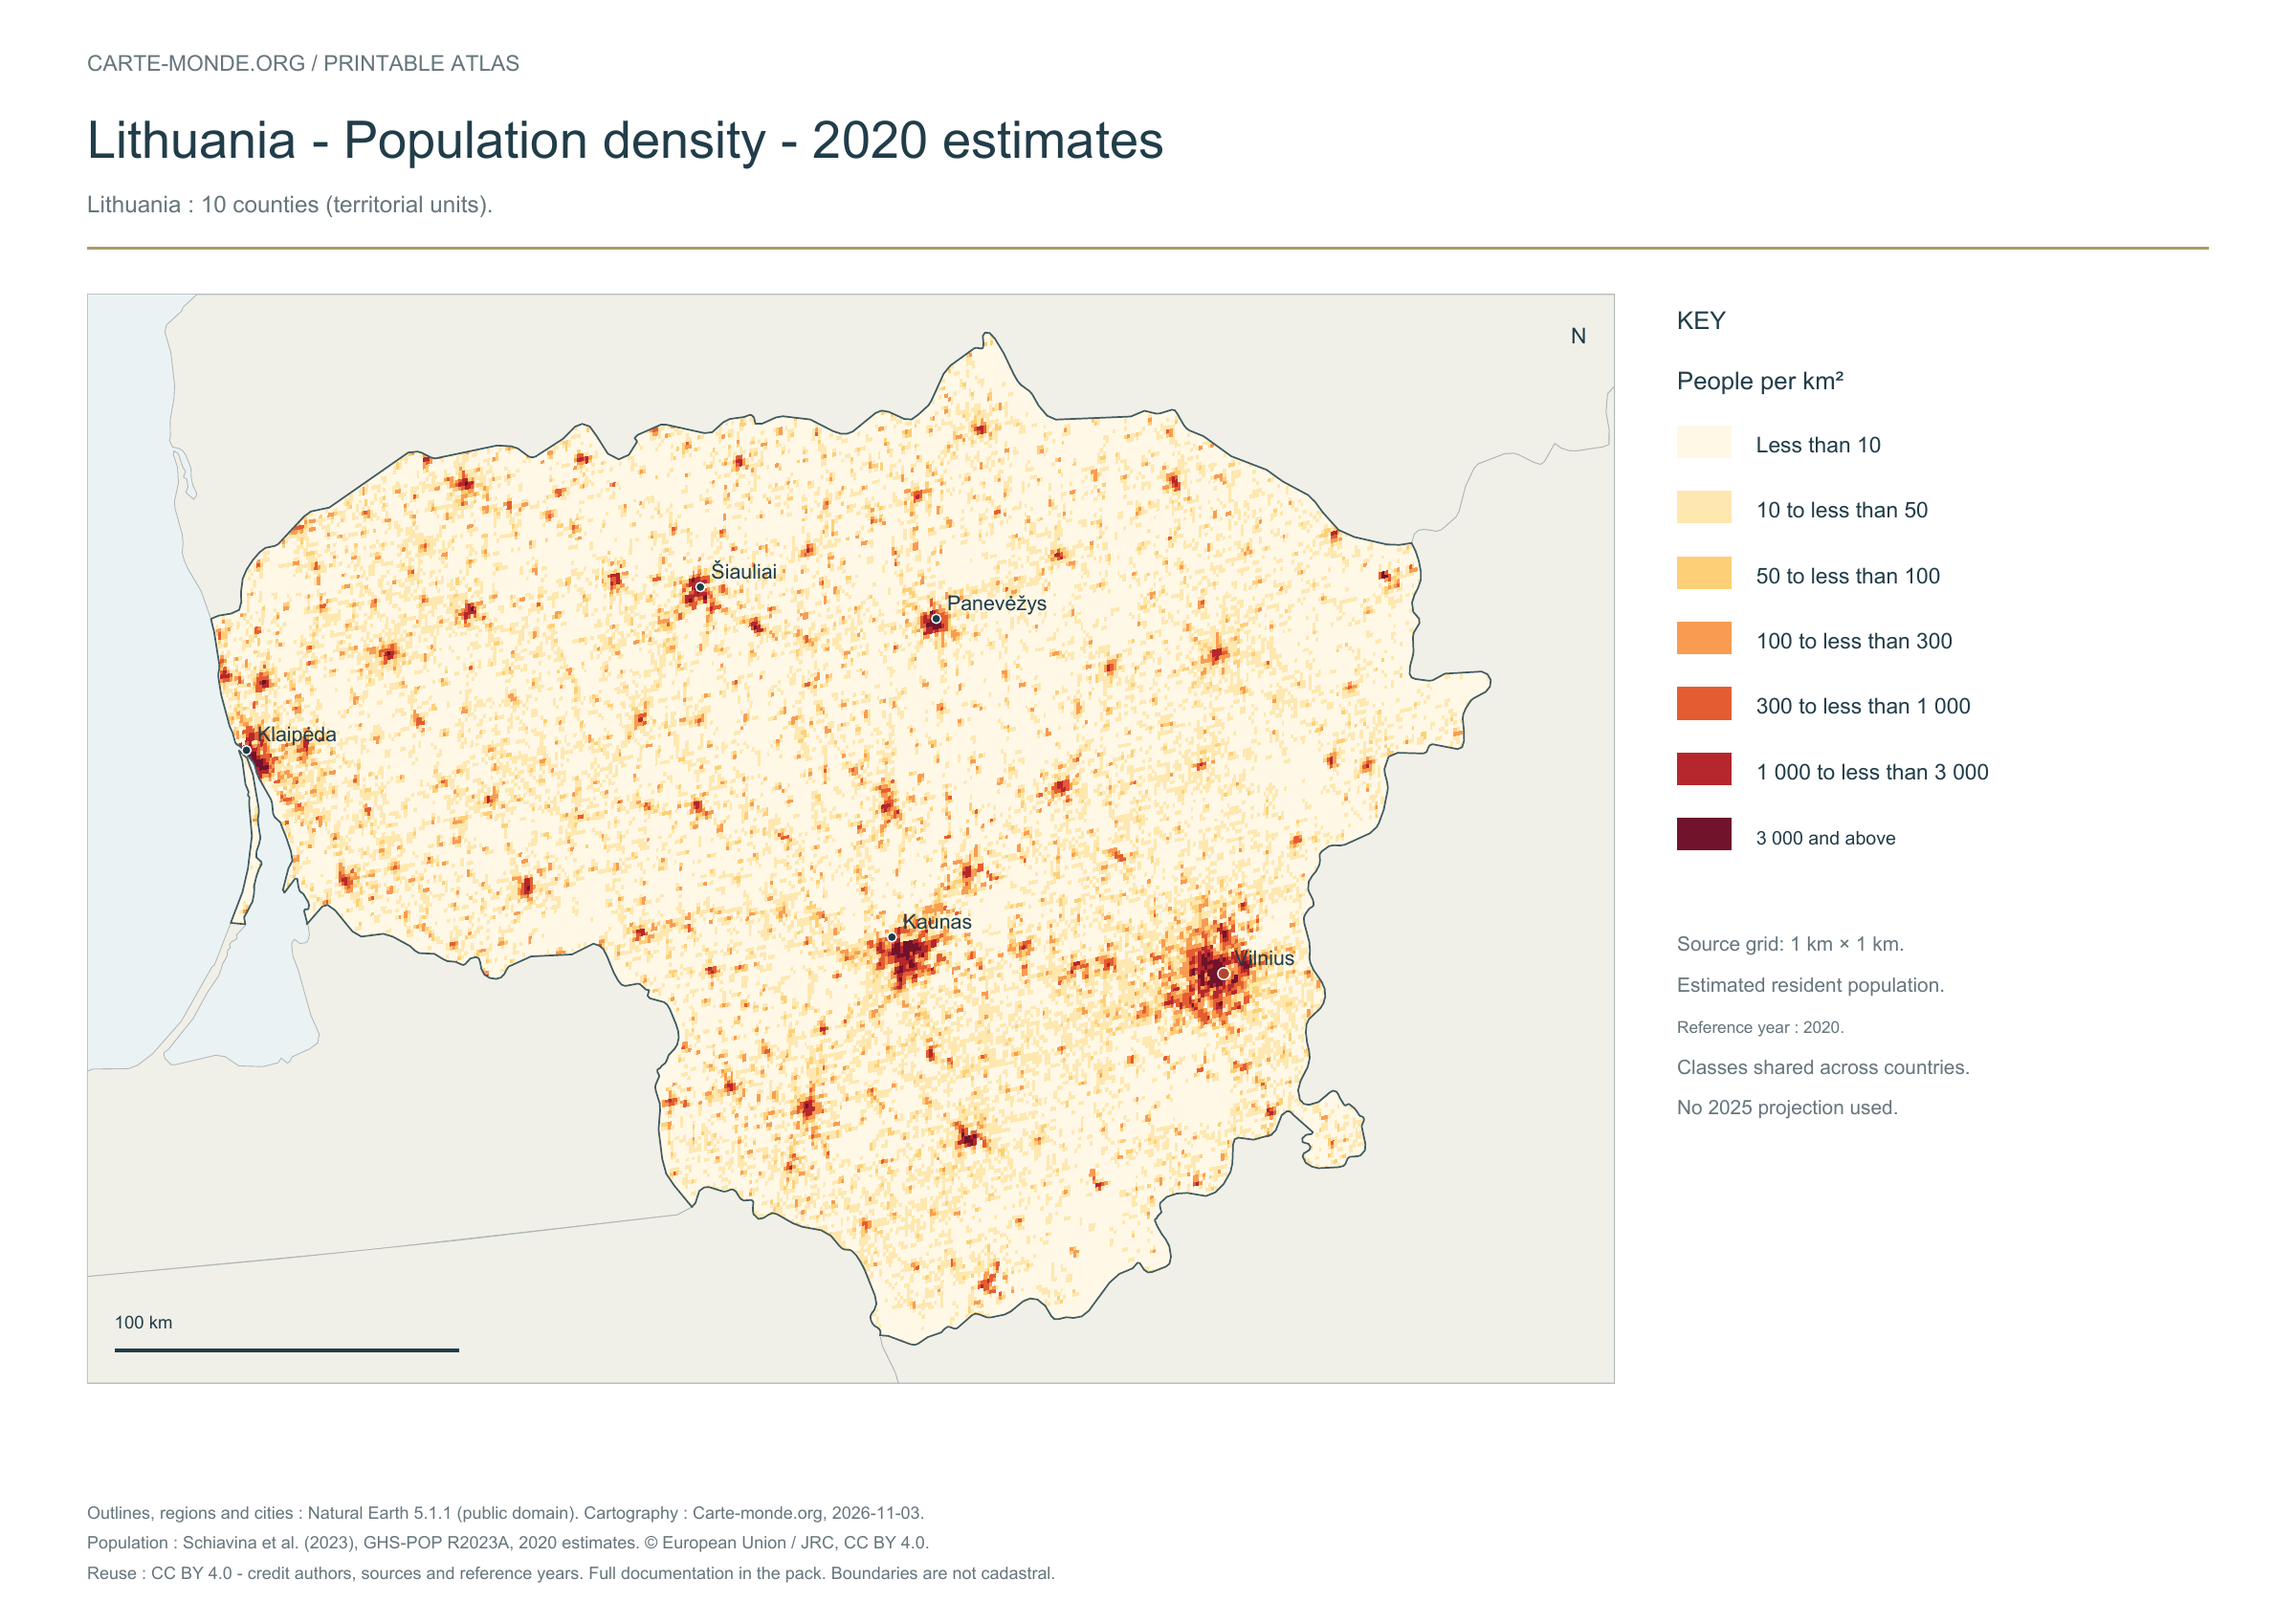
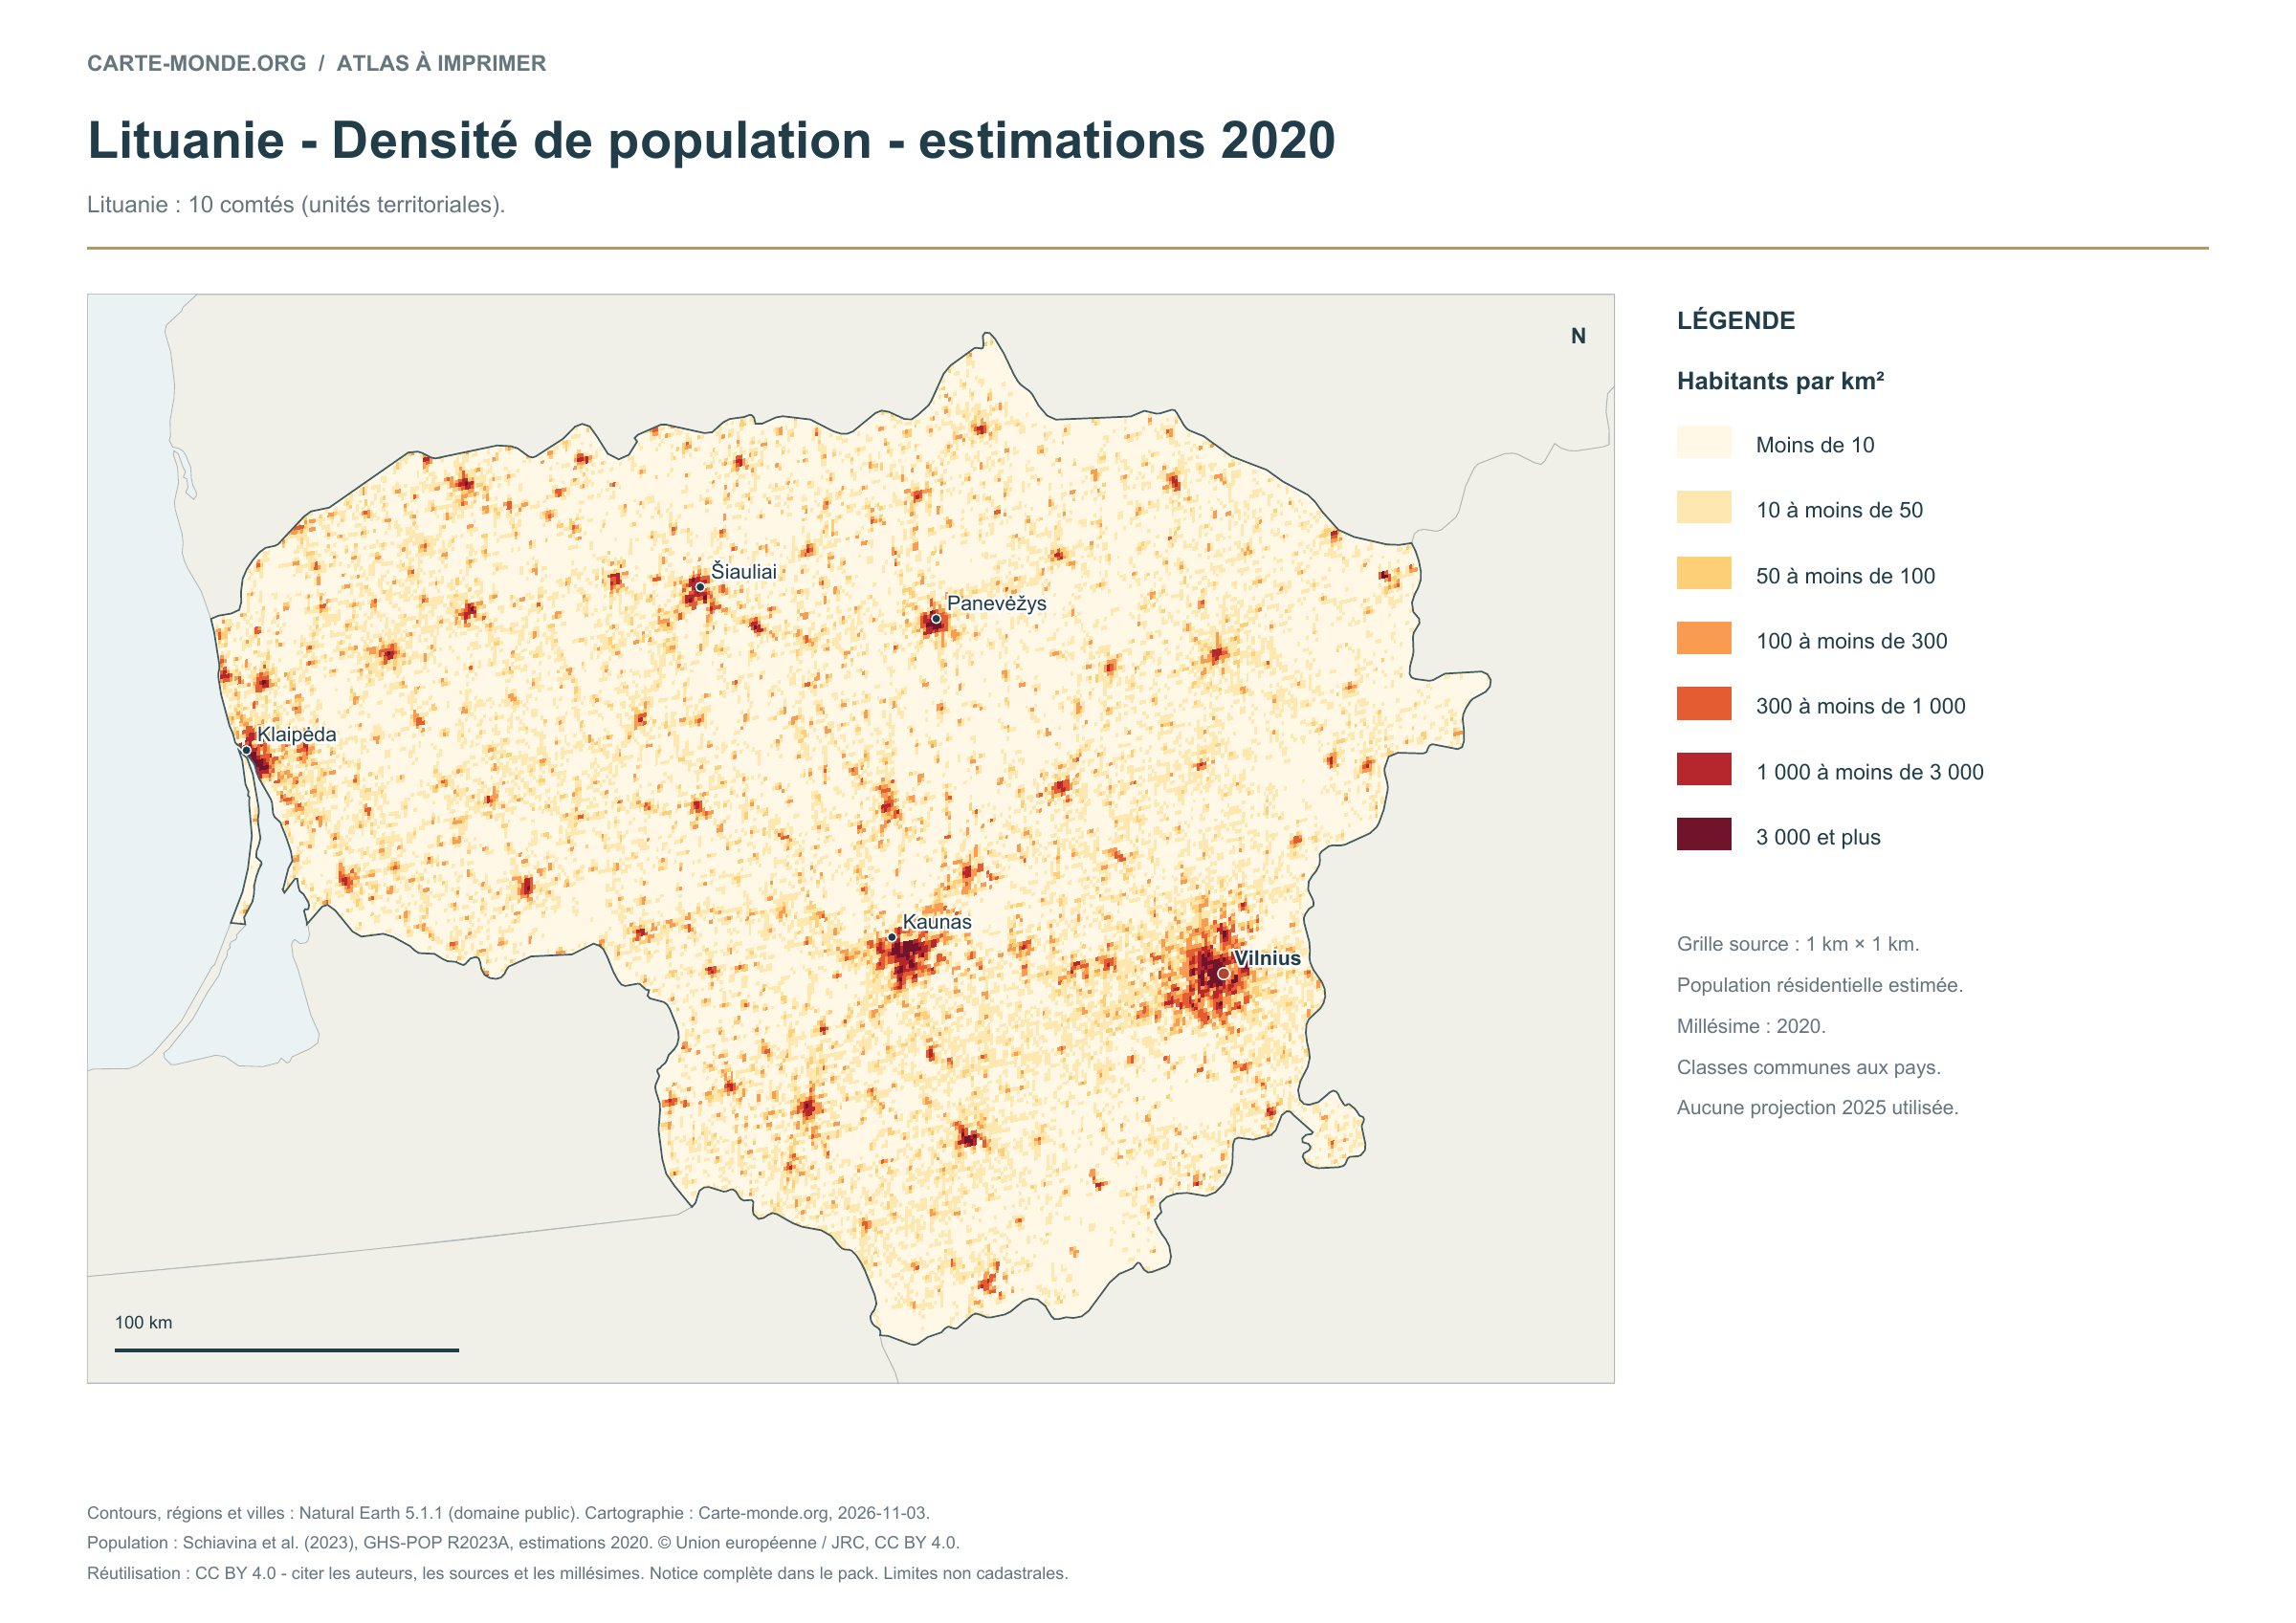
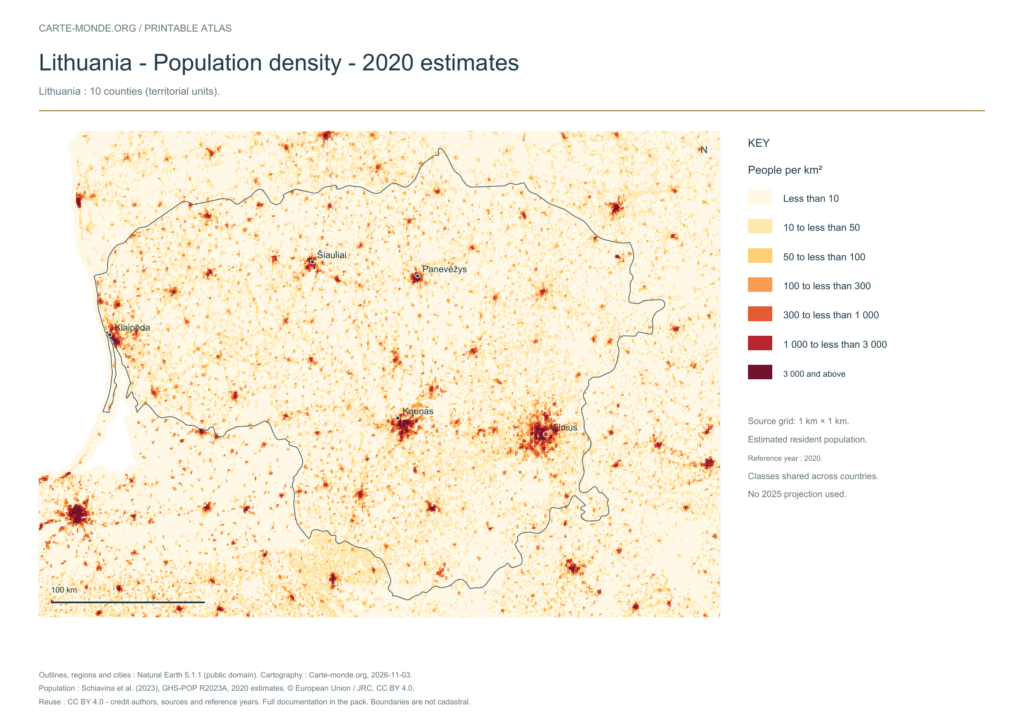
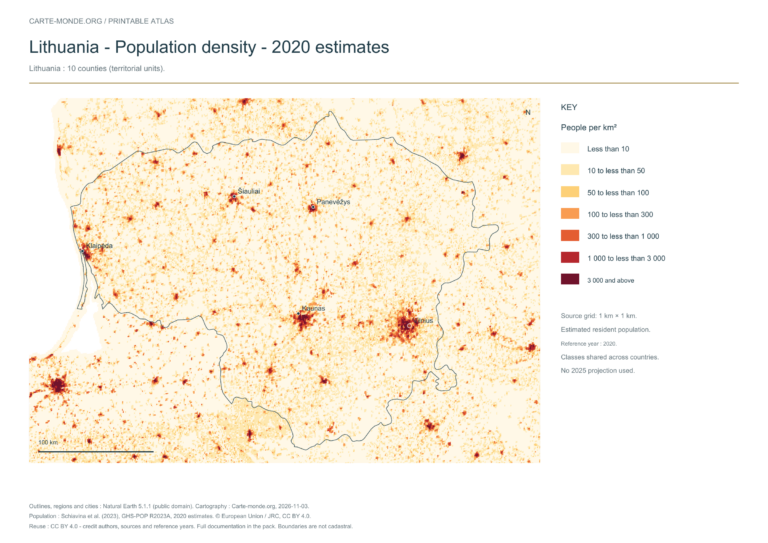
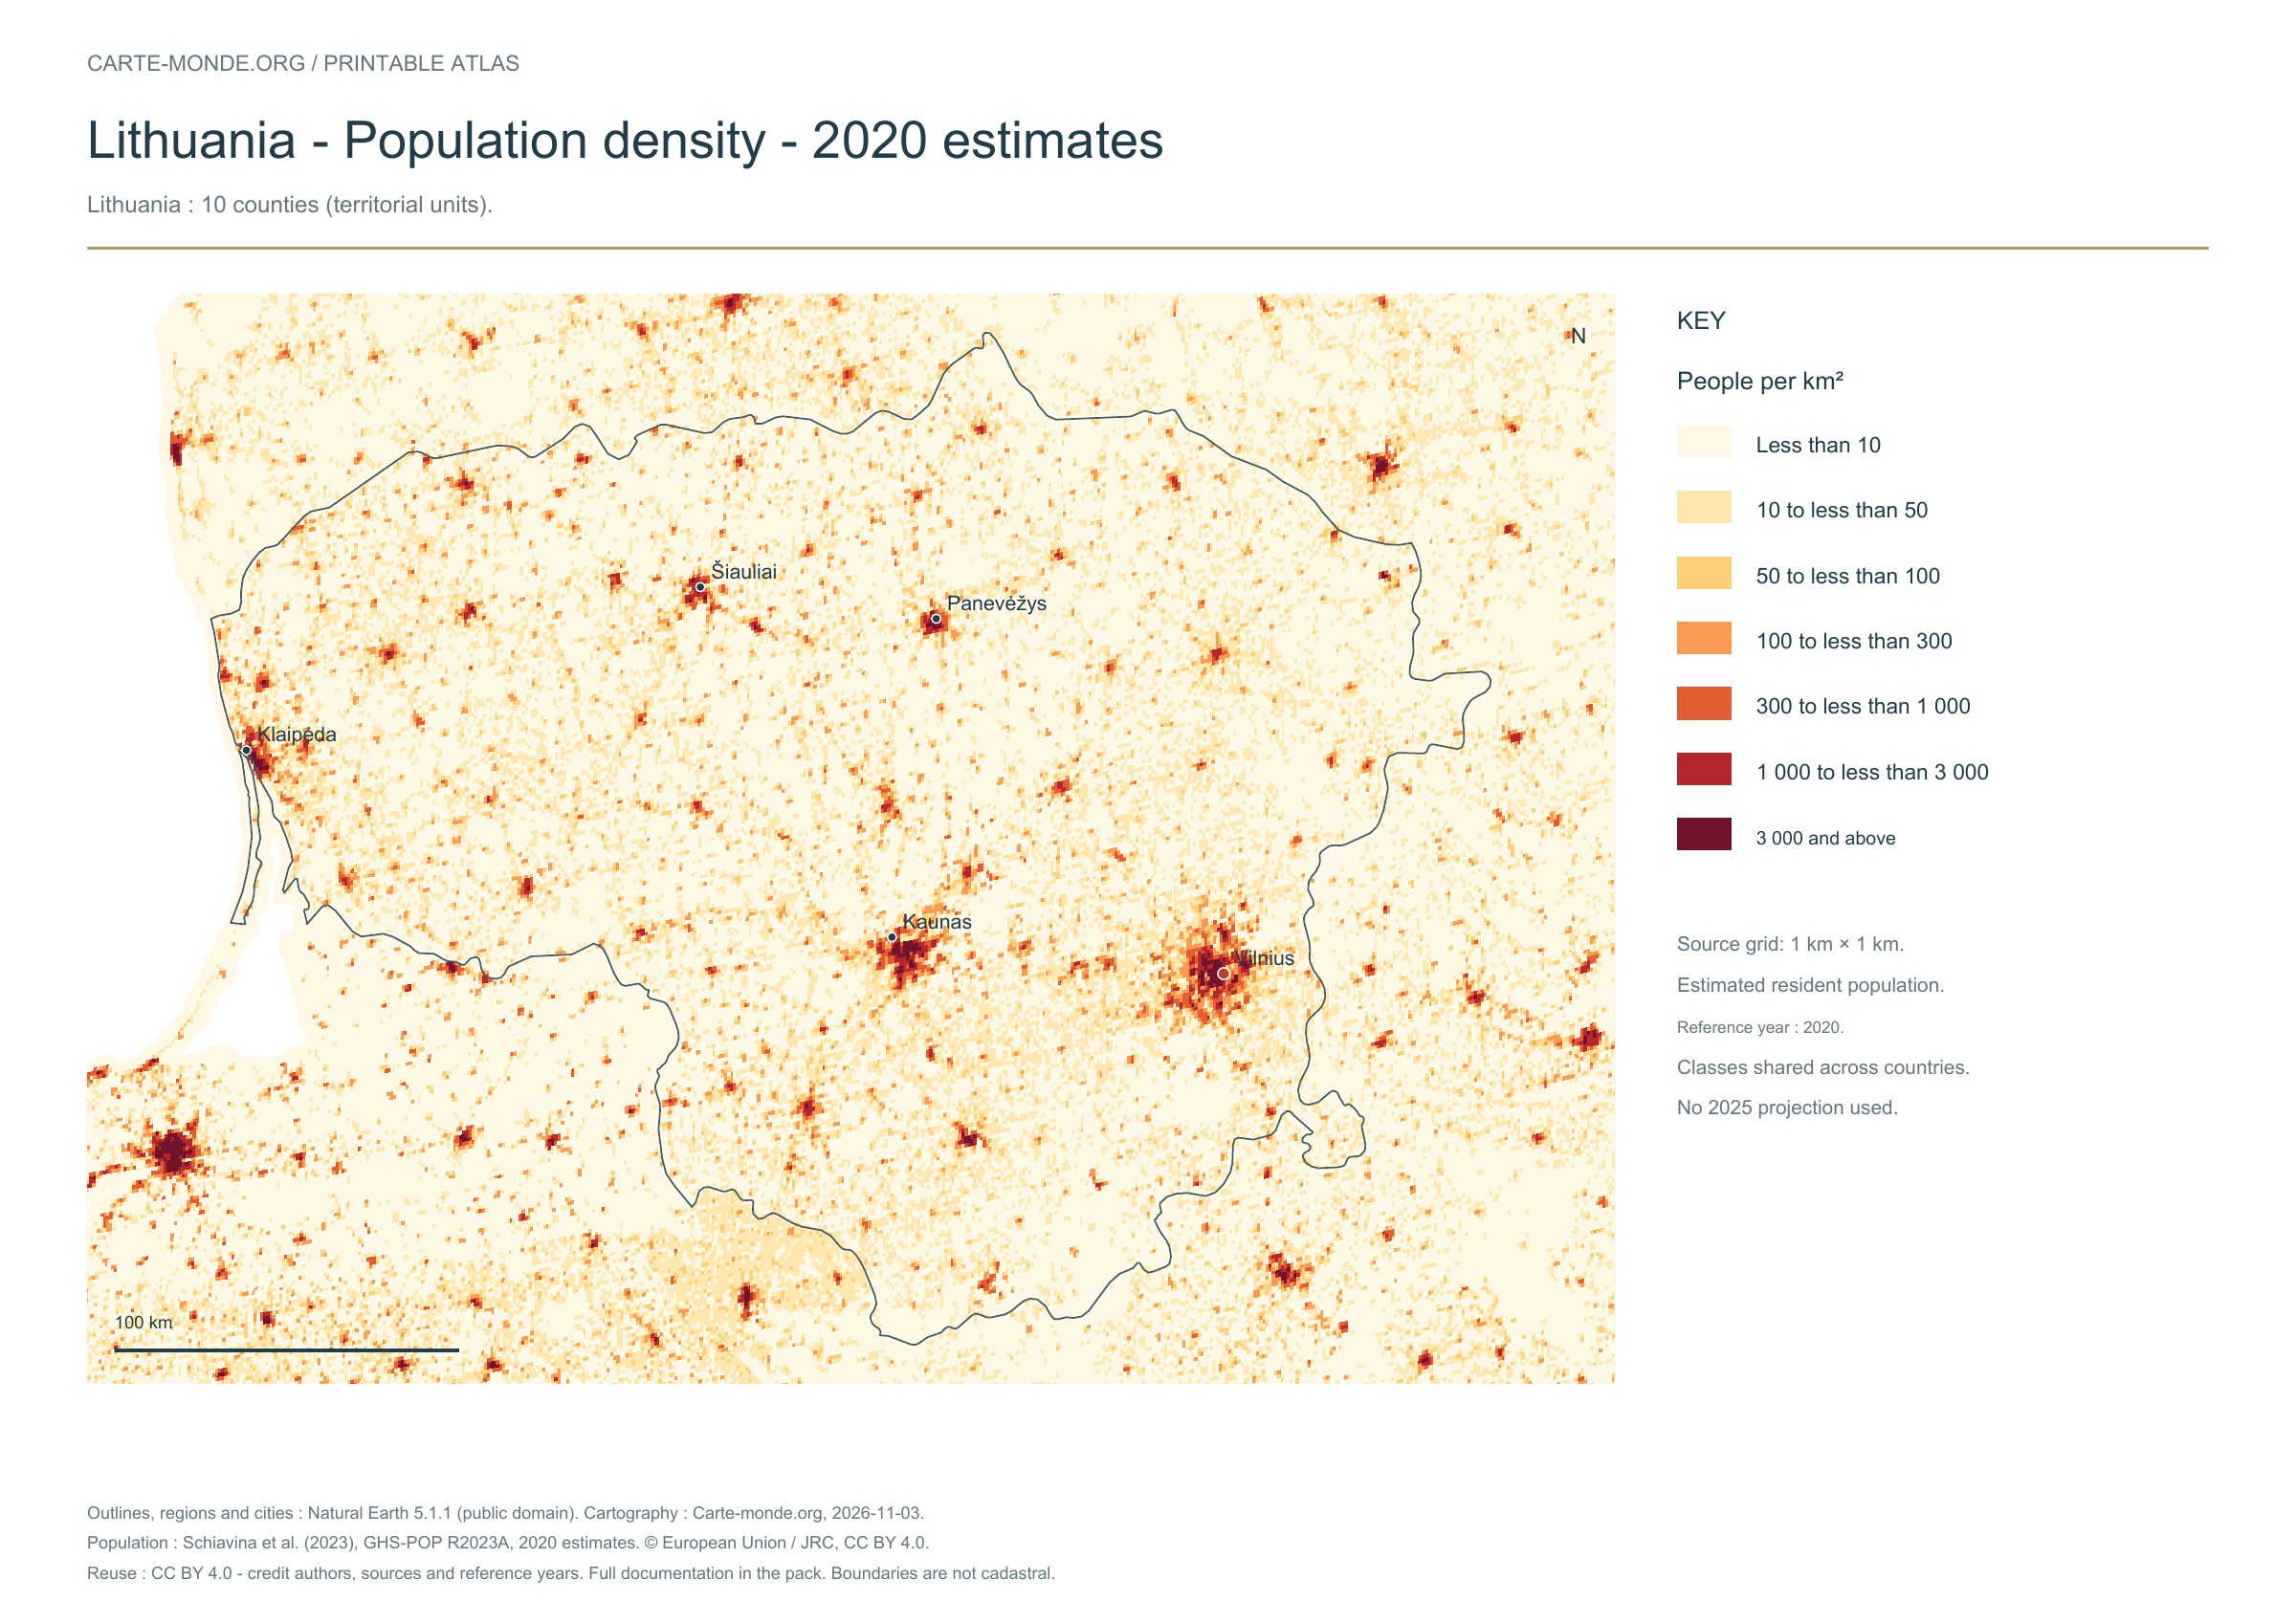
Population density — 2020 estimates — Lithuania

Carte-monde.org · November 2026

Population density — 2020 estimates

Estimated residential population in 2020, on a source grid of 1 km². Inhabitants/km² classes are shared across countries; no 2025 projection.

A4 landscape PDF · PNG 2 400 px · CC BY 4.0

The data represents estimated residential population in 2020, on a 1 km² source grid. The document’s creation date does not change this reference year.

The five in-house maps in one pack

Regions and cities, location in Europe, simplified elevations, 2020 population density and shaded relief: five A4 PDFs, their PNGs and SVGs, with sources and licences.

Download the five maps — ZIP
Previous edition packs

The four maps in one pack

Four A4 PDFs, their PNGs and SVGs, with full notes. Terrain and density use an embedded image background; text and linework remain vector-based.

Download the Lithuania pack — ZIP

Additional reference maps — CIA collection

Older documents in English provided by the University of Texas’s Perry–Castañeda collection. The links open the collection page where you can choose the indicated map. The dates below refer to the documents: these references do not necessarily describe the current situation.

Author: Central Intelligence Agency, except where otherwise stated on the document. Source: University of Texas Libraries. The collection states that most of its maps are in the public domain; retain these credits and check exceptions: reuse terms.

External references: no new file from this collection has been hosted on this site for this batch.

Find the old maps of Lithuania

Previously published maps remain accessible at their original URLs, with the collection’s text and credits.

Open the old maps of Lithuania

Choose and print a map

Regions and cities show how the territory is organized; the location map places the country; terrain shows the main natural regions; density shows population distribution. Print the in-house PDFs in A4 landscape with “Fit to page”. Insets have their own scales.

For exercises: six blank base maps of Lithuania.

Sources, reference years and reuse

Outlines, regions, cities and hydrography: Natural Earth 5.1.1, public domain. Generalized boundaries at 1:10 million, not cadastral; edition year 2026 does not mean that all geometries have been updated.

Relief: SRTM15+ / Tozer et al. (2019), reference publication, via GMT earth_relief_02m derived from SRTM15+V2.7. Grid smoothed to two arc minutes, suitable for a national overview, without topographic precision.

Population: Schiavina et al. (2023), GHS-POP R2023A, 2020 residential estimates, © European Union / JRC, CC BY 4.0. The 1 km² Mollweide cells are expressed in inhabitants/km². Methodology: Pesaresi et al. (2024).

The four new maps: created by Carte-monde.org, November 2026, under CC BY 4.0. Cite authors, sources and reference years, and indicate adaptations. Additional and older maps retain their own rights.

Country maps · Other maps and archives

Previous versions: maps and files preserved

These files remain available at their original URLs. For corrected maps, use the main links above. Each edition retains its credits and date.

Raster base map, cities, rivers and lakes: Natural Earth, public domain. Other boundary credits and licences are retained in the pack. Cartographic work CC BY 4.0; ODbL-derived data retains its licence. No topographic accuracy is claimed.

Other maps: sources and reuse

Reference maps by external authors. Each document retains its licence, credits and date. “View map” links open the document on Commons; ZIP buttons provide access to the files kept in this collection.

Lithuania-topo-en.png
Author: Equestenebrarum · CC BY 3.0 · Original file page, sources and licence

Date stated by the source: 08.06.2008. The data date may differ from the document date; check its key.

View the map on Commons

To reuse a CC BY map, cite its authors, source and licence and indicate any changes. Adaptations of a CC BY-SA map retain the same or a compatible licence. CC0 documents may be reused freely; retaining the source makes them easier to identify. These rights do not make all administrative boundaries current.

Previous collection — original files preserved
Flag of Lithuania
Flag of Lithuania
Online Maps of Lithuania
General Map of Lithuania
Administrative Map of Lithuania
Relief map of Lithuania
Original French files
Previous language edition

Maps of Luxembourg: regions, cities, relief and population

Flag of Luxembourg
Flag of Luxembourg

LUXEMBOURG · PRINTABLE MAPS

Five printable maps of Luxembourg: regions and cities, location in Europe, two views of the relief and population. PDFs, images and sources are available below.

Our five maps have English labels. Maps from other publishers retain their original language.

Regions, cities and location in Europe

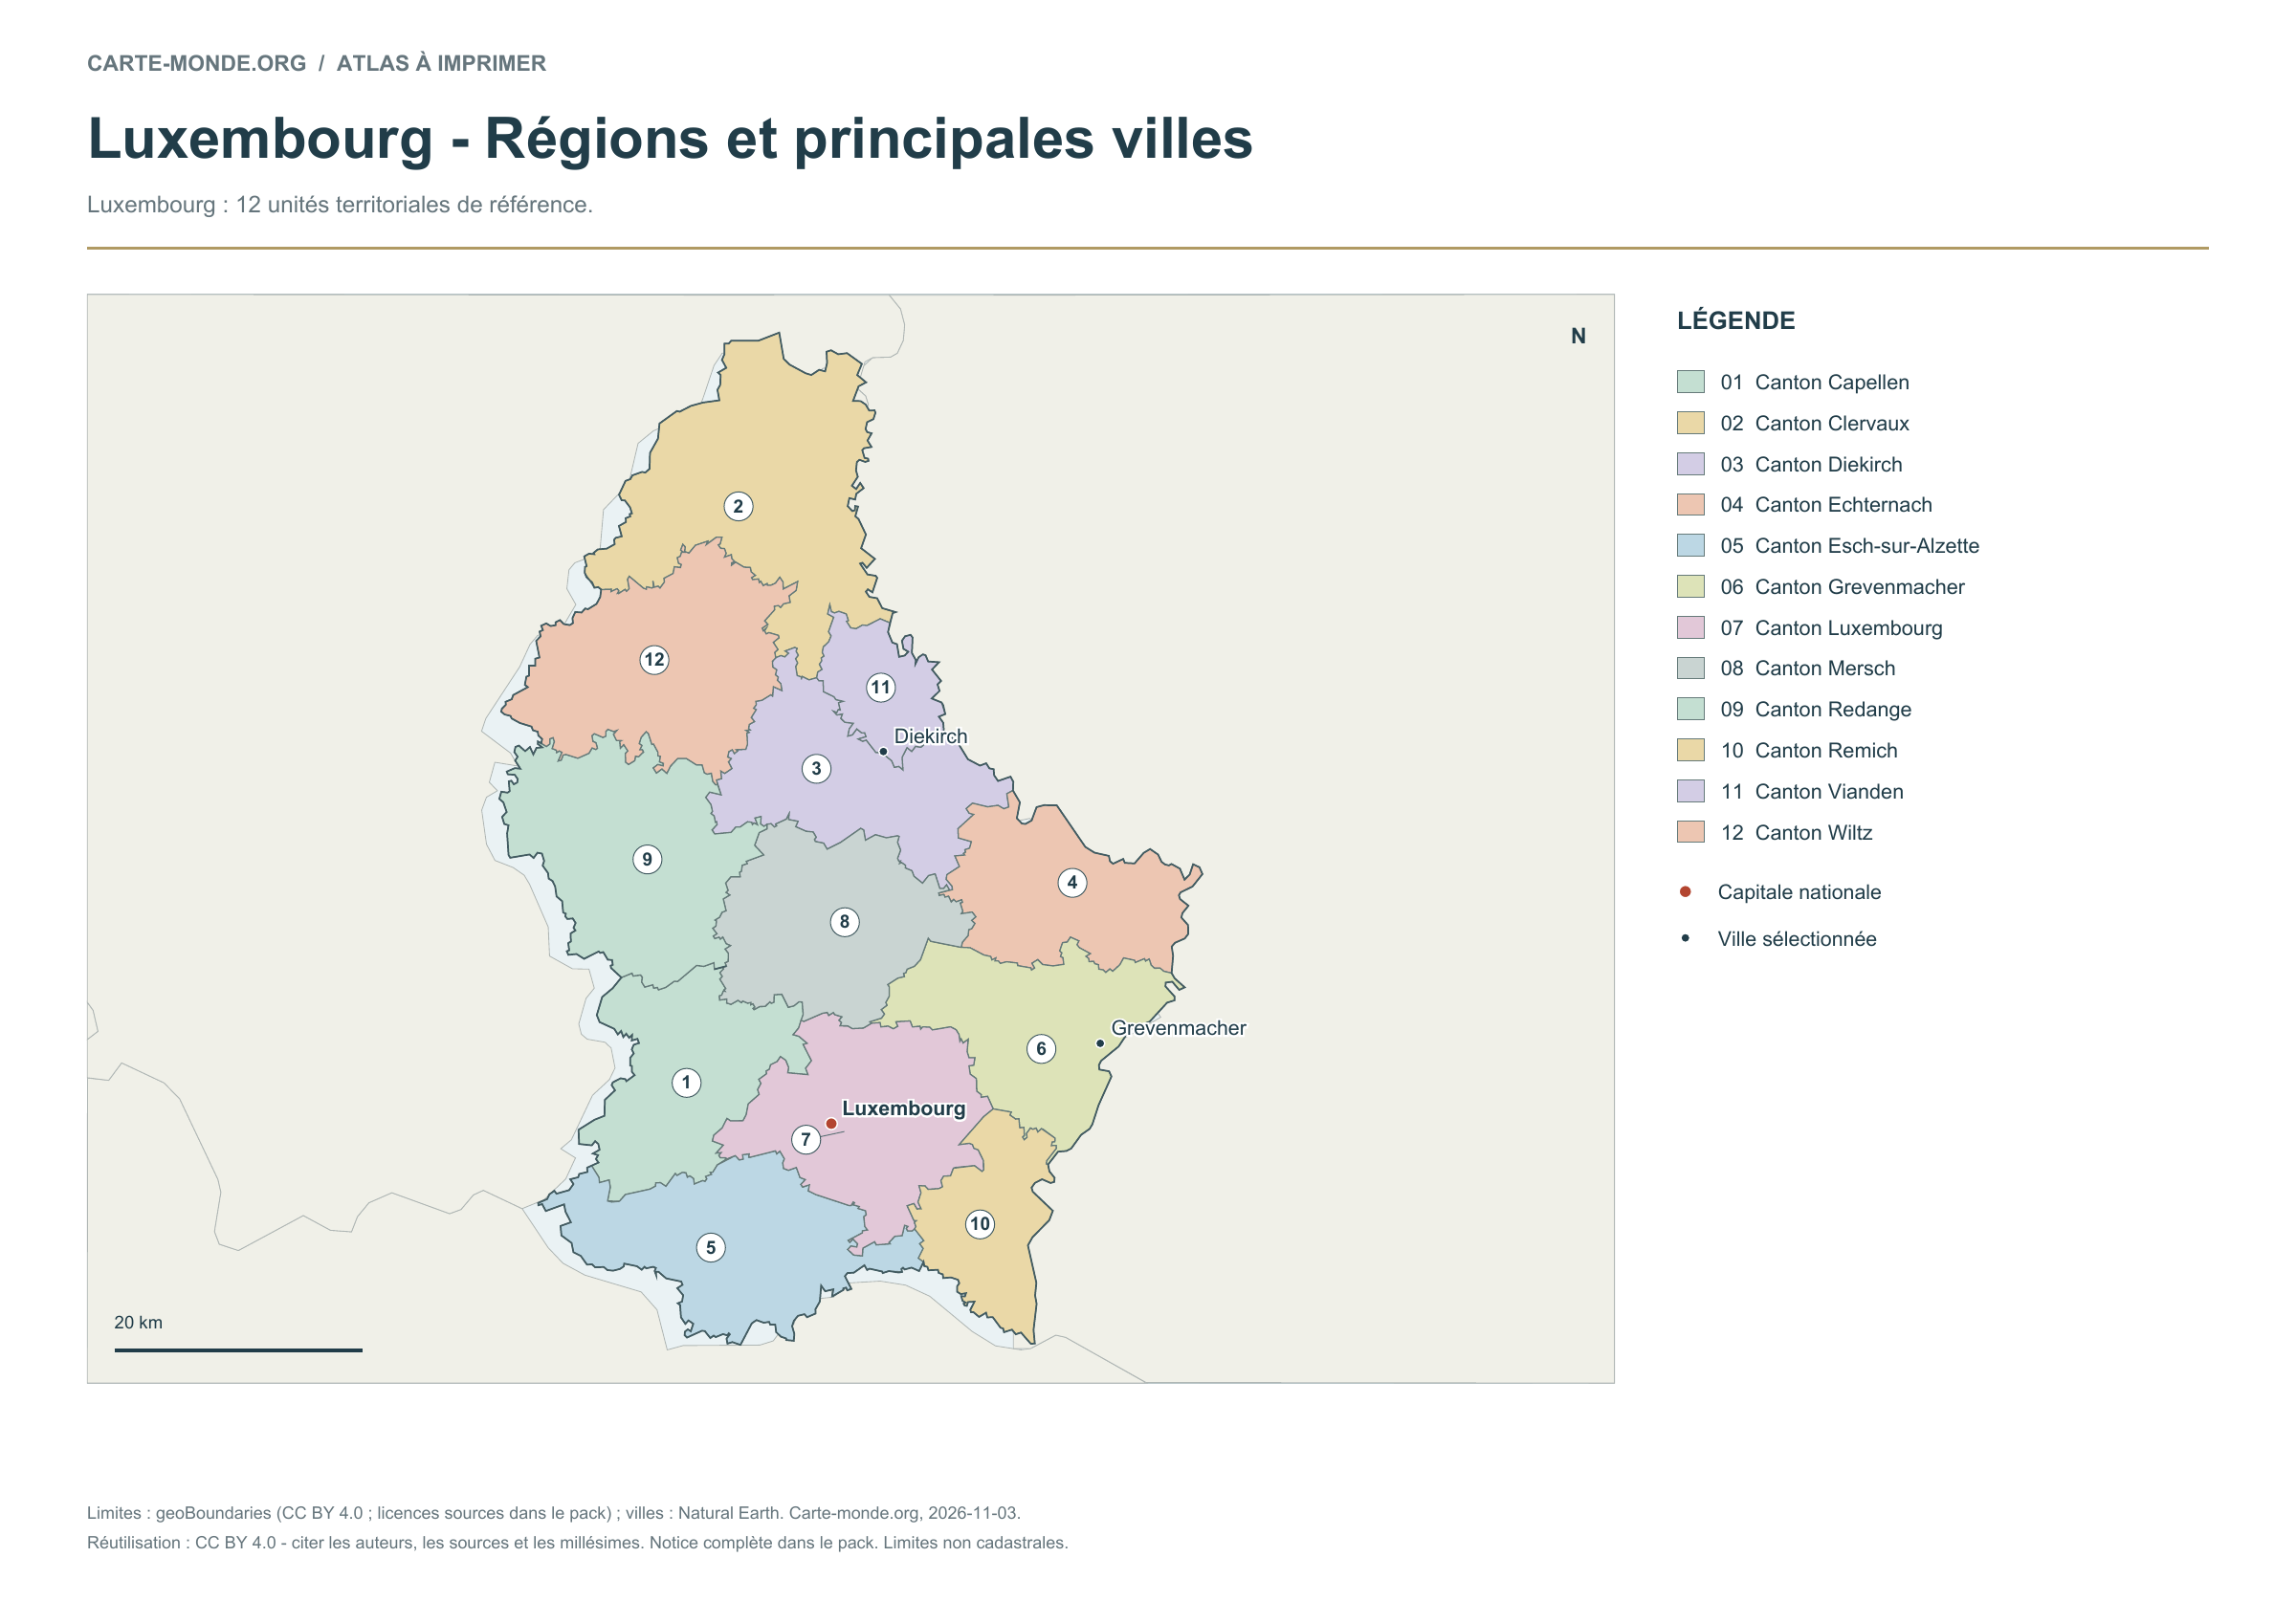
Luxembourg: 12 reference territorial units.

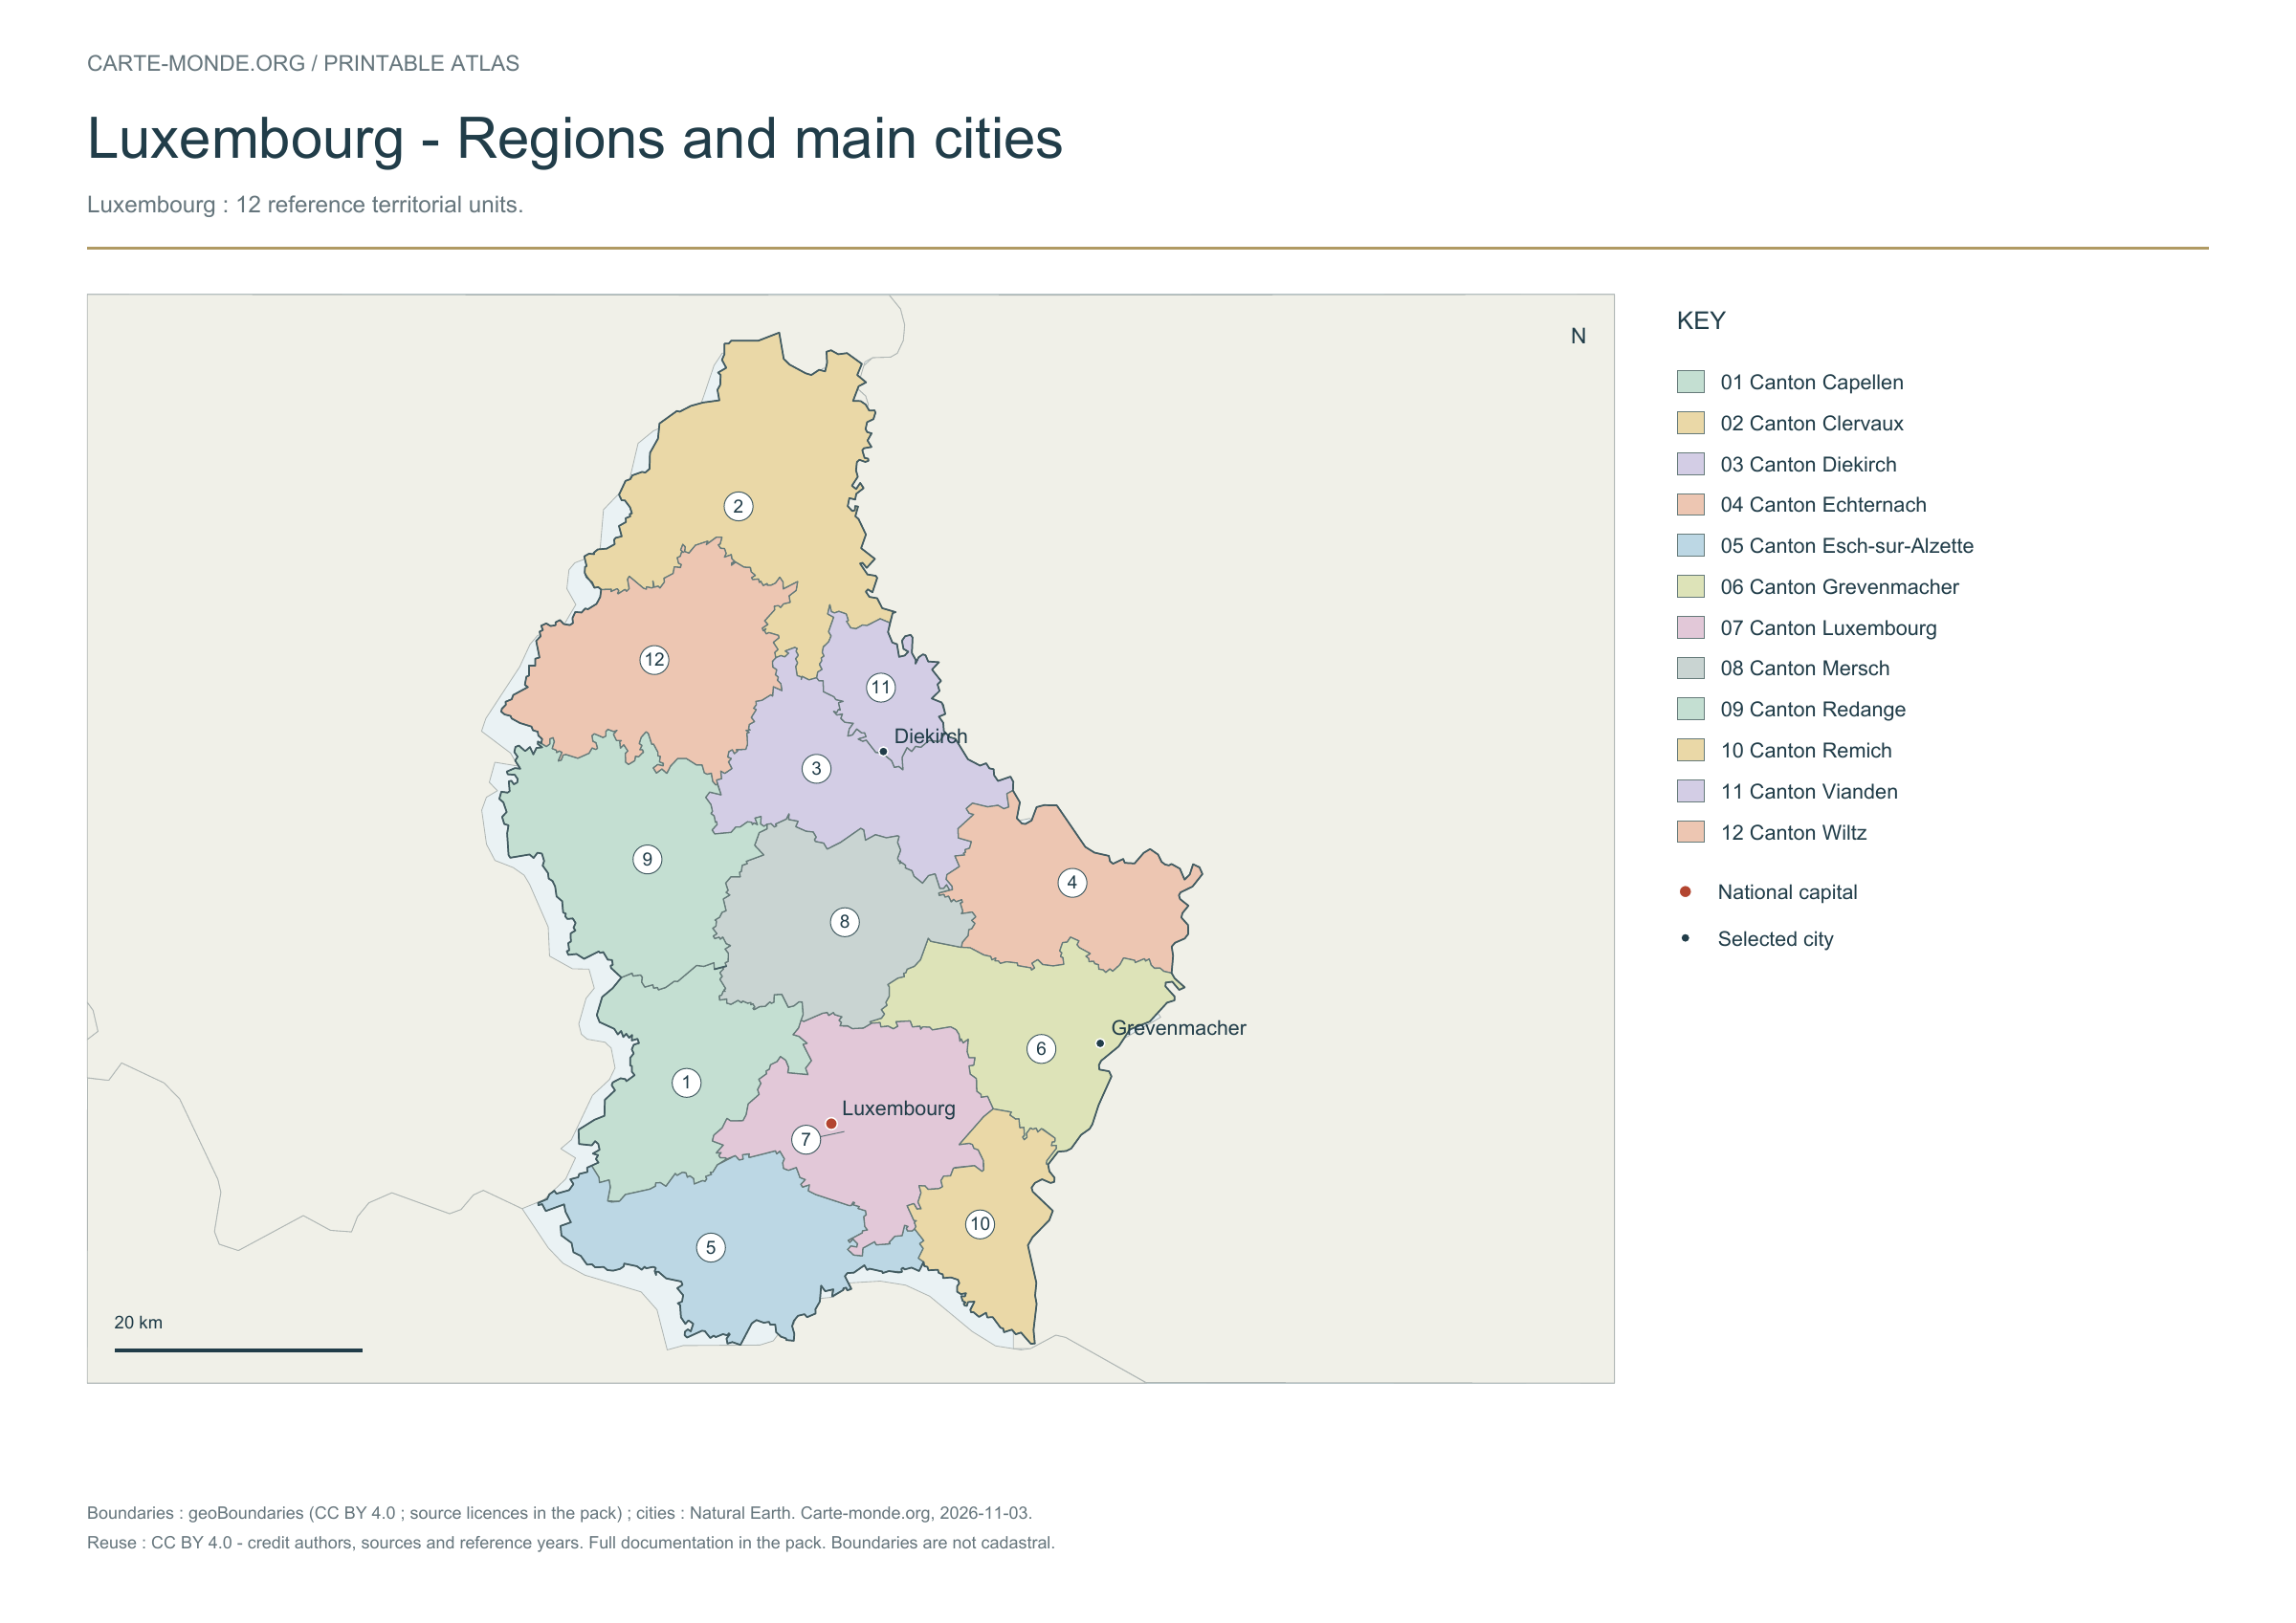
Regions and main cities — Luxembourg

Carte-monde.org · November 2026

Regions and main cities

The 12 reference territorial units are numbered and named in the key, with selected cities and the capital.

A4 landscape PDF · PNG 2 400 px · CC BY 4.0

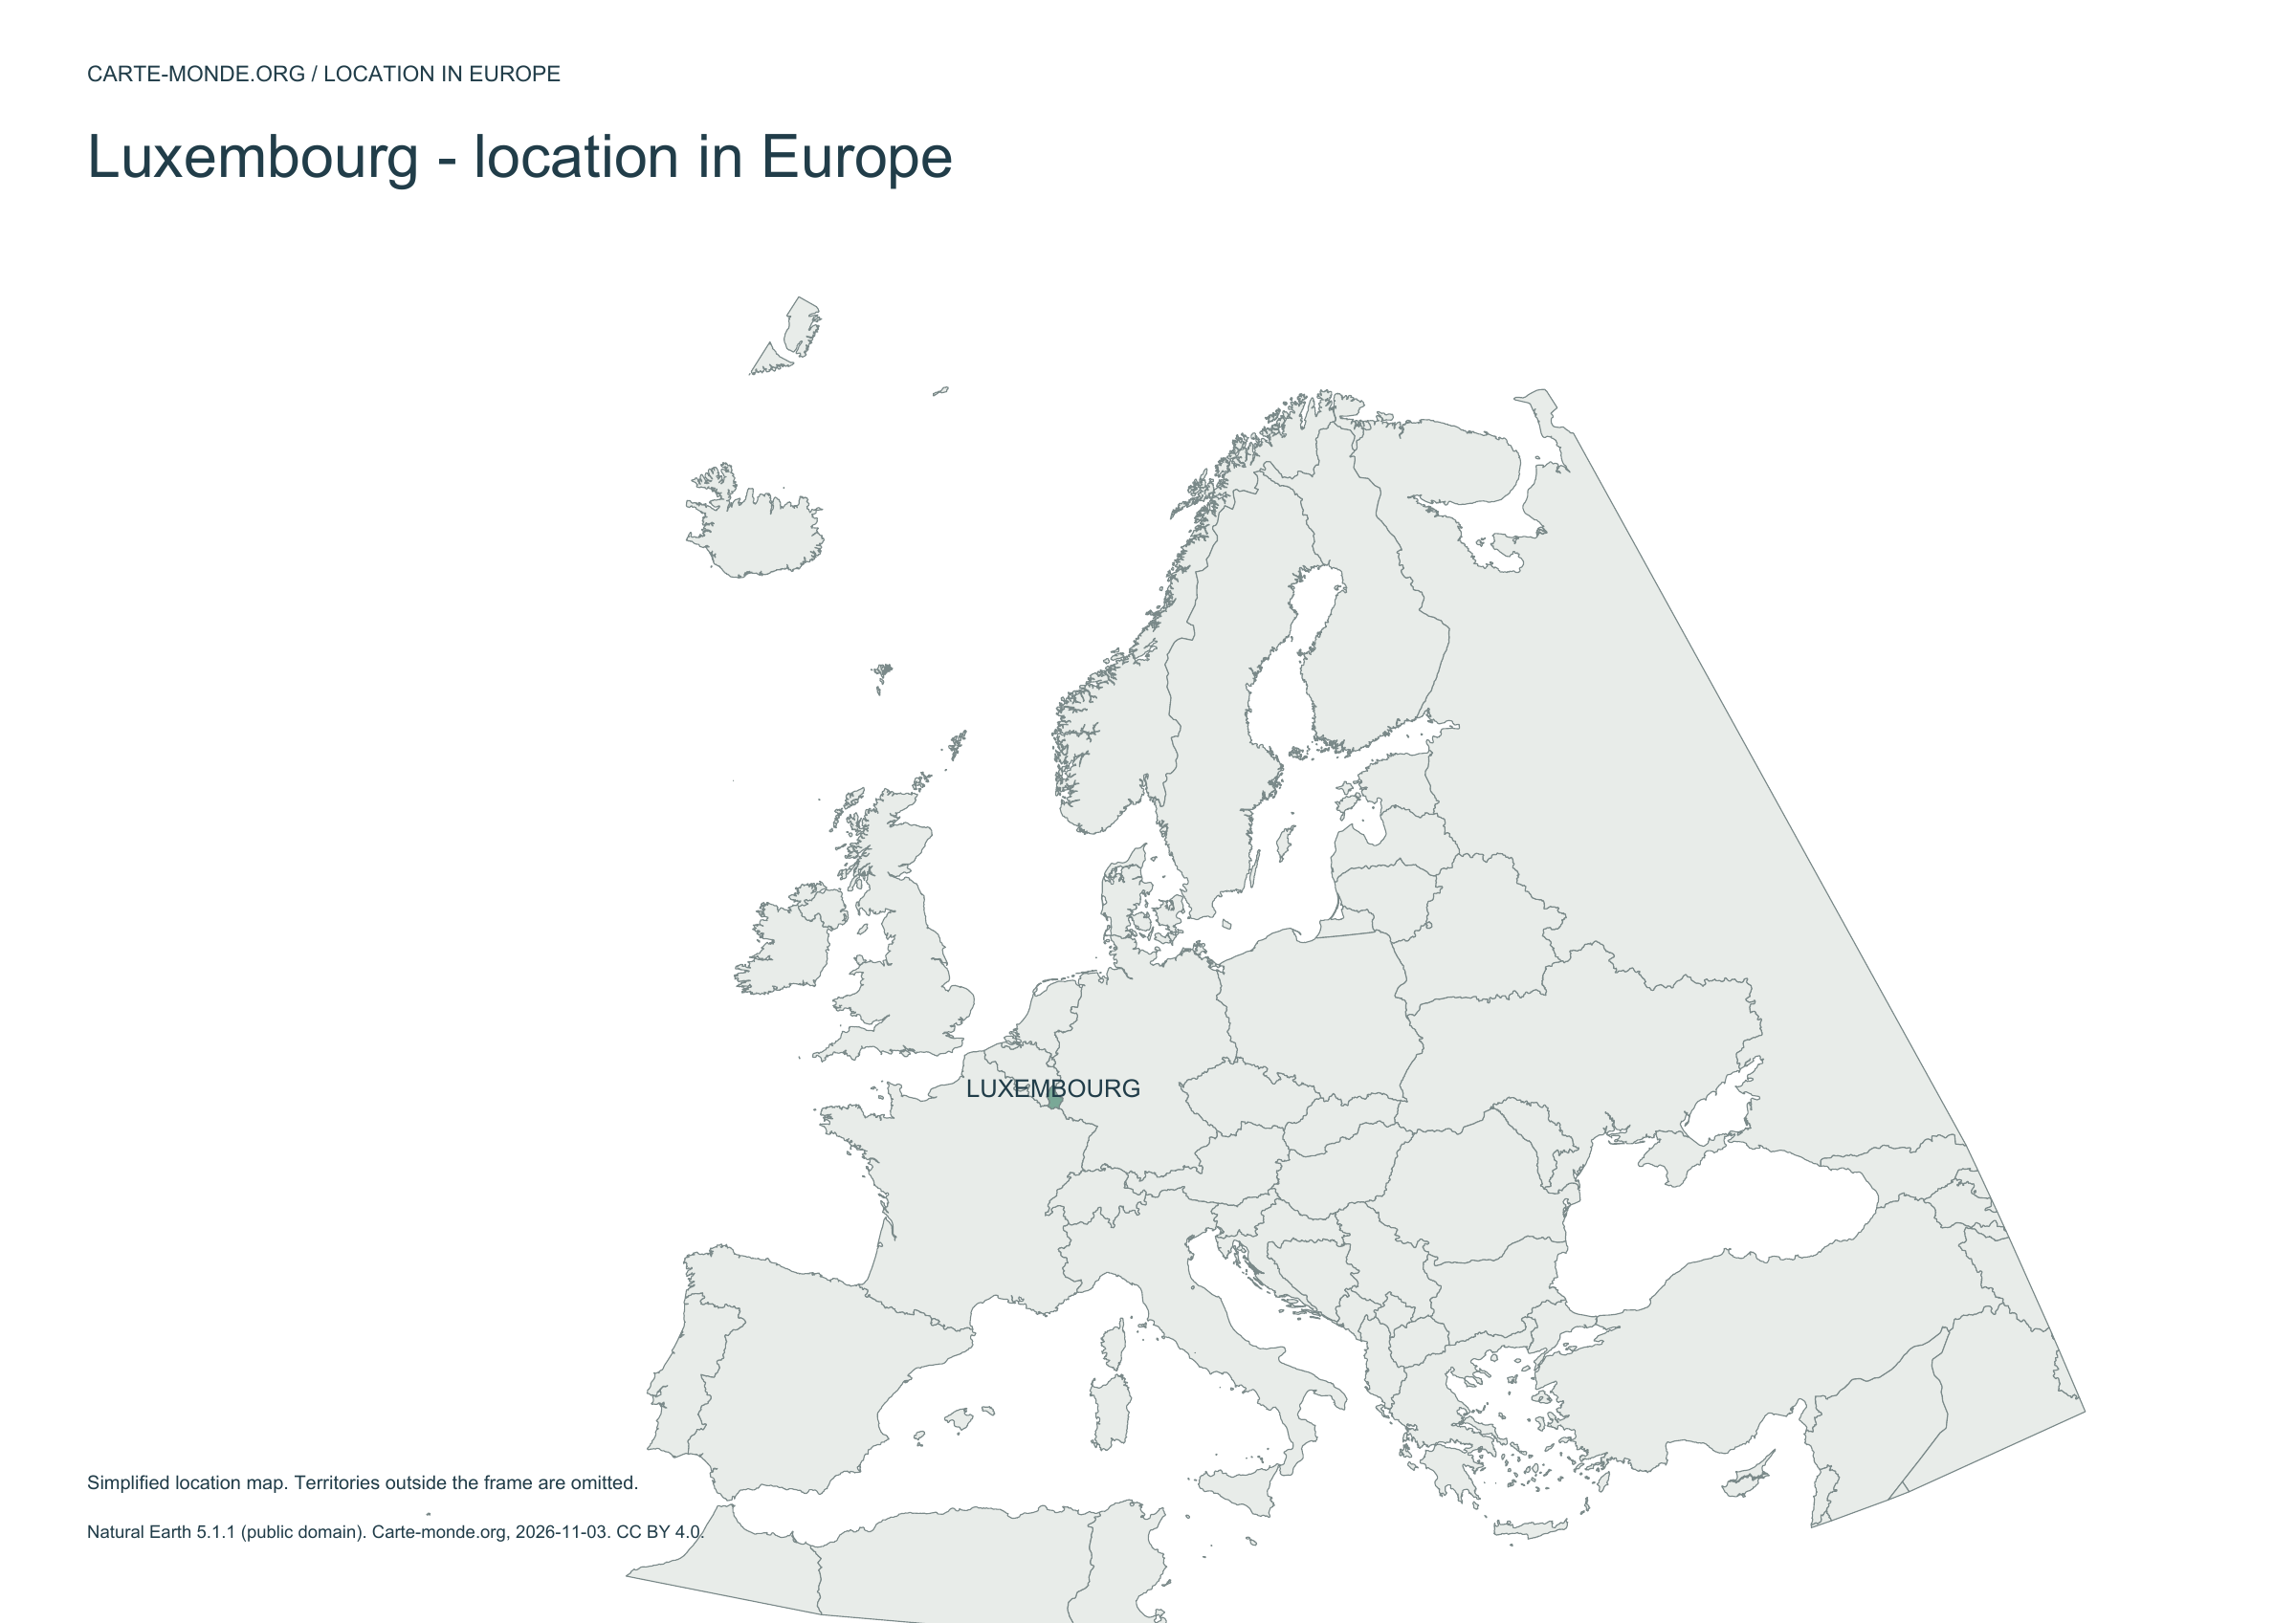
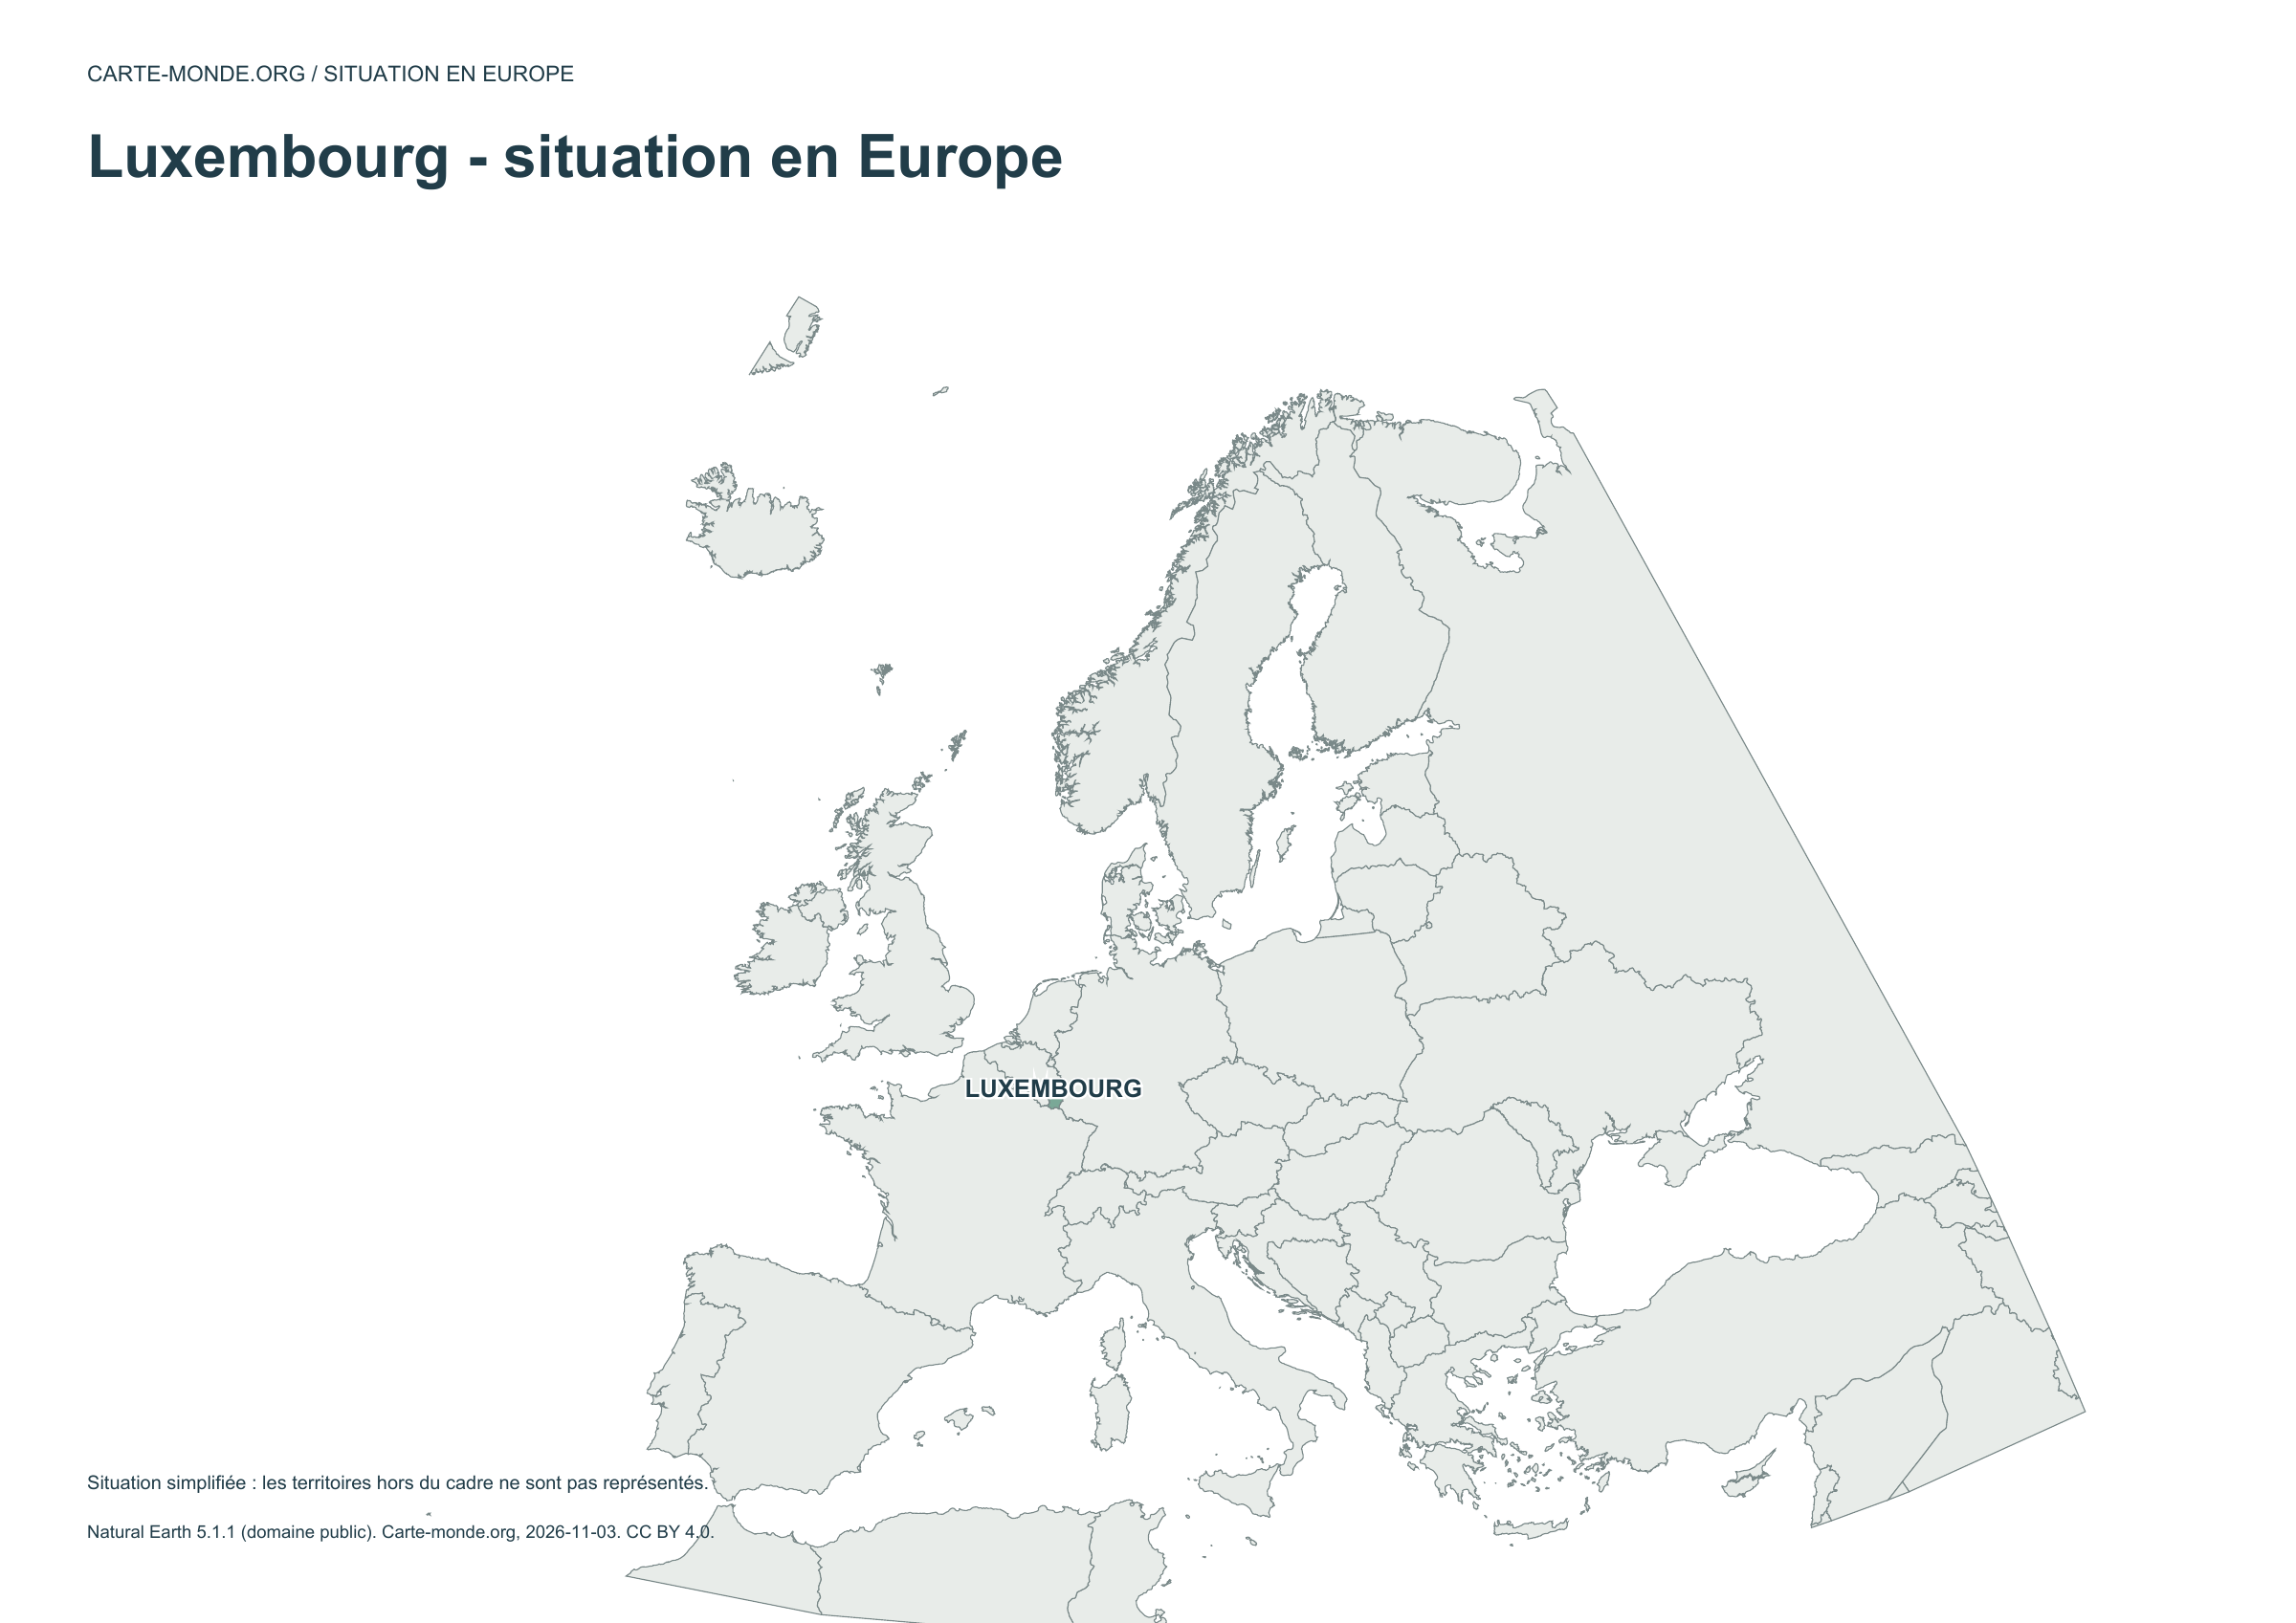
Location in Europe — Luxembourg

Carte-monde.org · November 2026

Location in Europe

The country is highlighted within a simplified European frame; territories outside this frame are not shown.

A4 landscape PDF · PNG 2 400 px · CC BY 4.0

Two maps to understand the relief

Choose shaded relief for an overview, or elevation classes for school use.

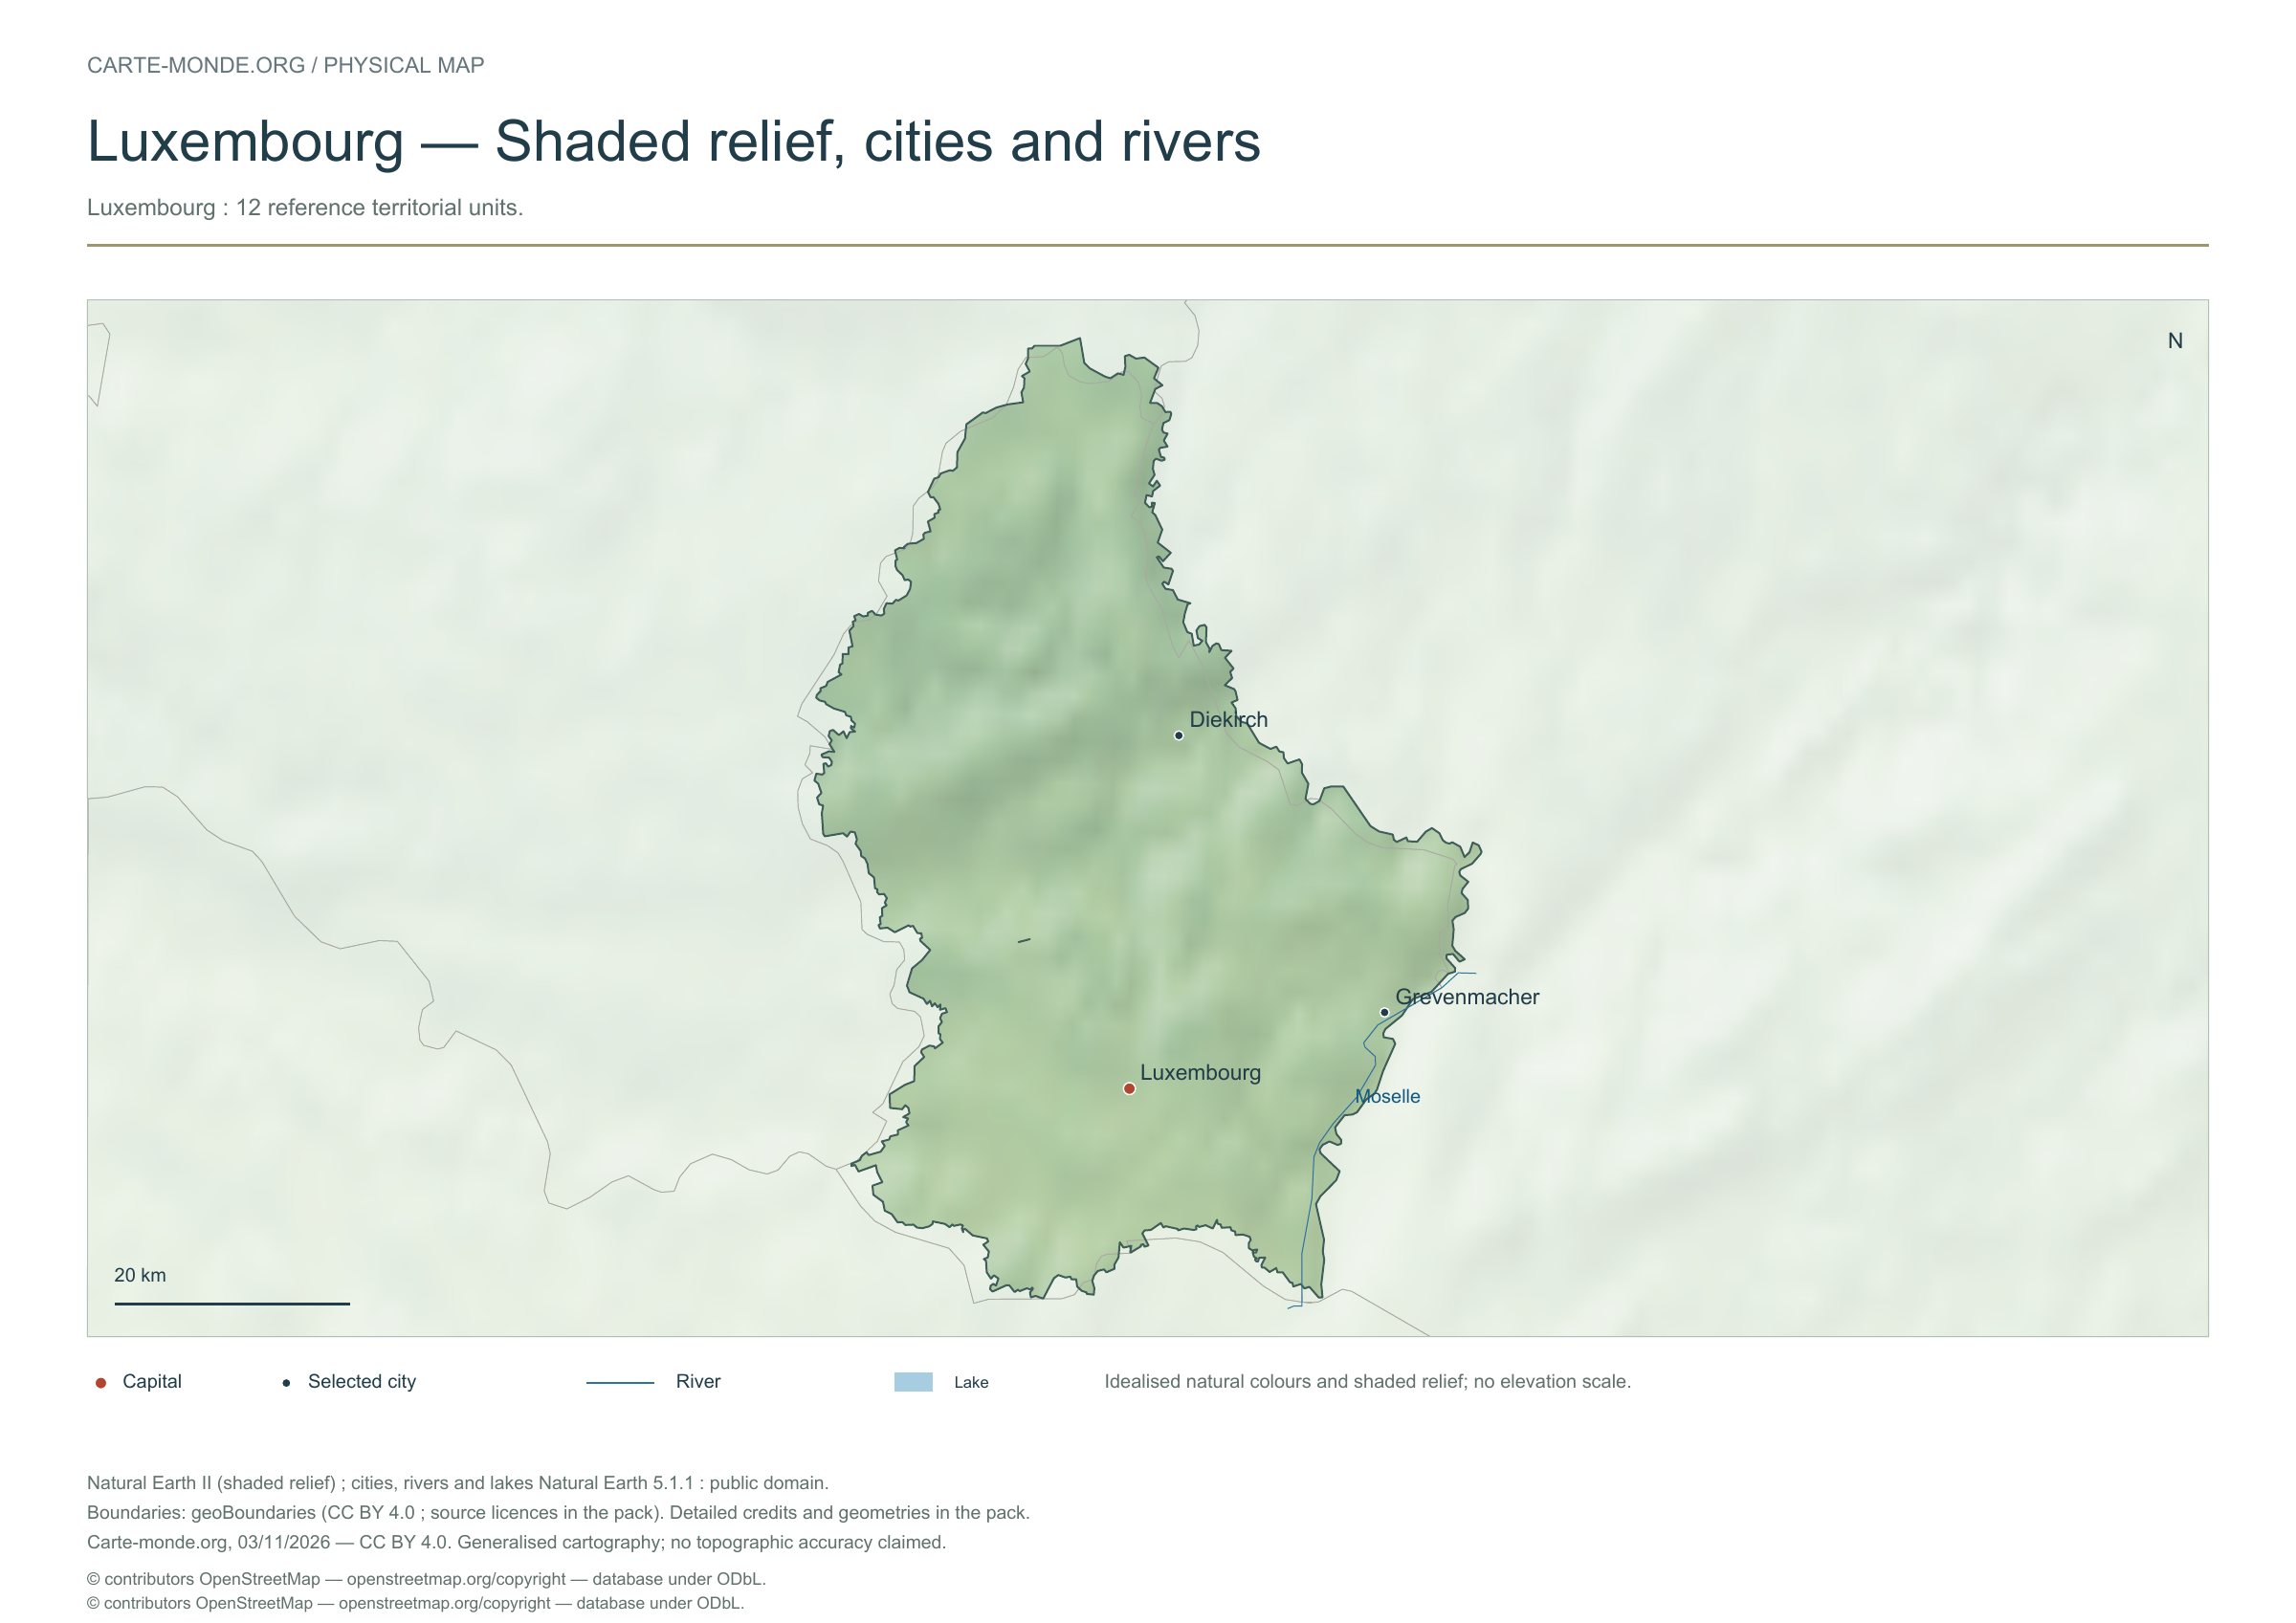
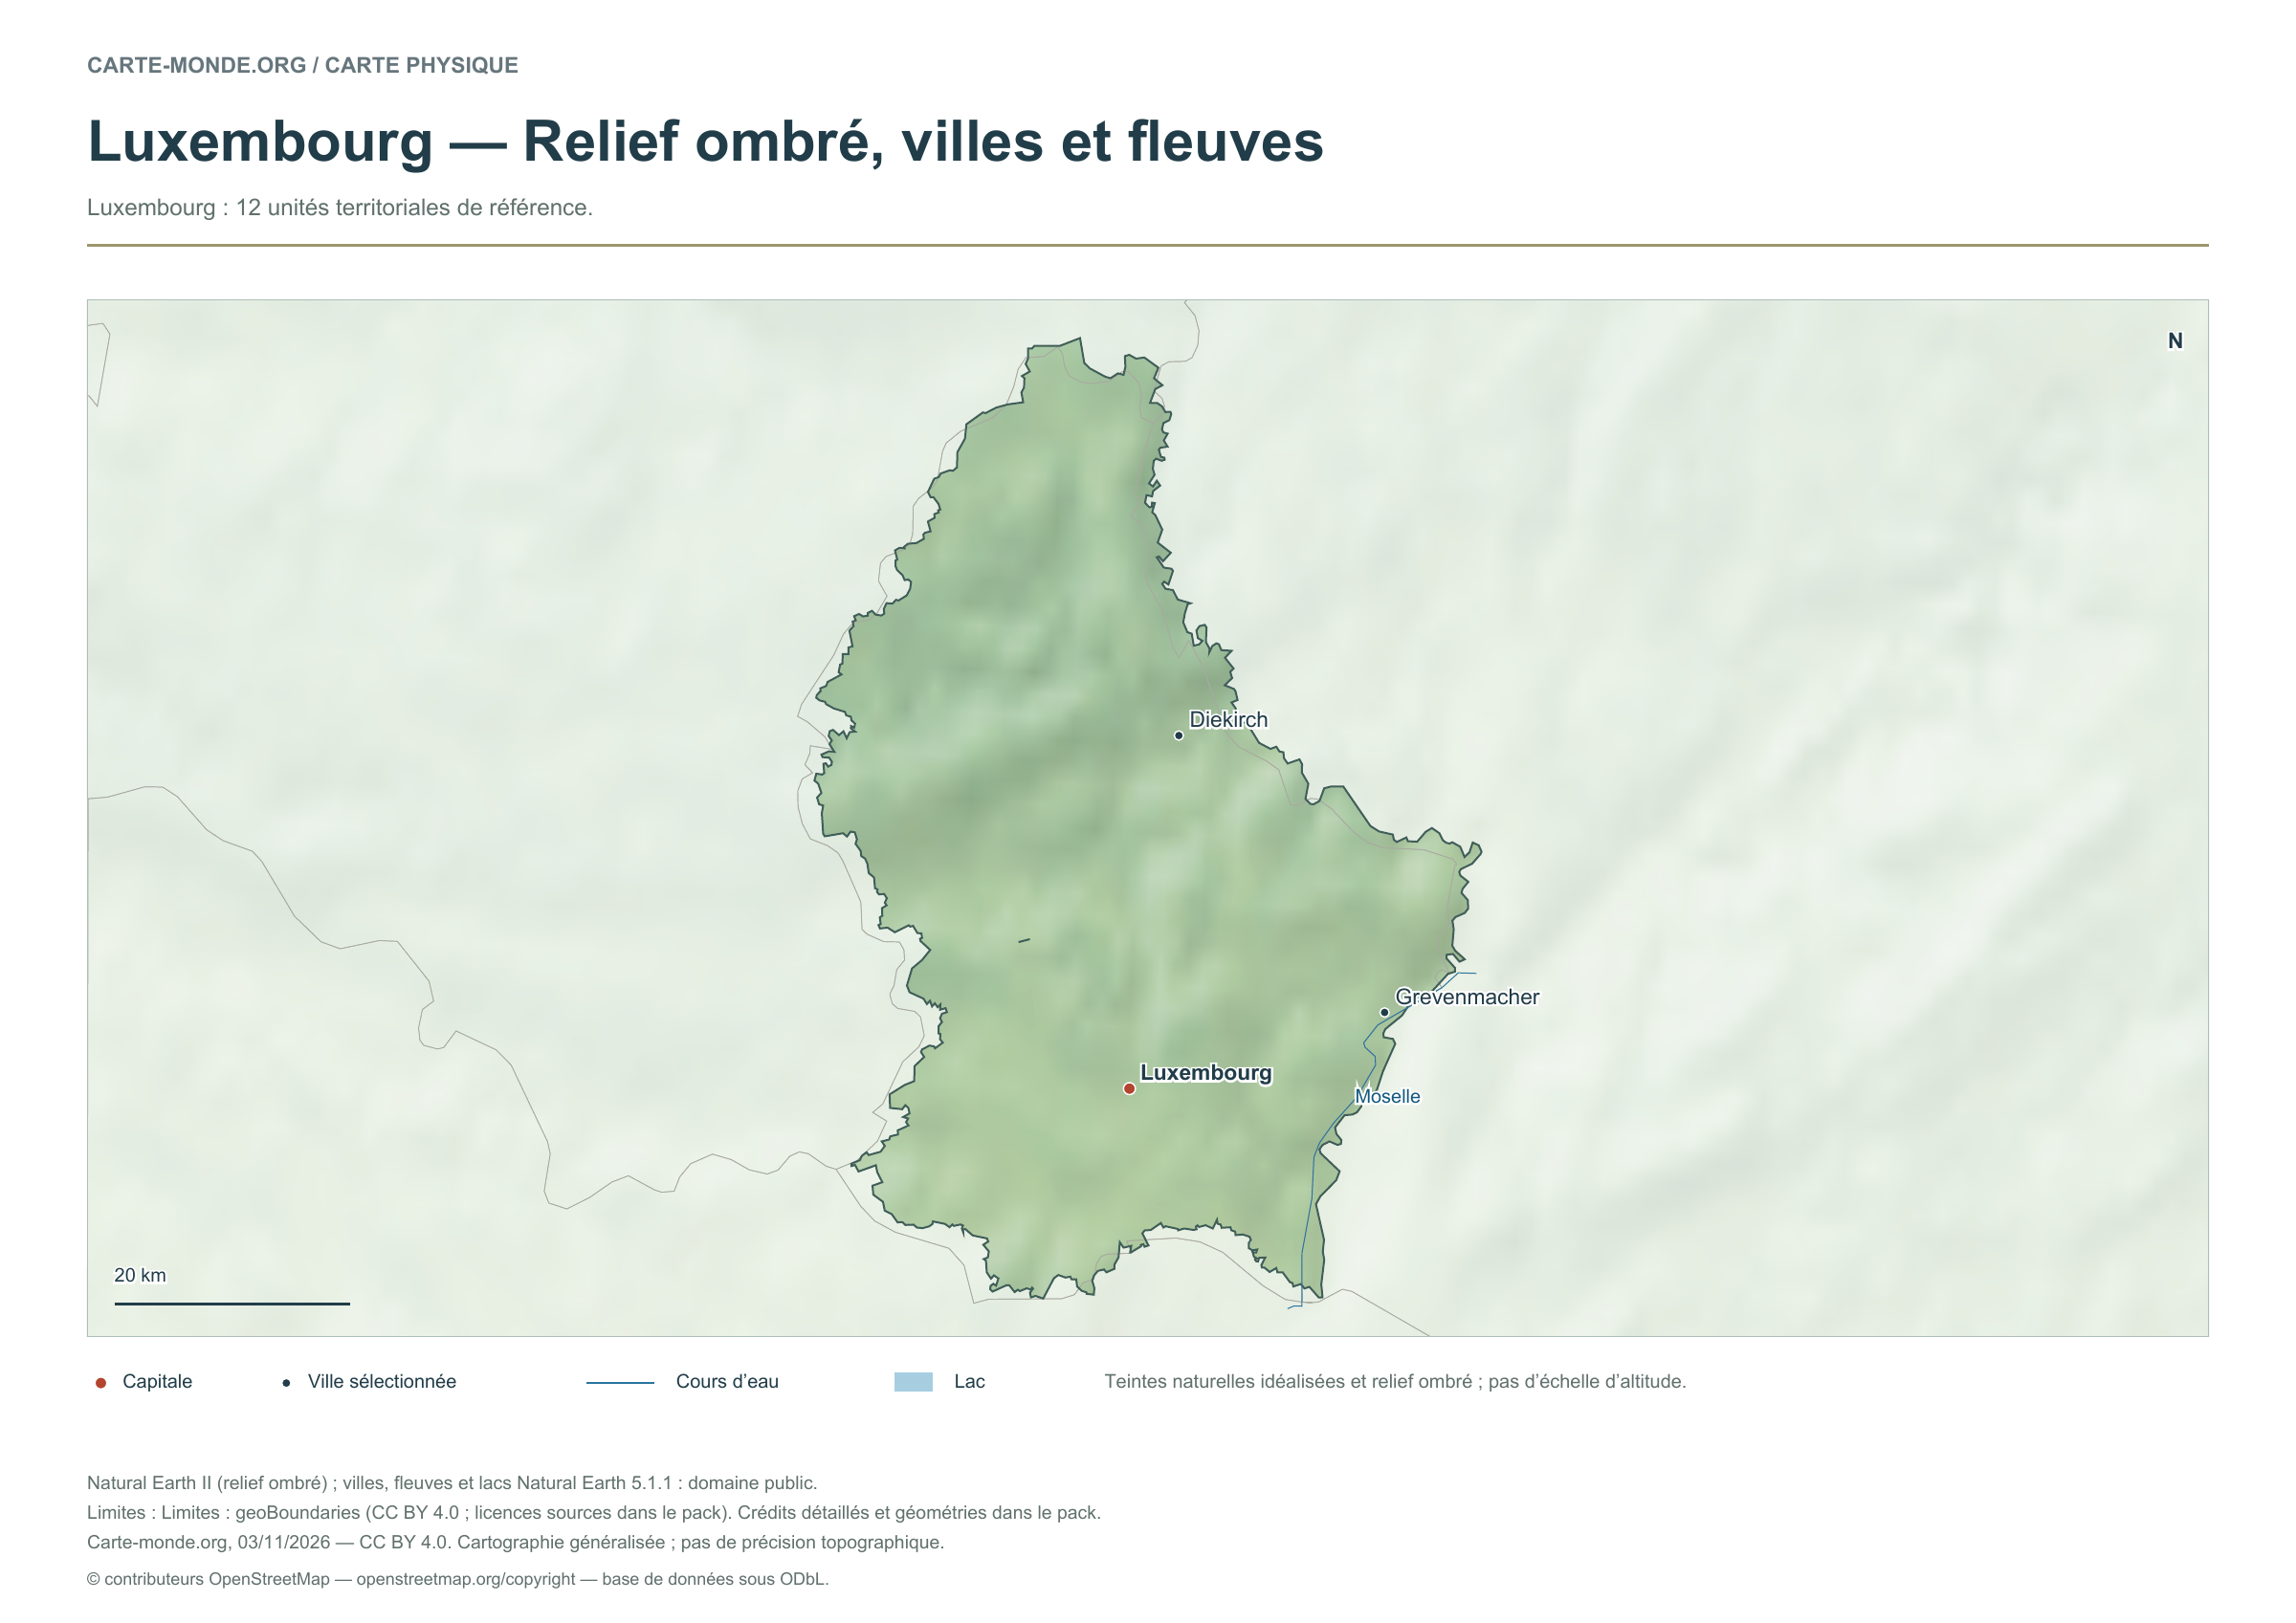
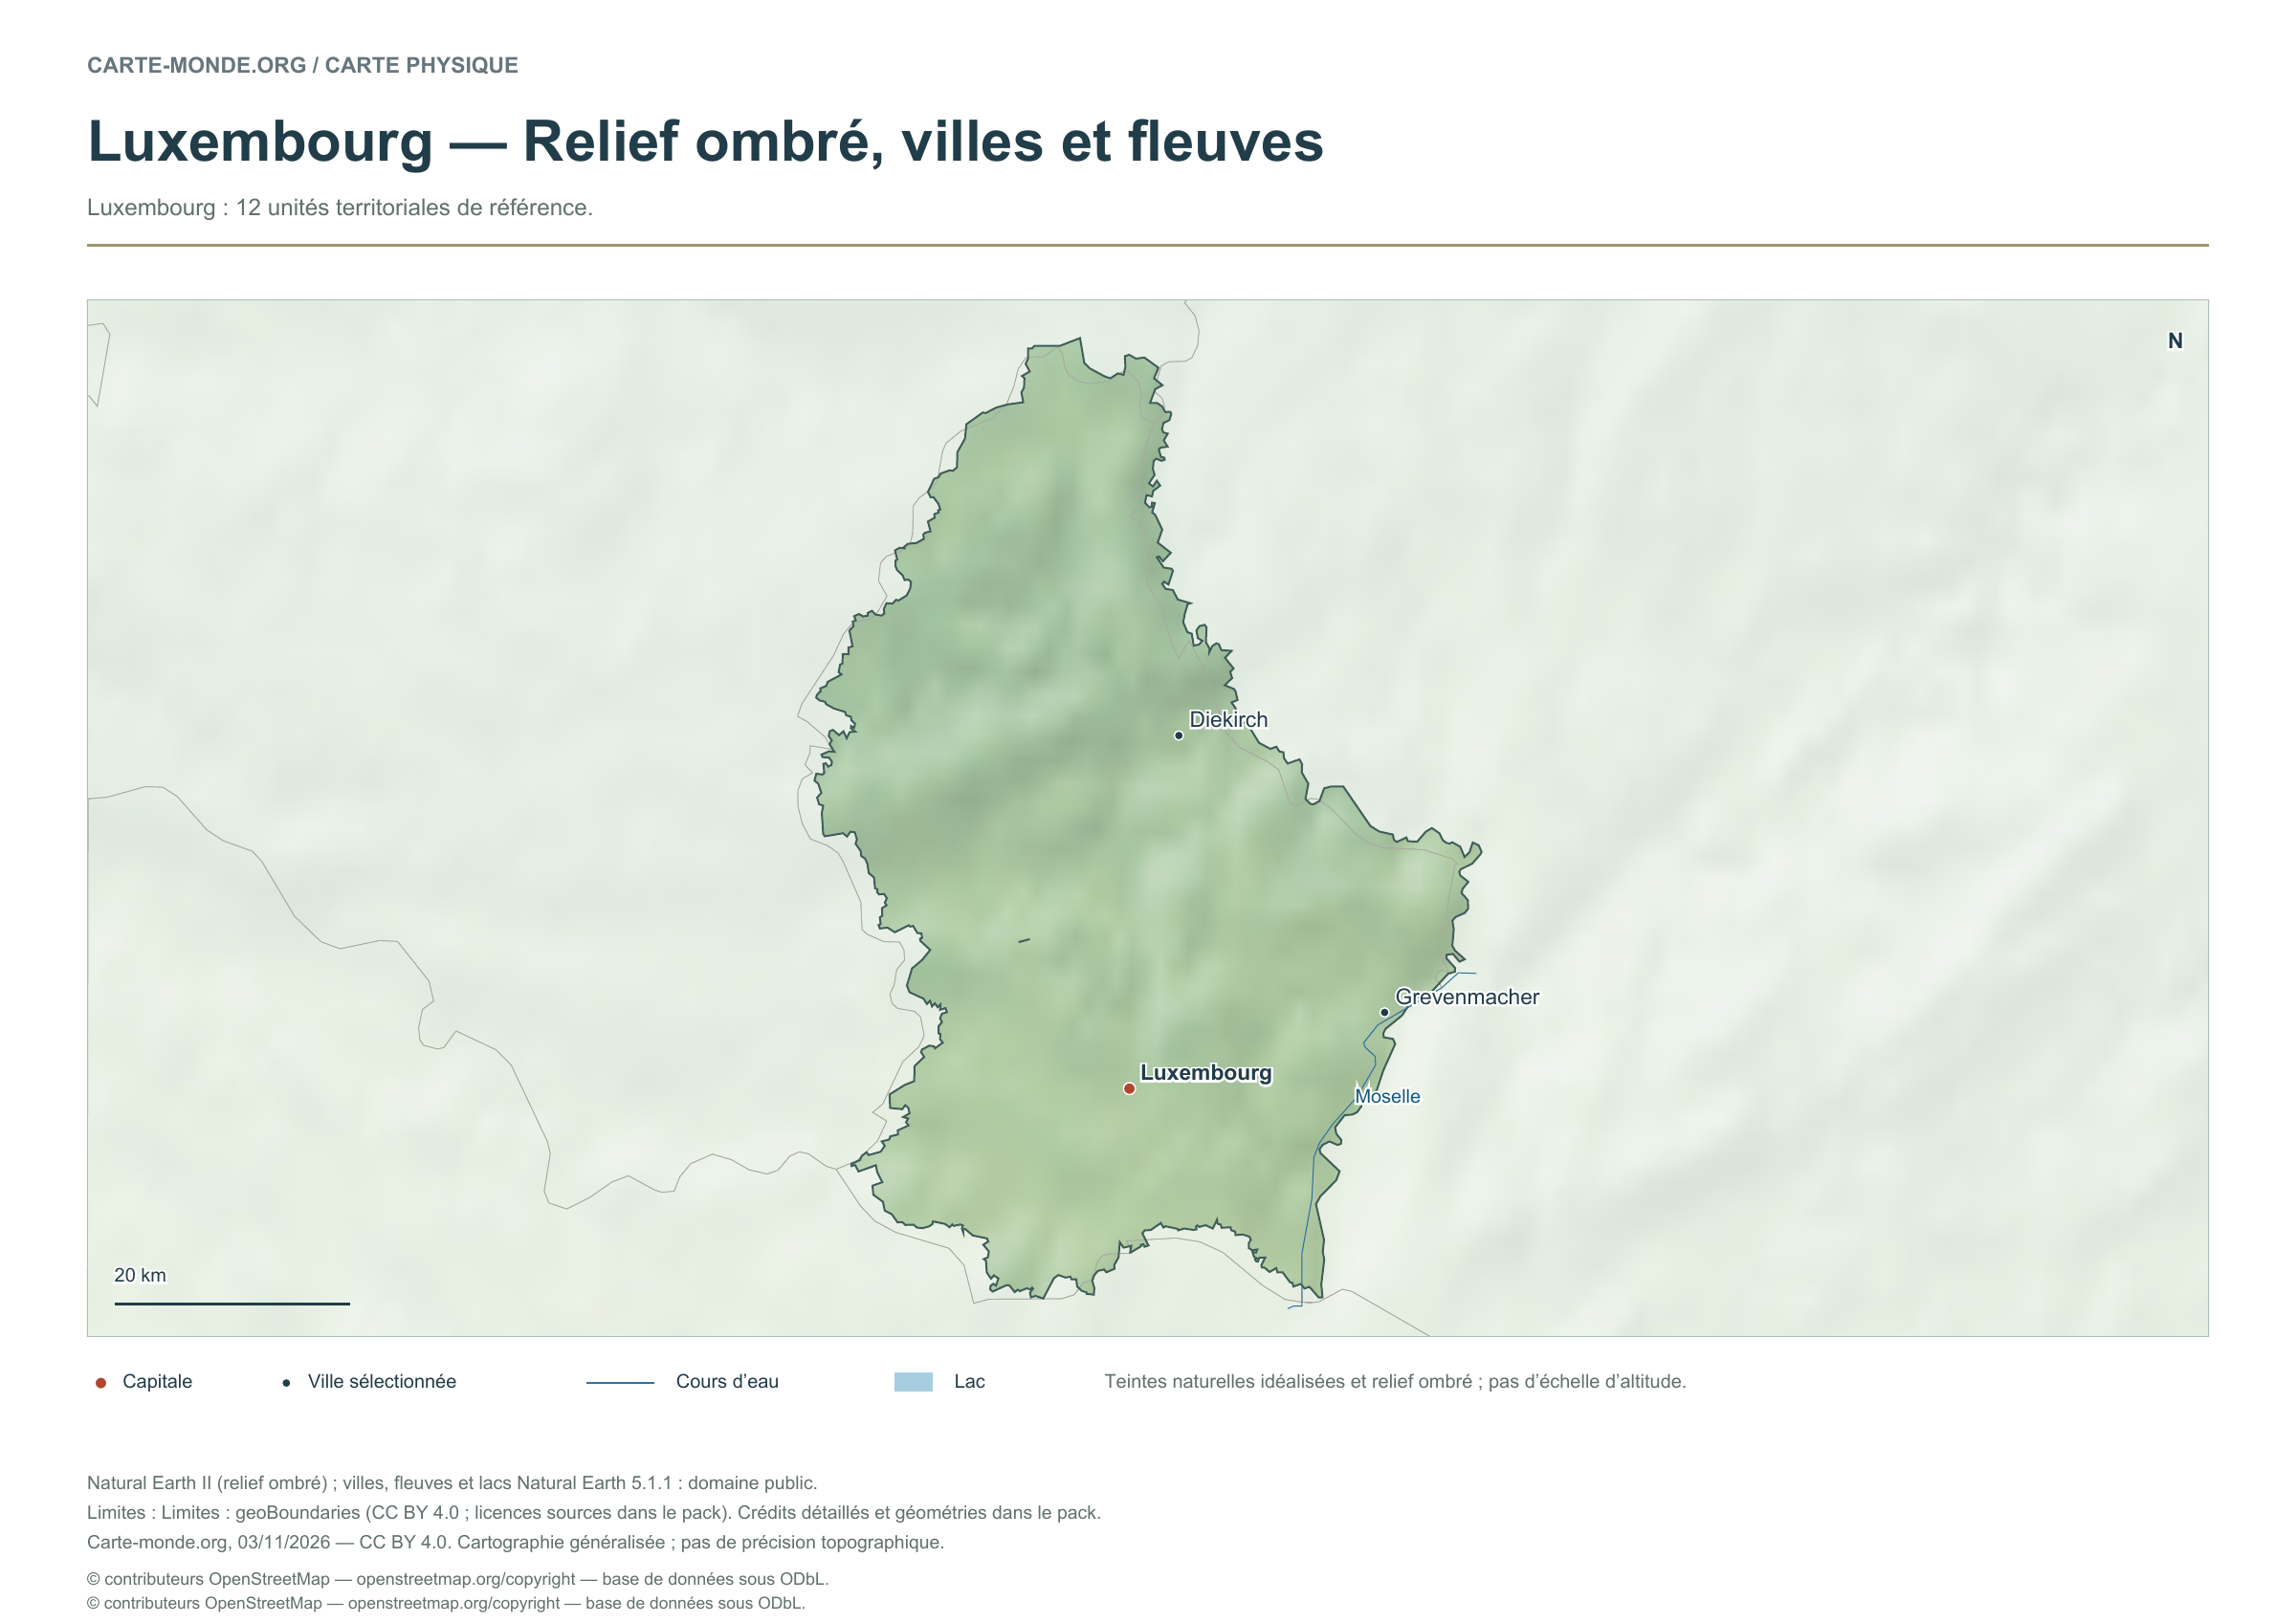
Luxembourg — Shaded relief, cities and rivers

Carte-monde.org · November 2026

Shaded relief, cities and rivers

To identify major landforms, cities and the river network. The natural colours are not an elevation scale.

Raster base map, cities, rivers and lakes: Natural Earth, public domain. Other boundary credits and licences are retained in the pack. Cartographic work CC BY 4.0; ODbL-derived data retains its licence. No topographic accuracy is claimed.

Territory, data and selection of names

Luxembourg: 12 reference territorial units.

Natural Earth II shaded relief background, 3 selected cities. Named waterways: Moselle.

The colours represent idealised natural cover; they do not correspond to elevation classes. This global background remains generalised, particularly for small states.

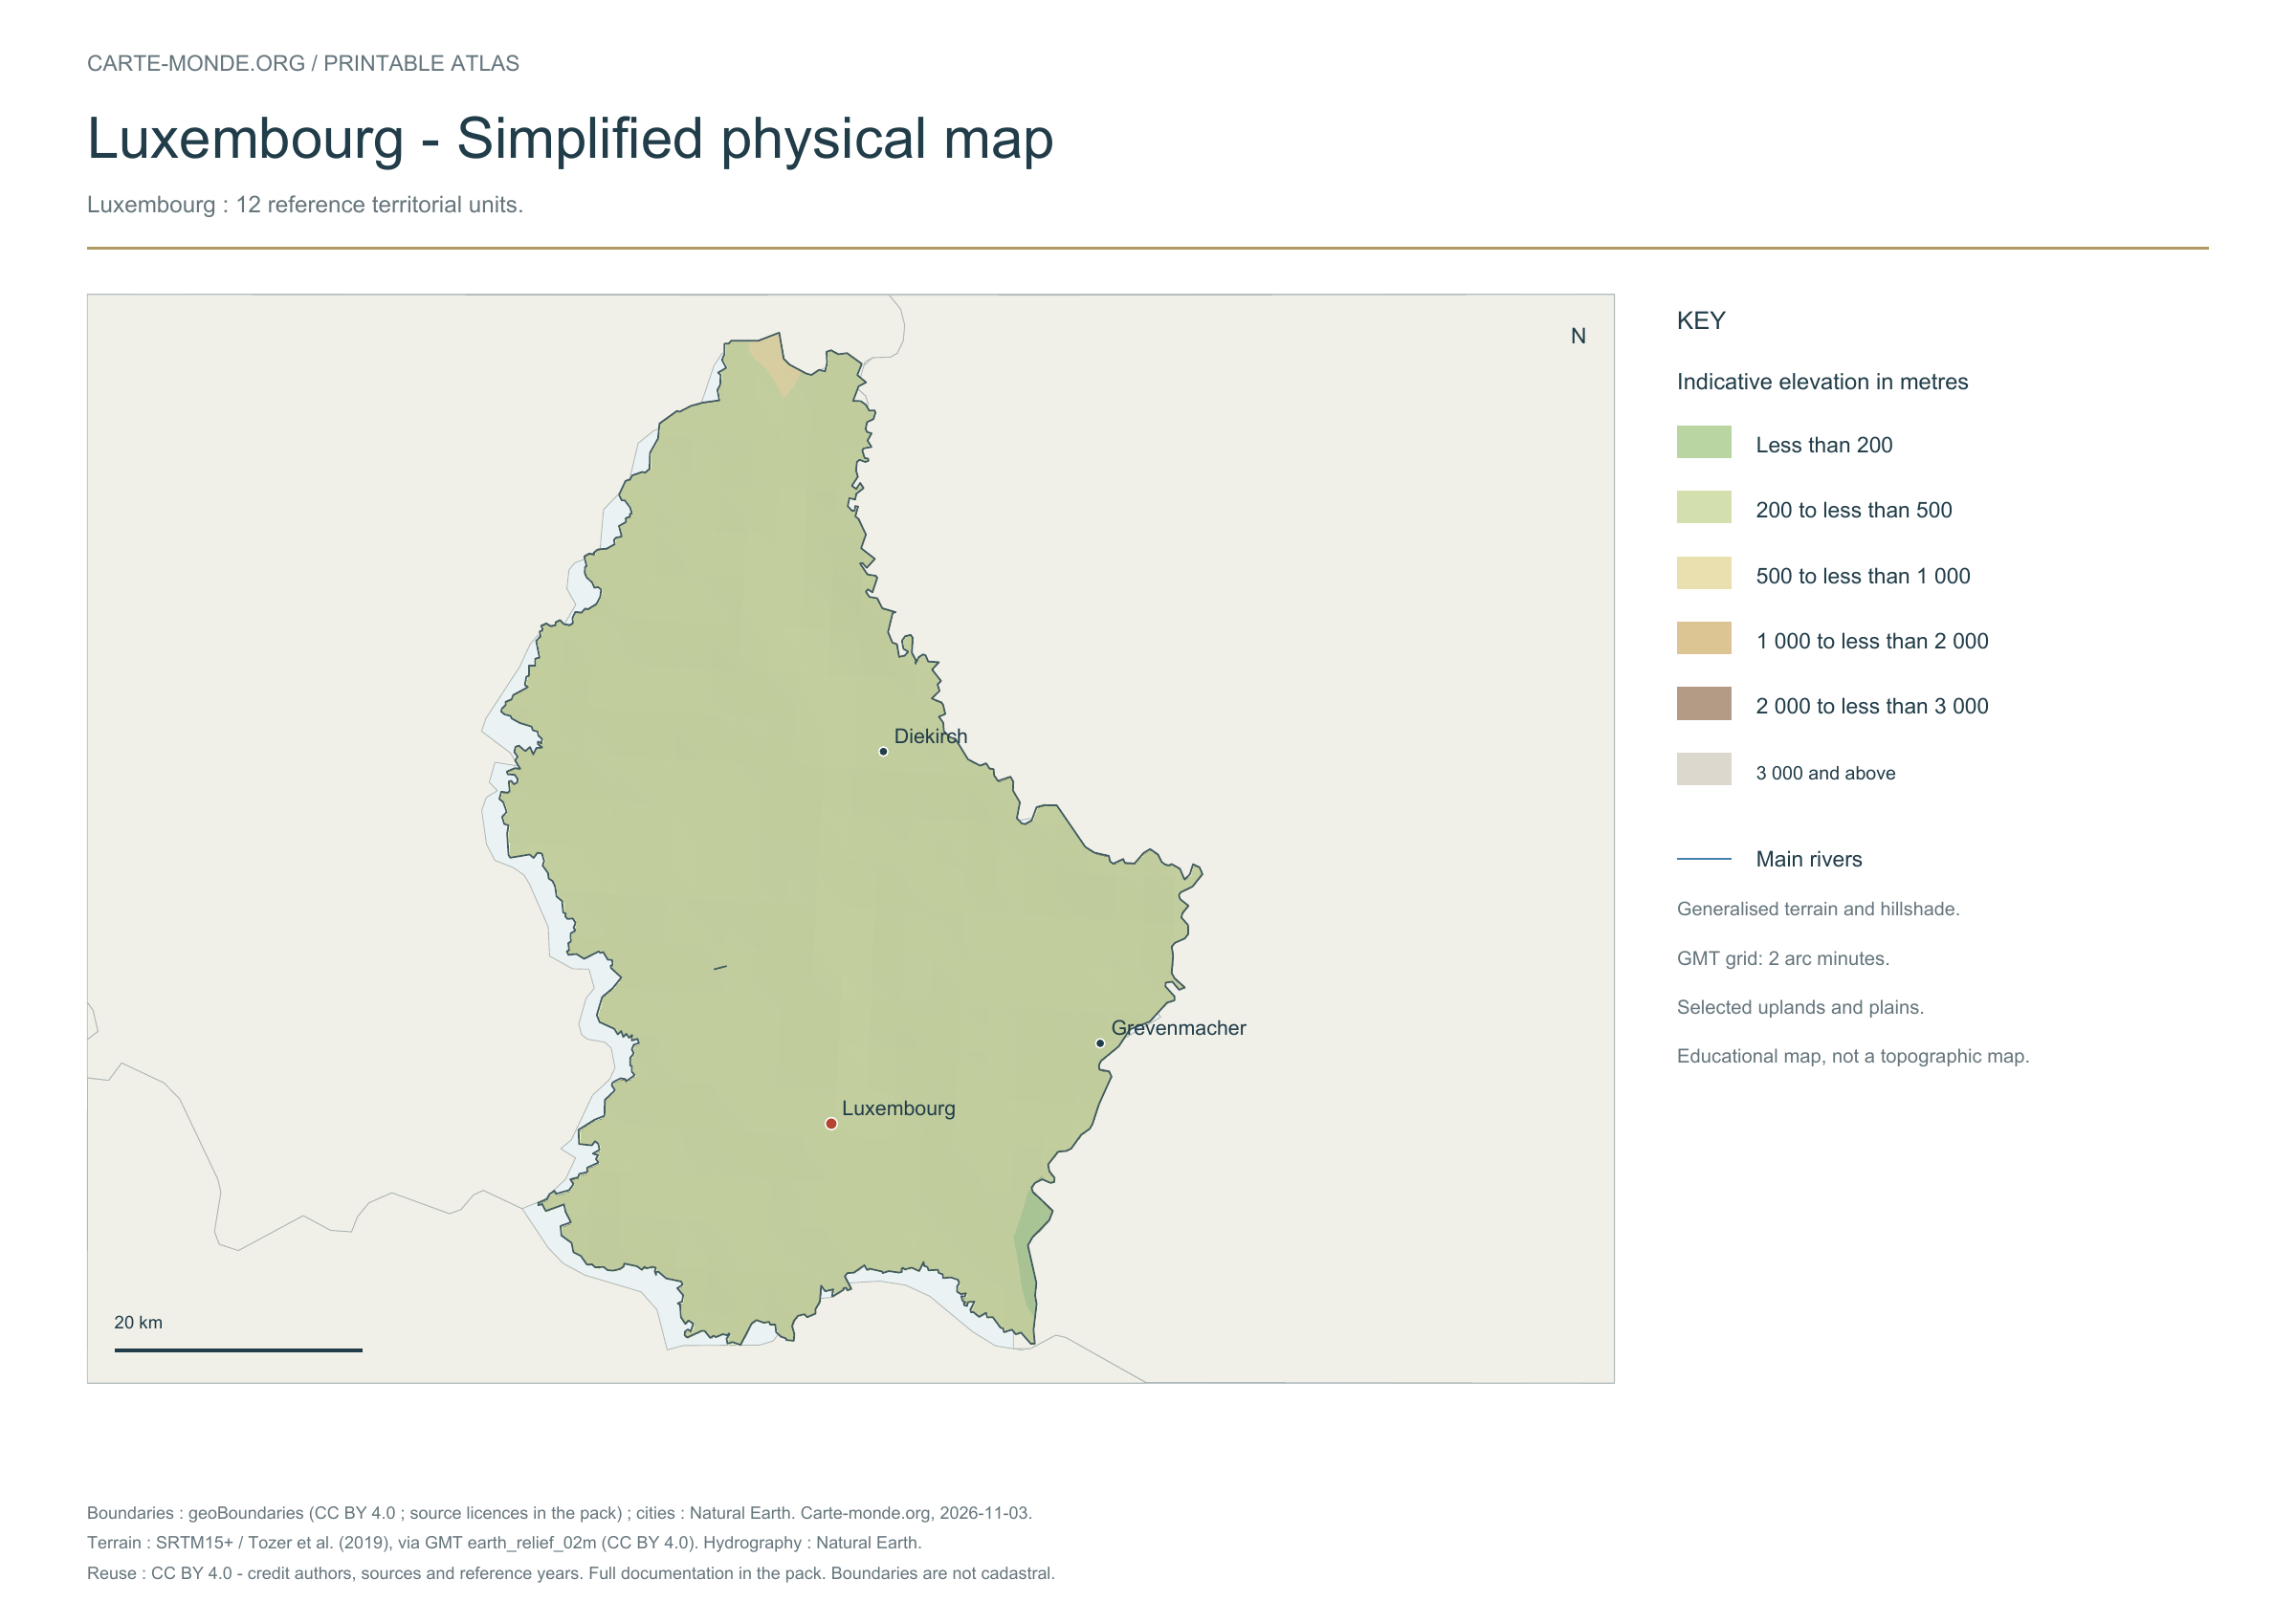
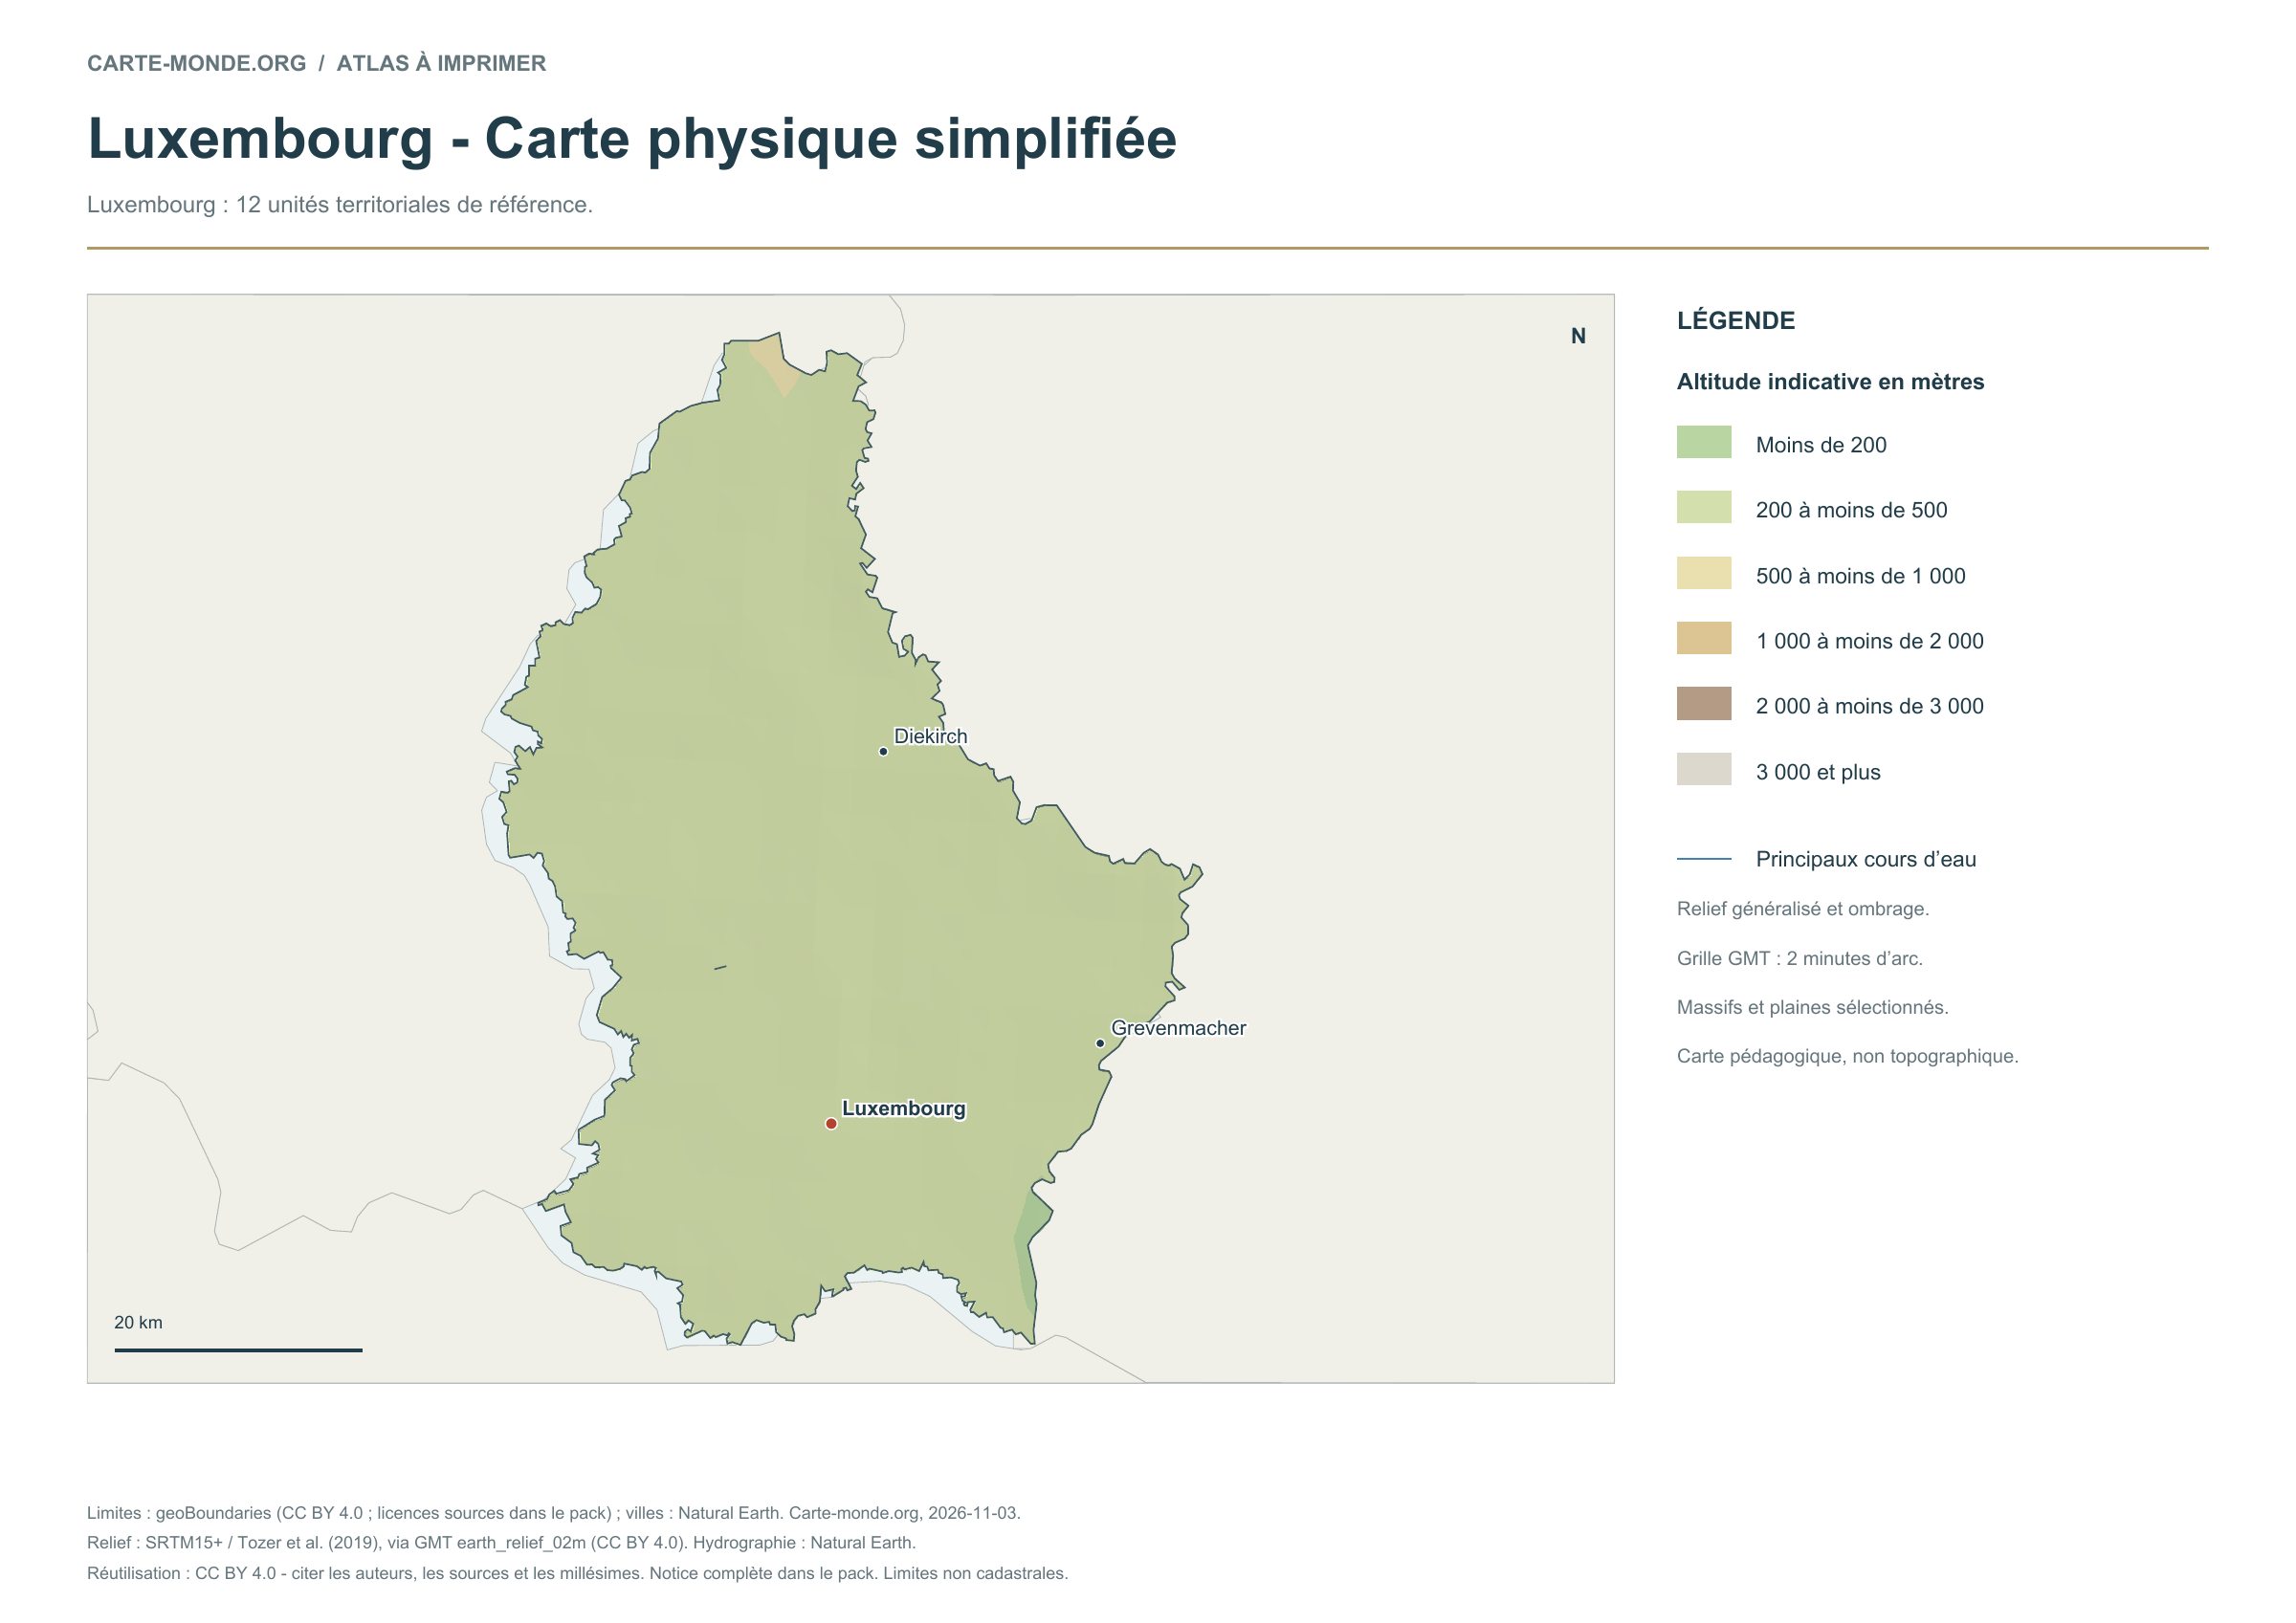
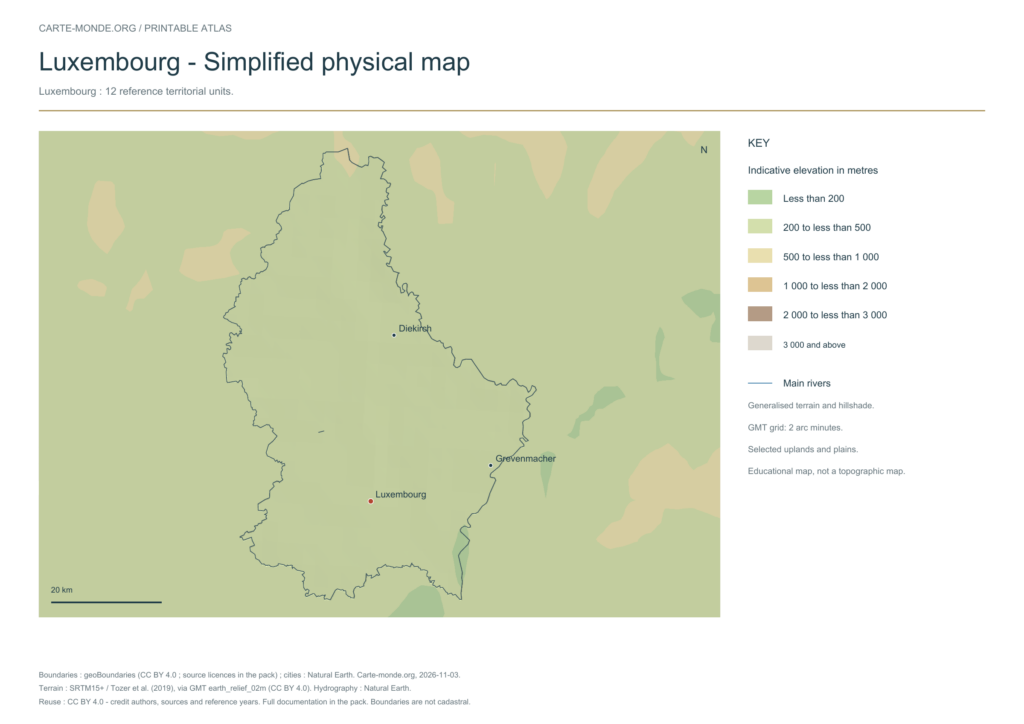
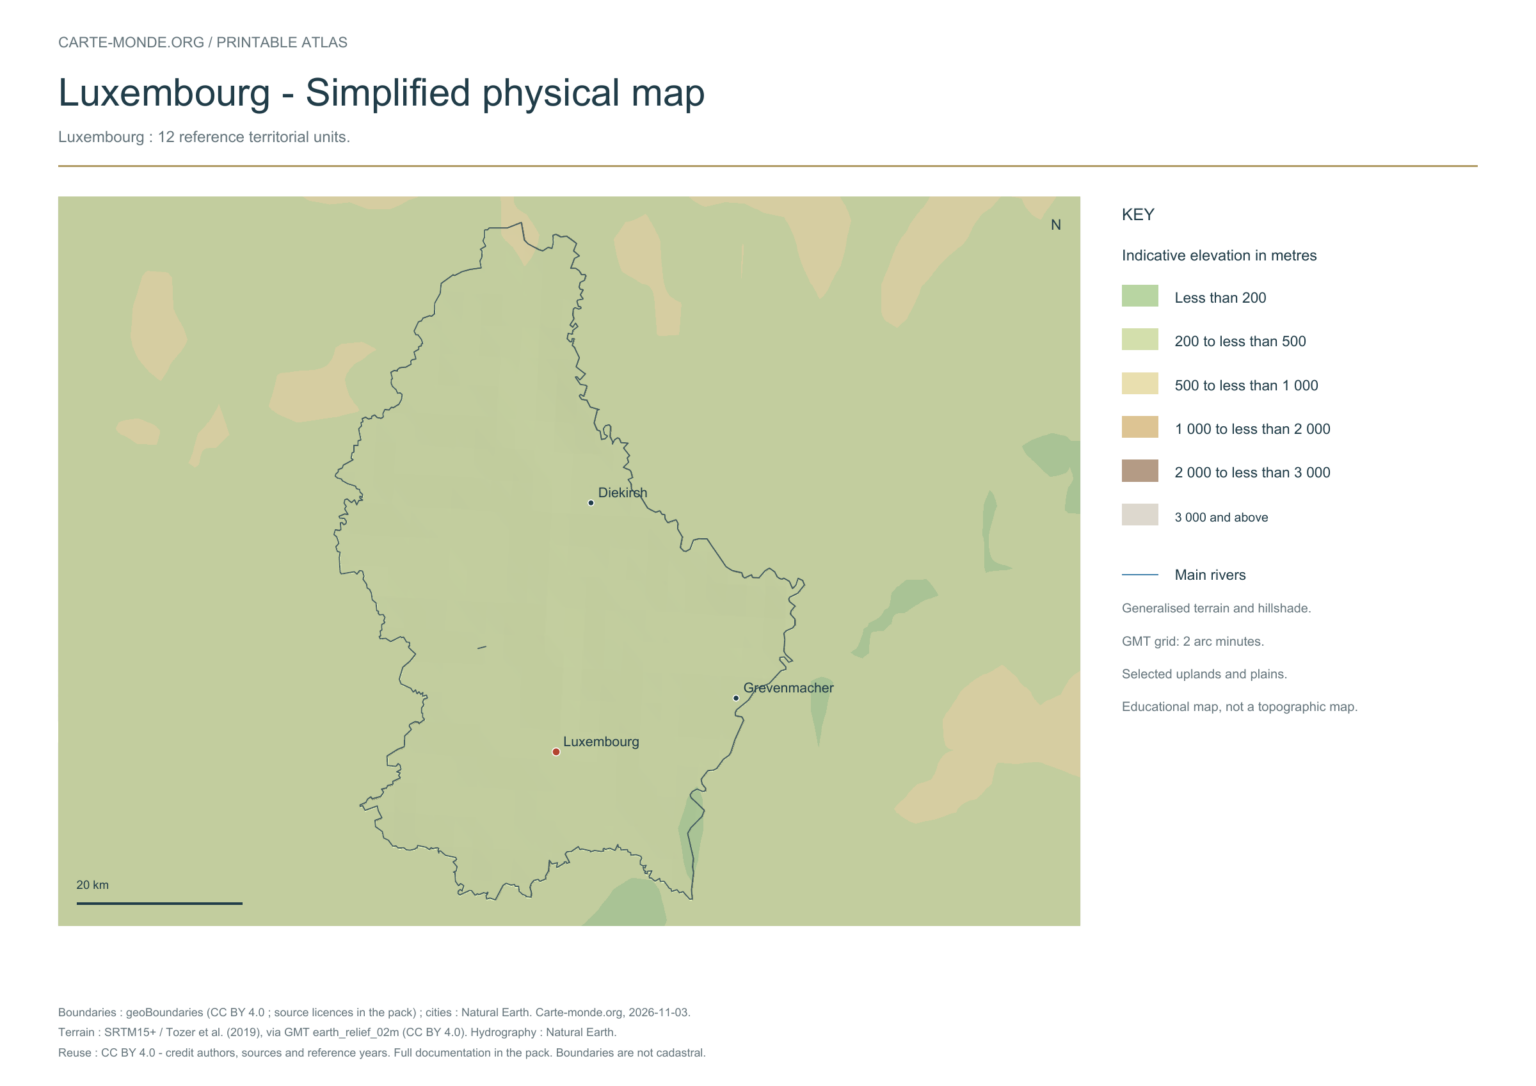
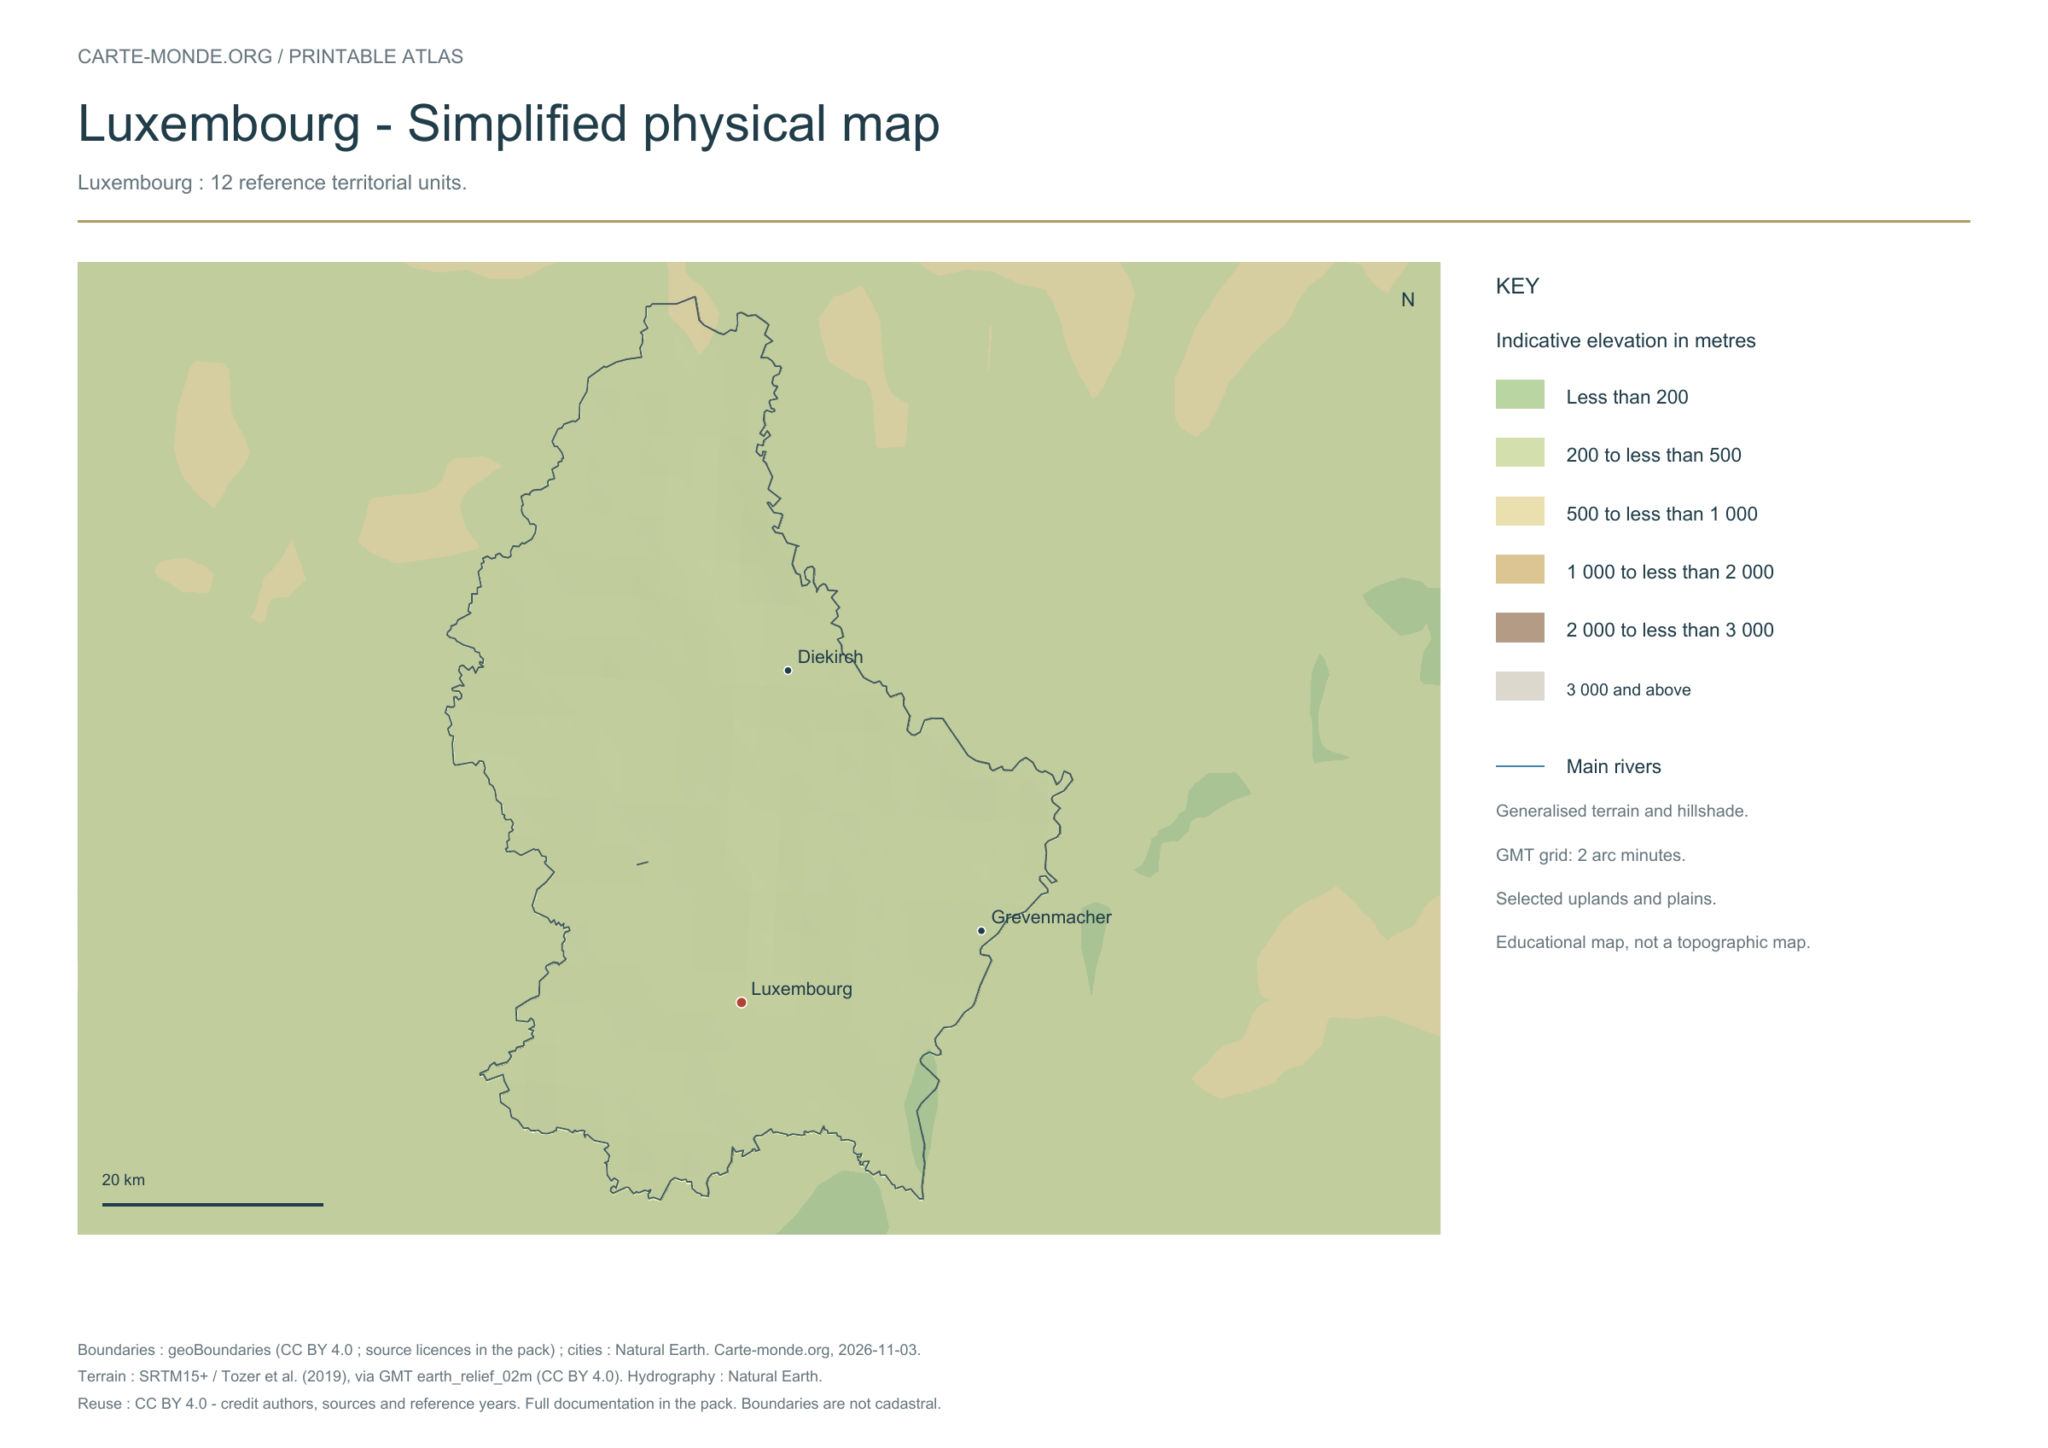
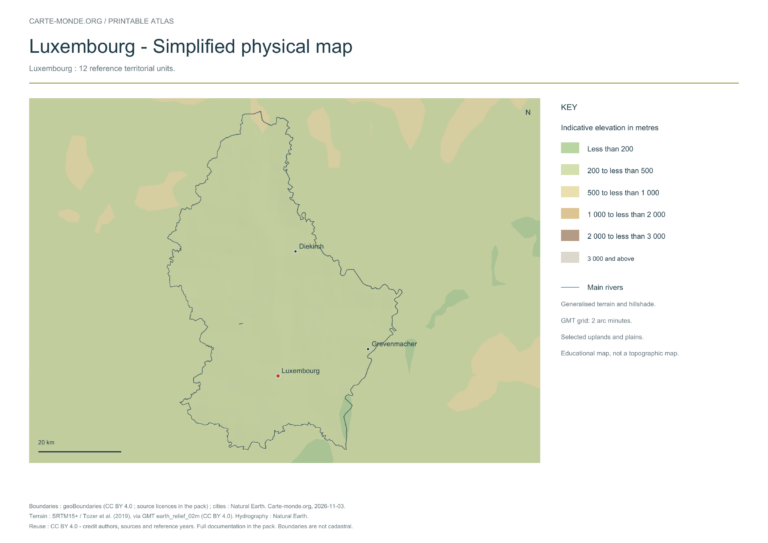
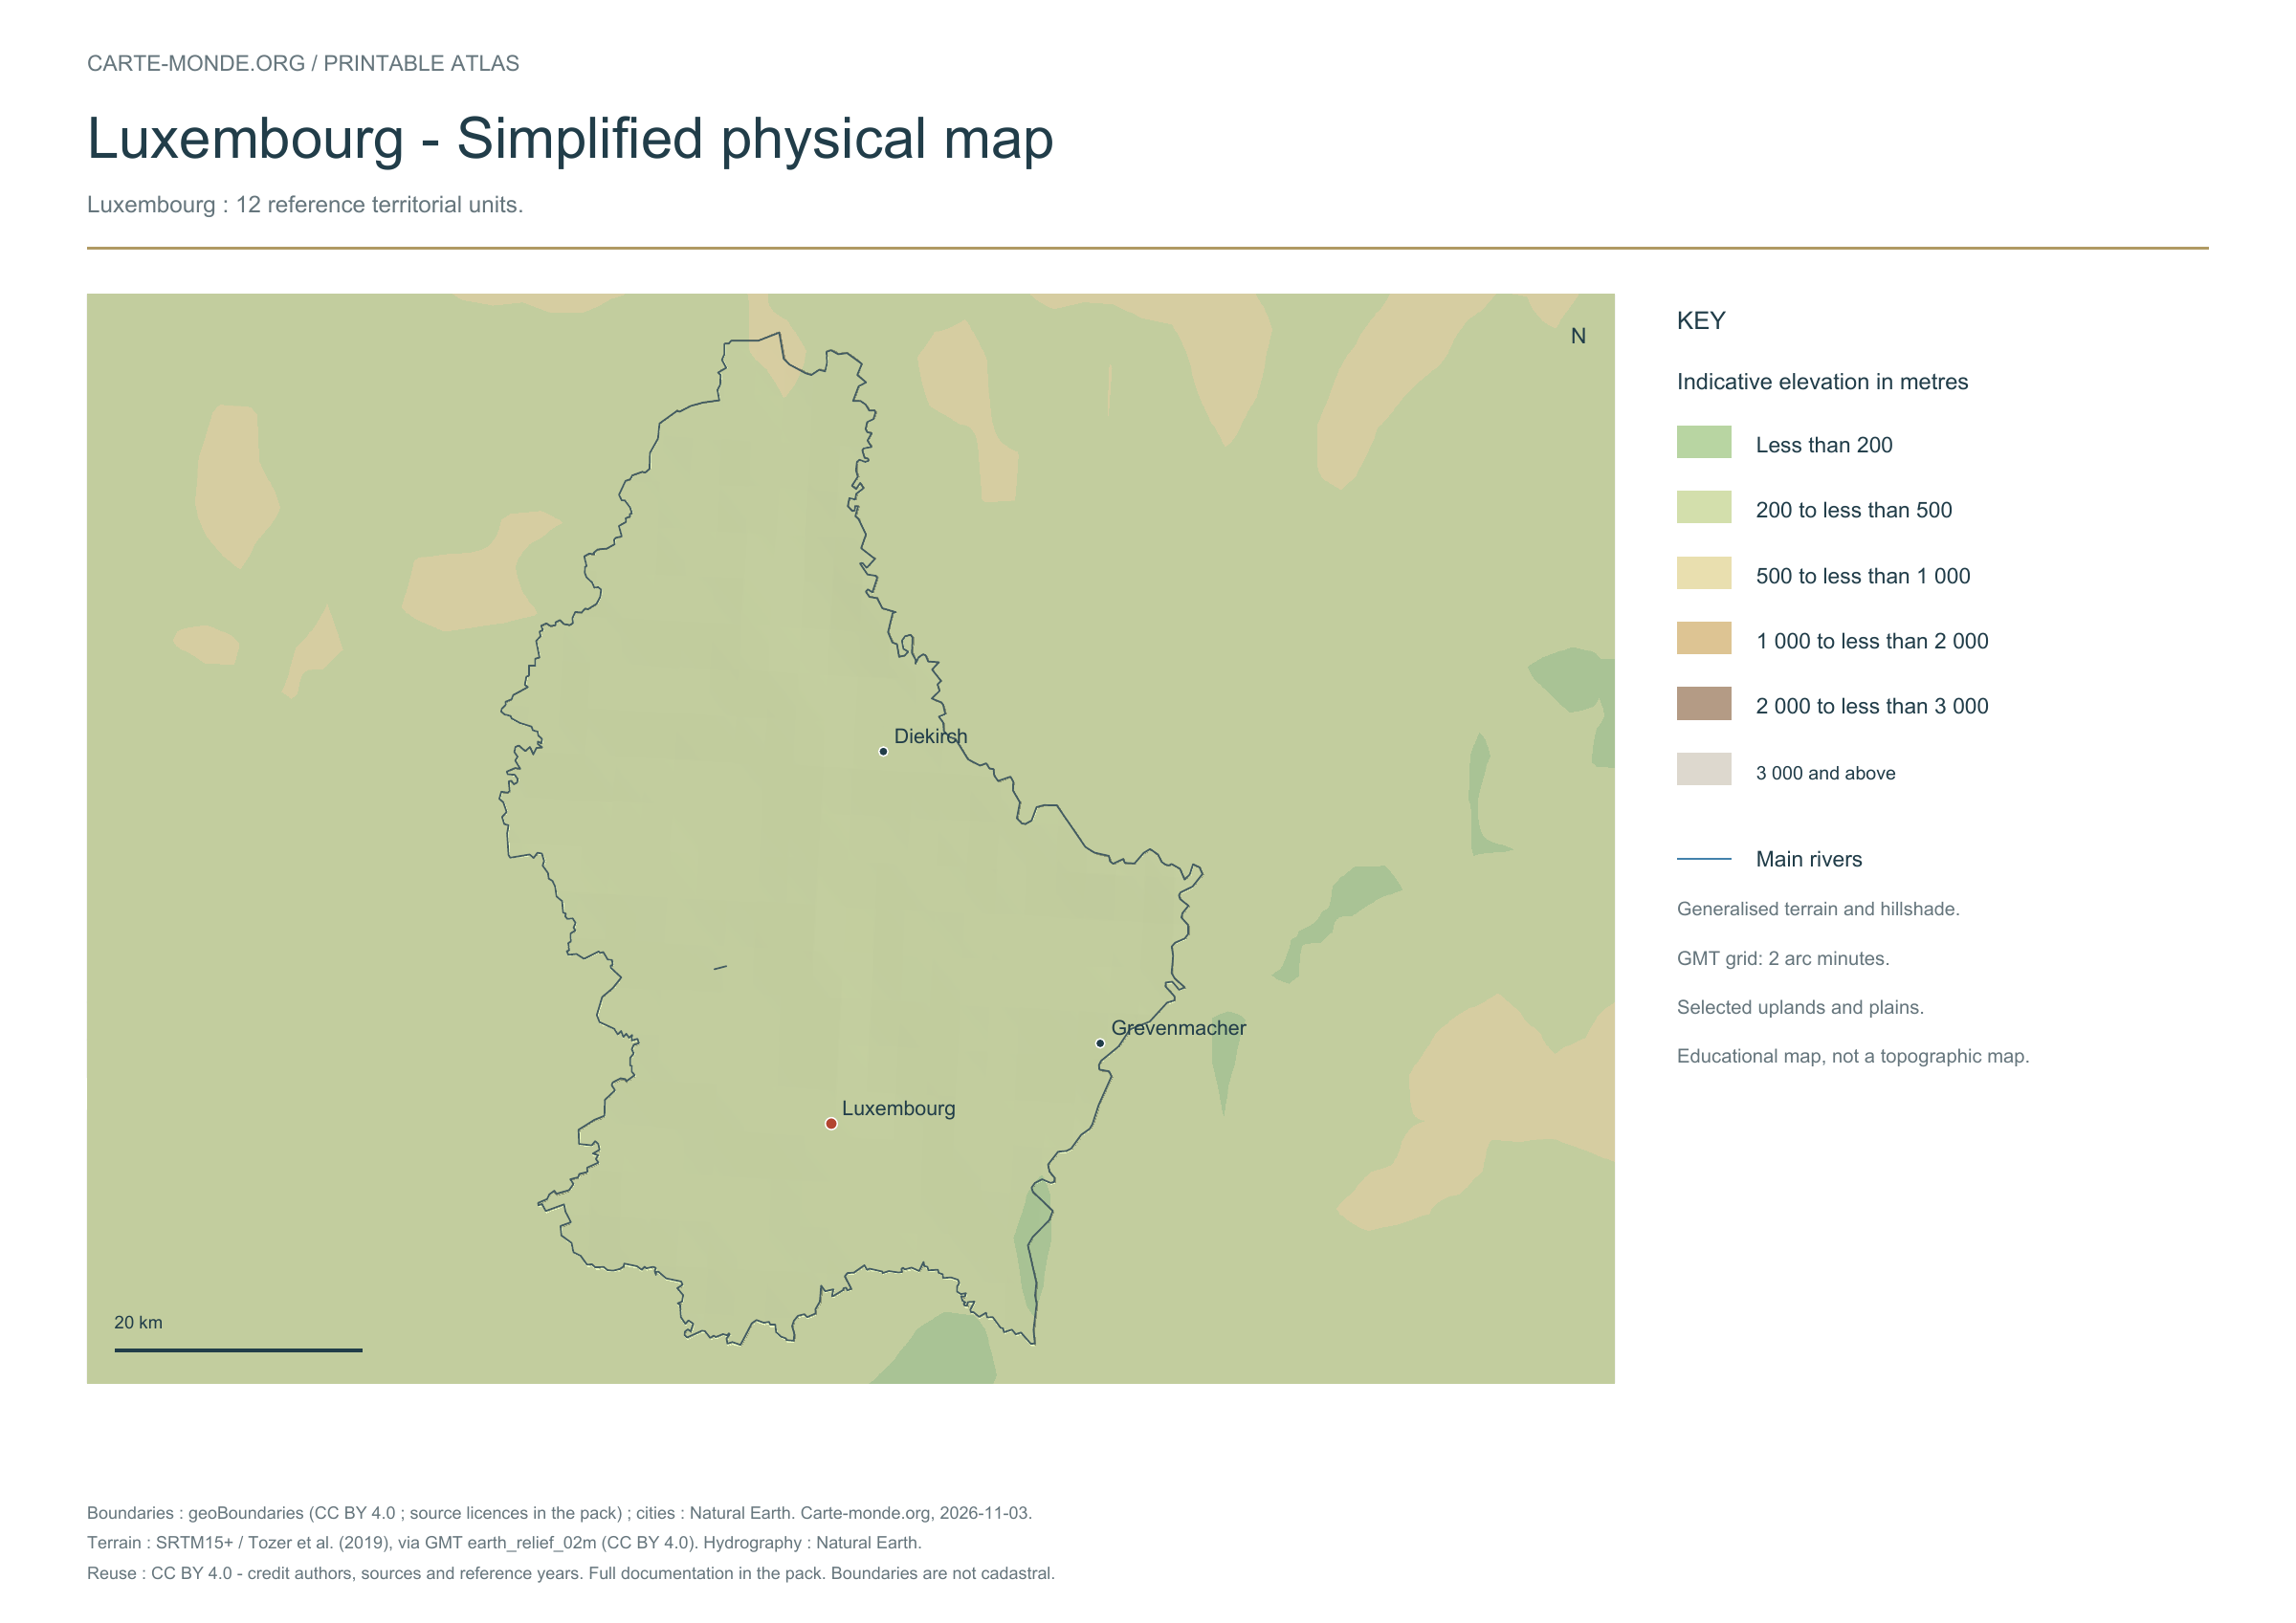
Simplified physical map — Luxembourg

Carte-monde.org · November 2026

Simplified elevations

Smoothed relief, elevation colours, main mountain ranges, plains and watercourses. Educational map at national scale.

A4 landscape PDF · PNG 2 400 px · CC BY 4.0

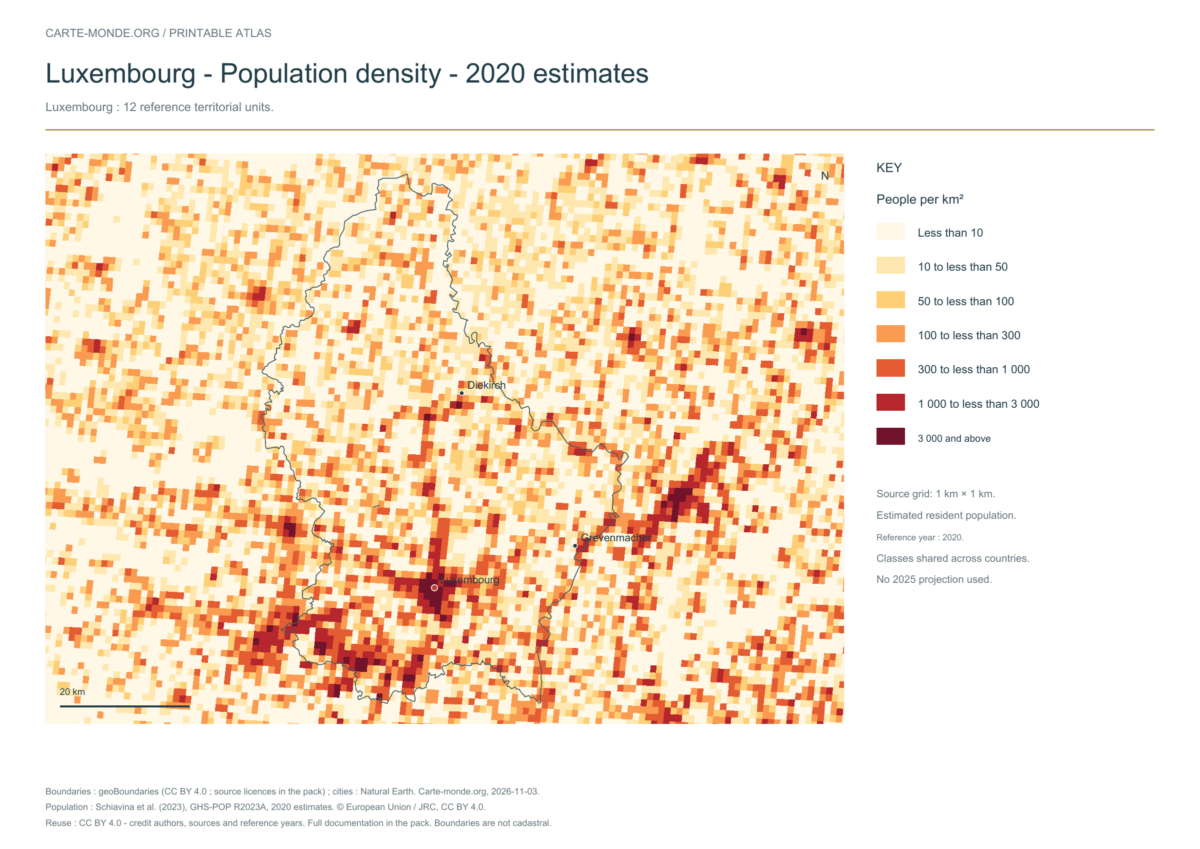
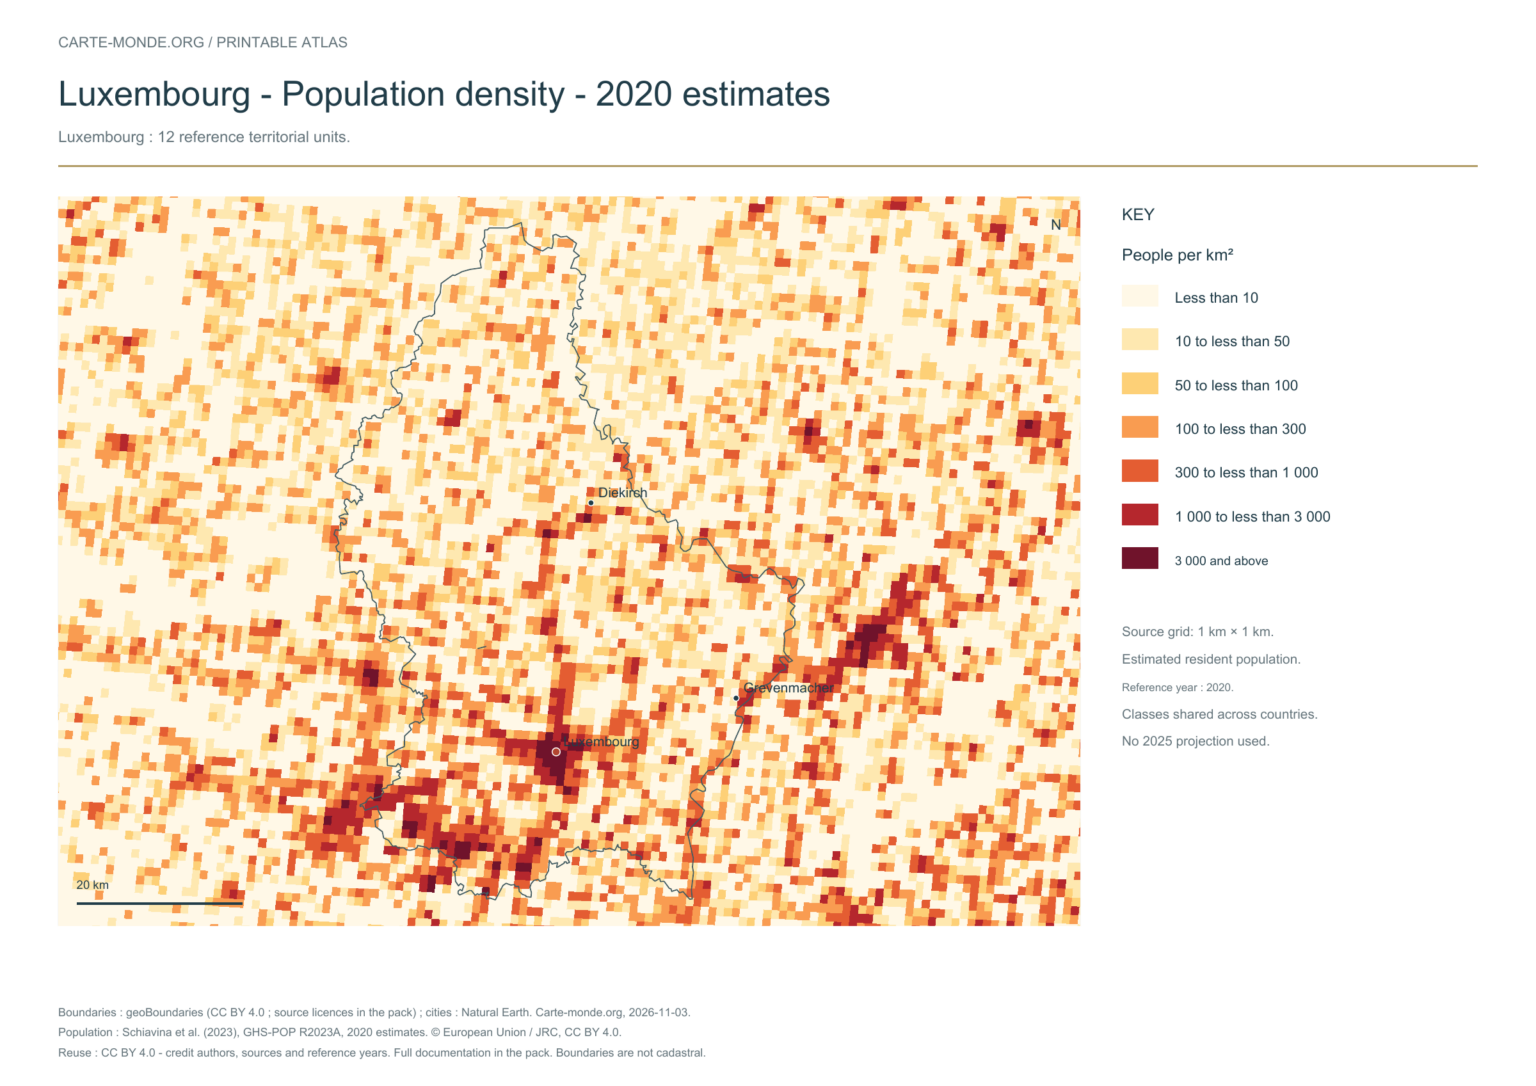
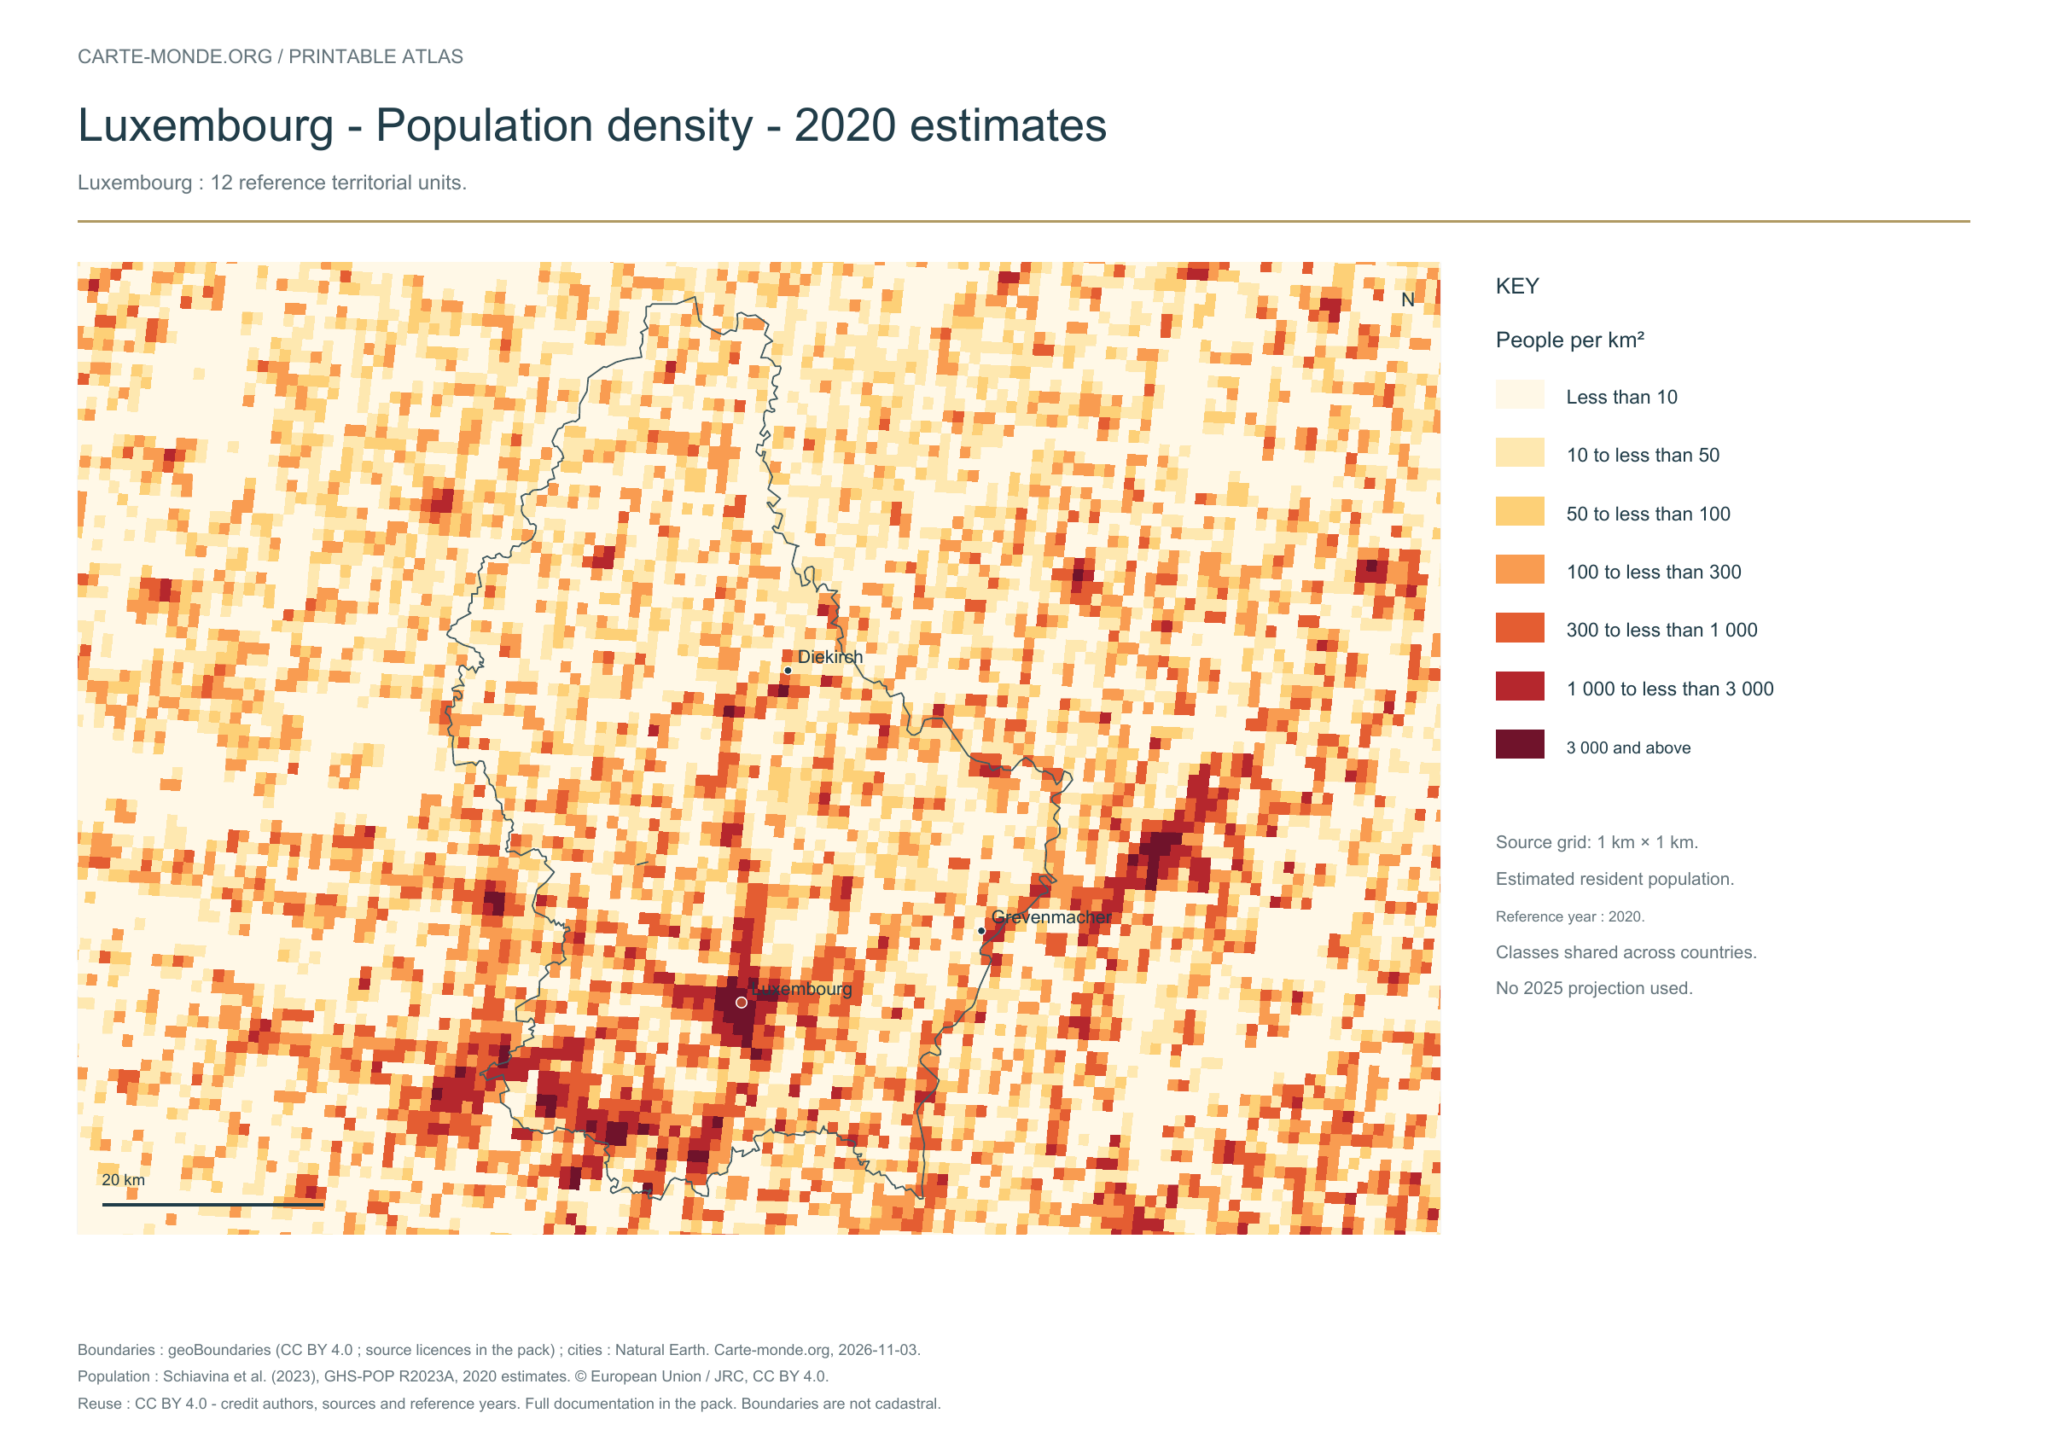
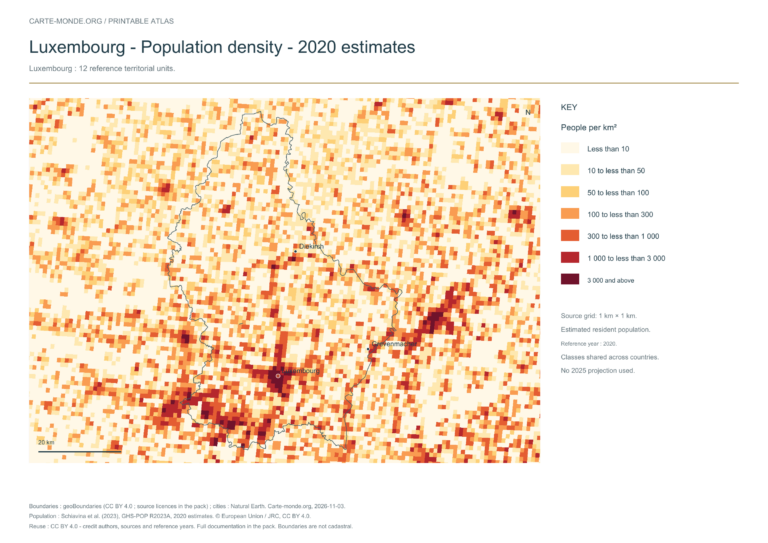
Population density: 2020 estimates

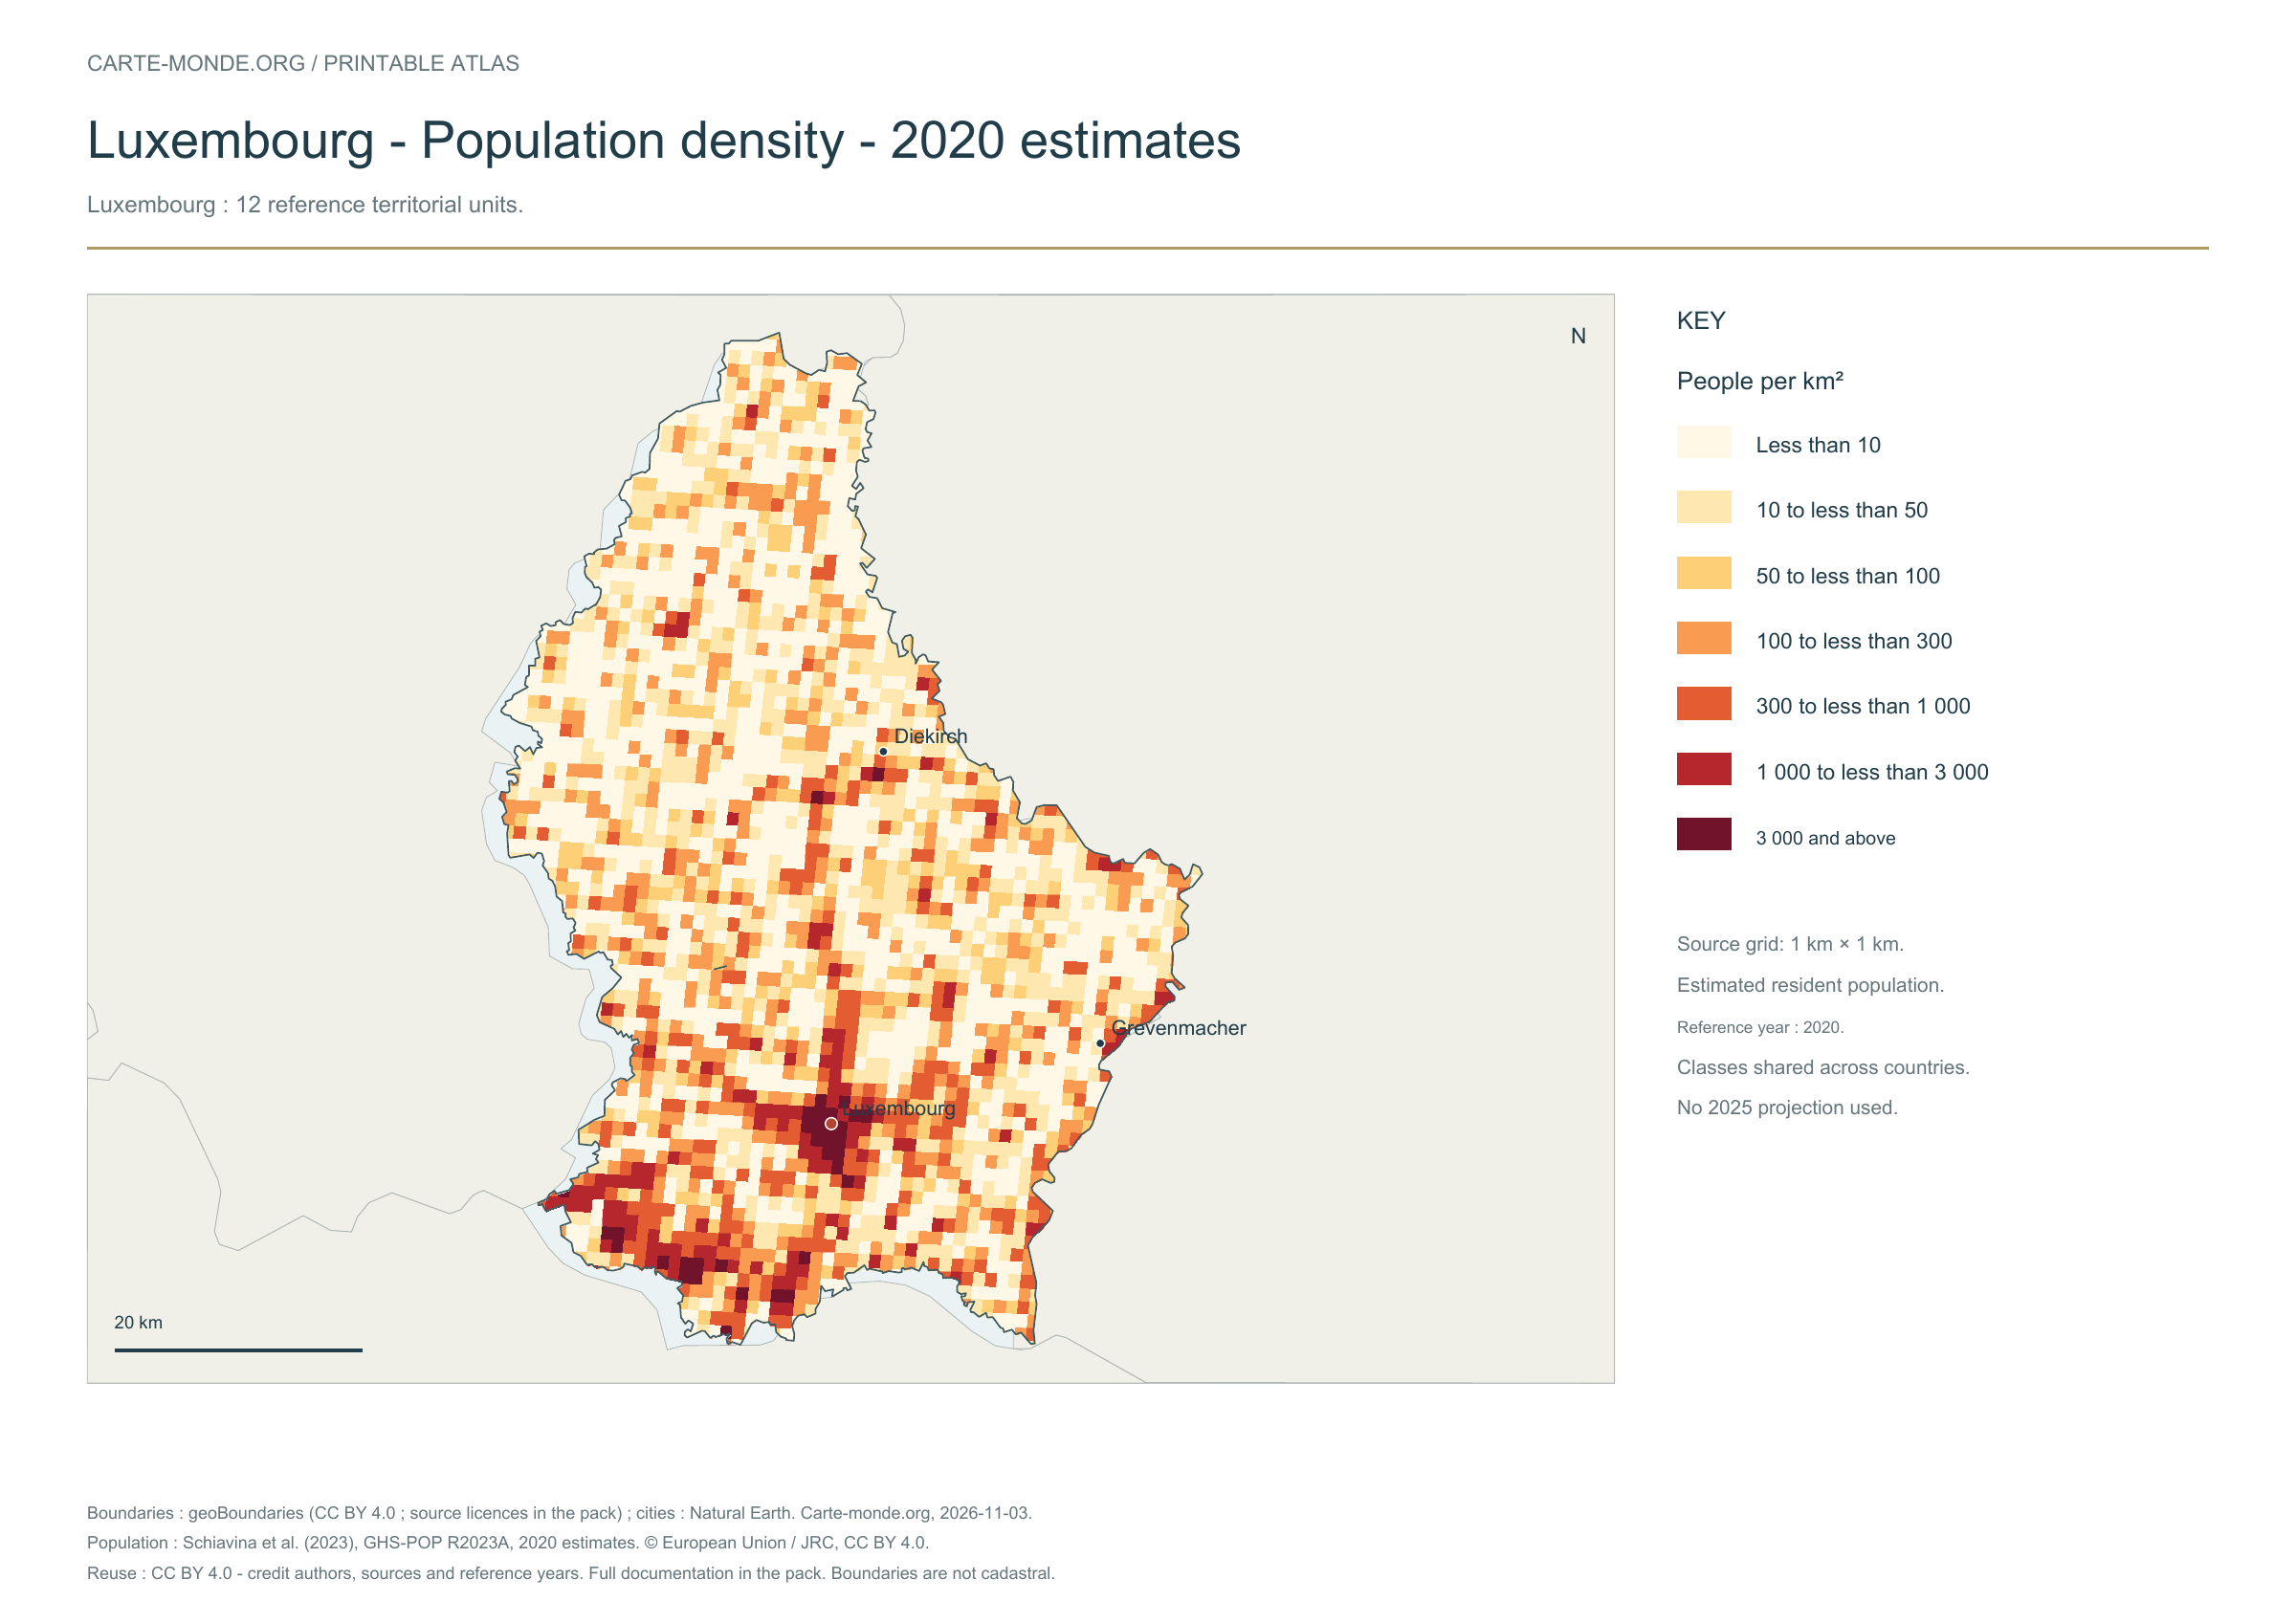
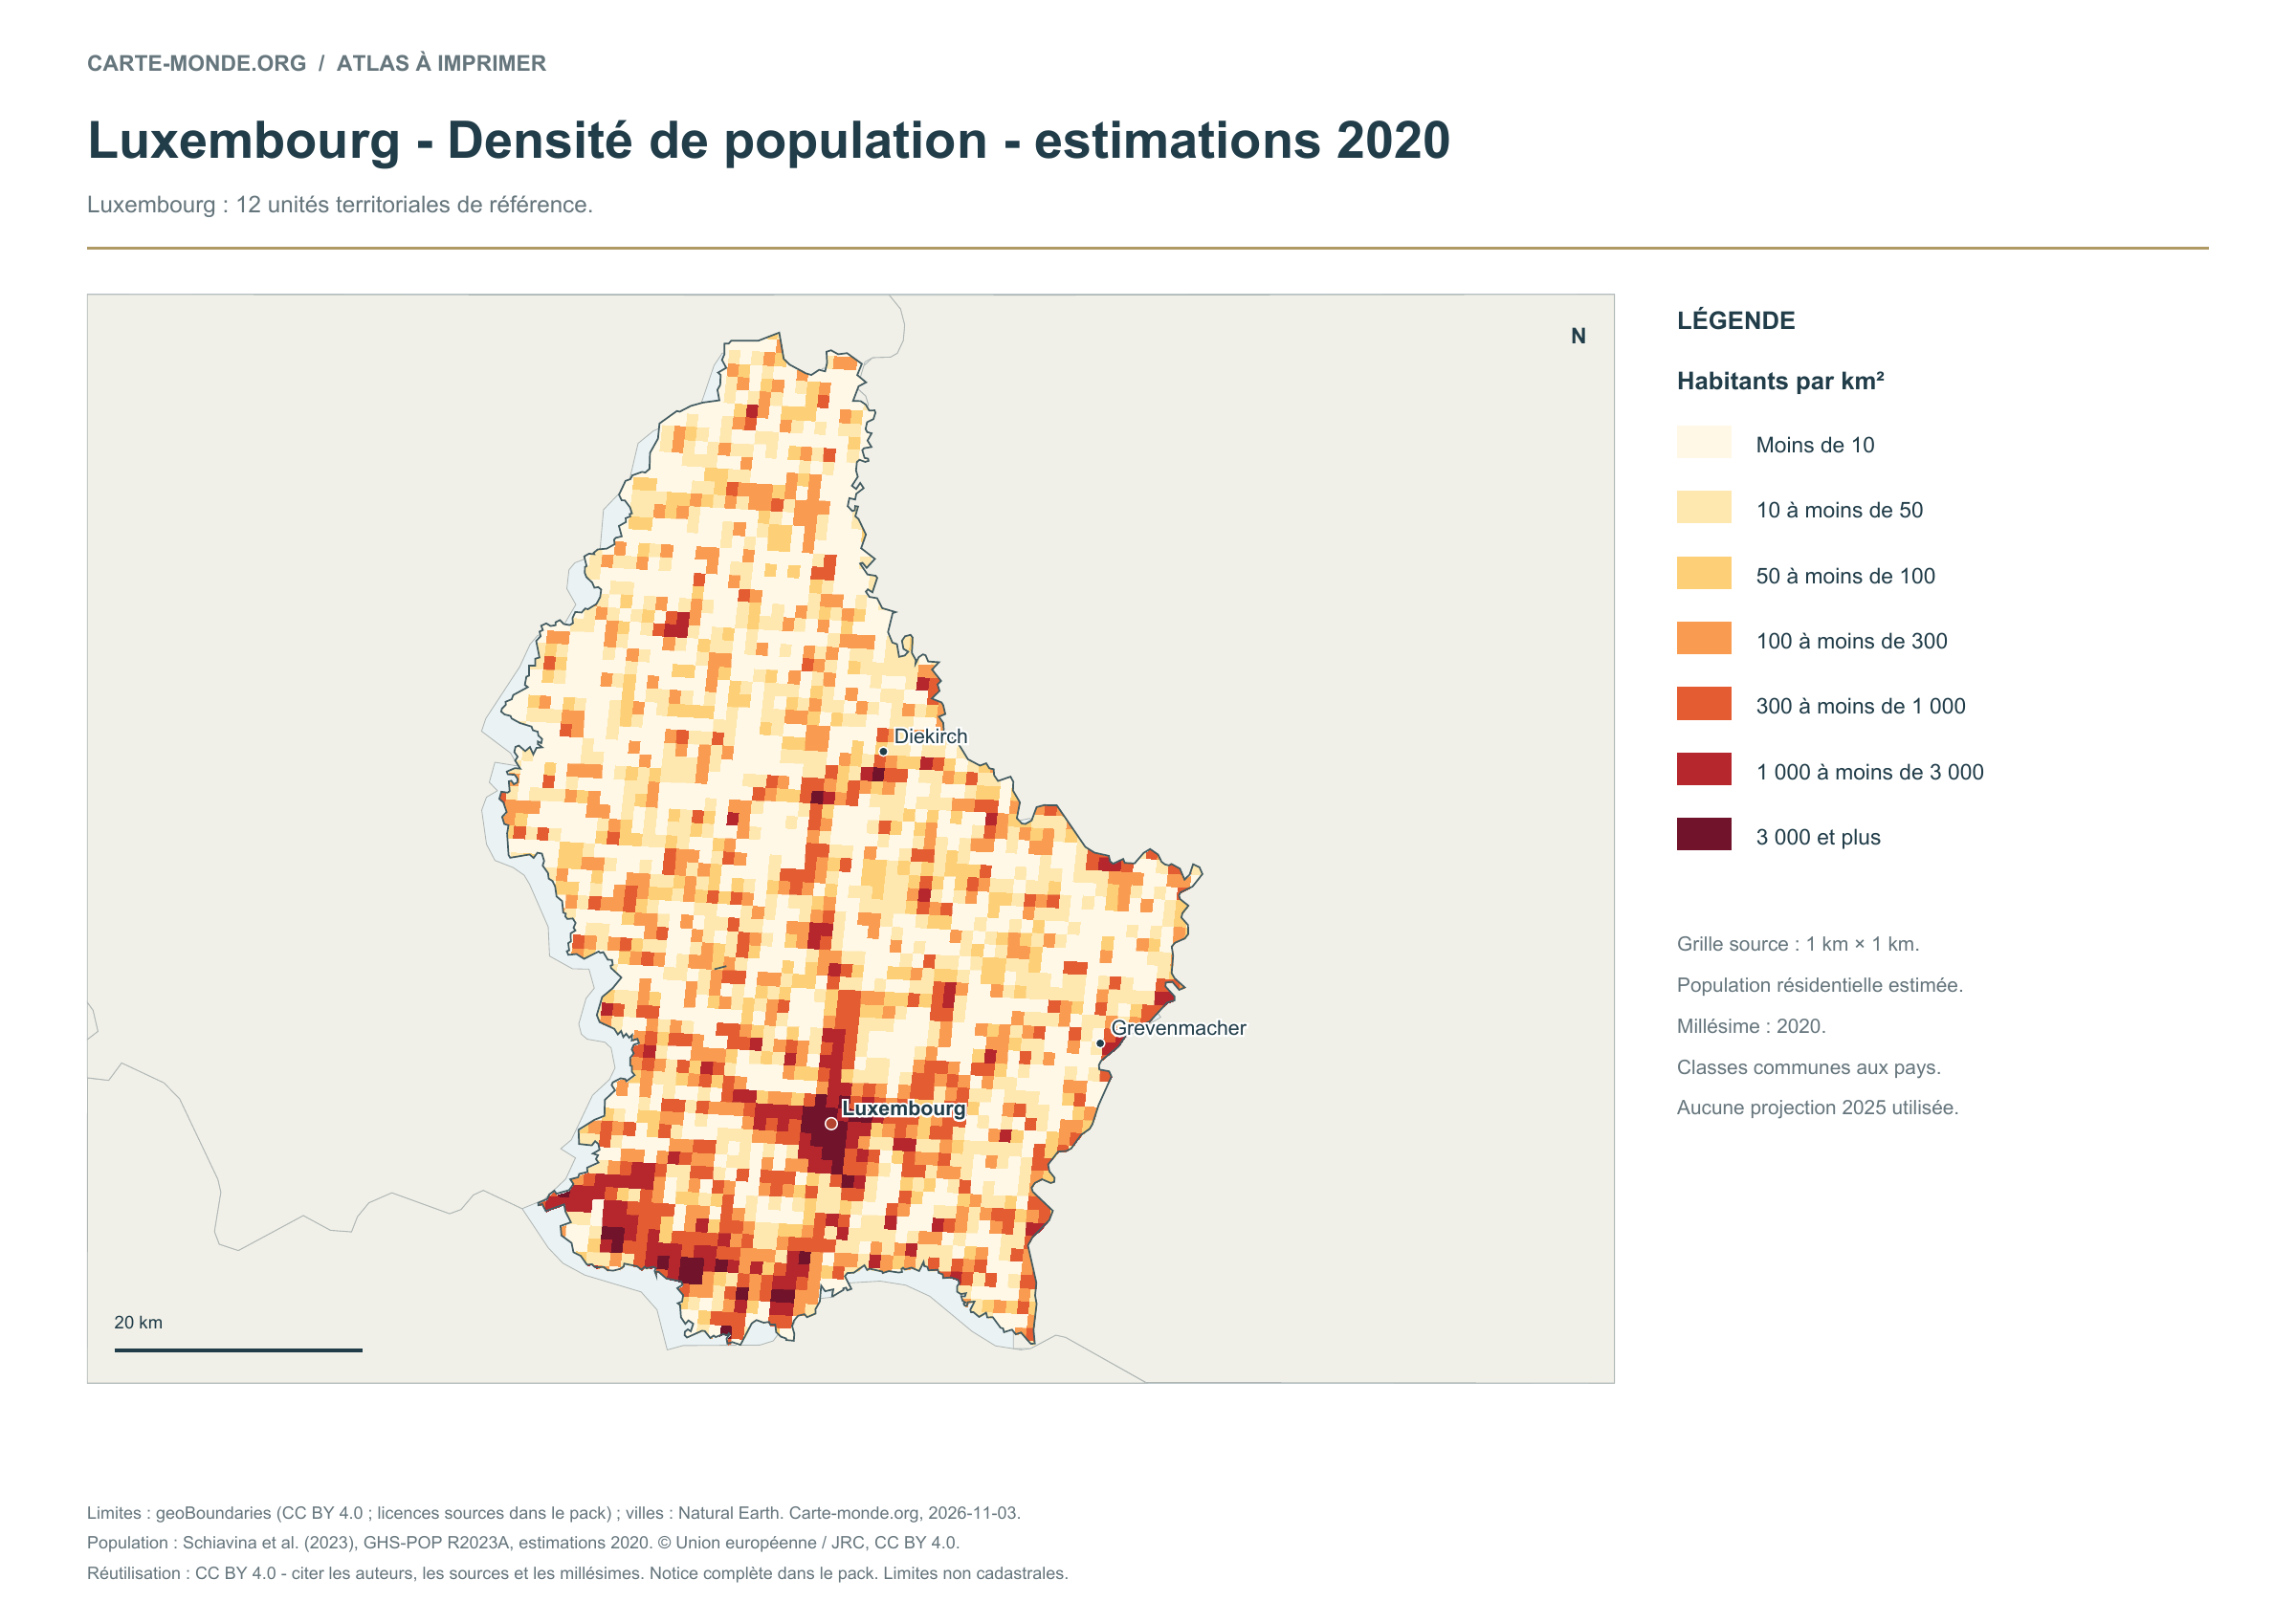
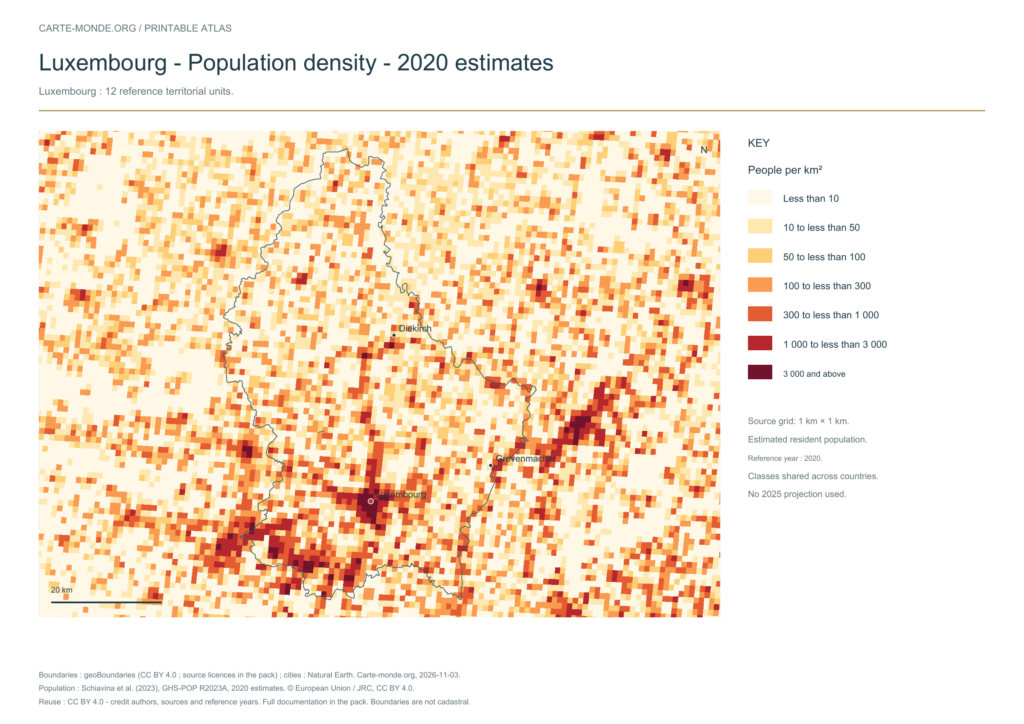
Population density — 2020 estimates — Luxembourg

Carte-monde.org · November 2026

Population density — 2020 estimates

Estimated residential population in 2020, on a source grid of 1 km². Inhabitants/km² classes are shared across countries; no 2025 projection.

A4 landscape PDF · PNG 2 400 px · CC BY 4.0

The data represents estimated residential population in 2020, on a 1 km² source grid. The document’s creation date does not change this reference year.

The five in-house maps in one pack

Regions and cities, location in Europe, simplified elevations, 2020 population density and shaded relief: five A4 PDFs, their PNGs and SVGs, with sources and licences.

Download the five maps — ZIP
Previous edition packs

The four maps in one pack

Four A4 PDFs, their PNGs and SVGs, with full notes. Terrain and density use an embedded image background; text and linework remain vector-based.

Download the Luxembourg pack — ZIP

Find the old maps of Luxembourg

Previously published maps remain accessible at their original URLs, with the collection’s text and credits.

Open the old maps of Luxembourg

Choose and print a map

Regions and cities show how the territory is organized; the location map places the country; terrain shows the main natural regions; density shows population distribution. Print the in-house PDFs in A4 landscape with “Fit to page”. Insets have their own scales.

For exercises: six blank base maps of Luxembourg.

Sources, reference years and reuse

Administrative boundaries: geoBoundaries / OpenStreetMap, Wambacher. Luxembourg — Geographic reference year: 2017. The files’ edition date does not mean that all boundaries have been updated. Boundary source and terms. Primary licence: Open Data Commons Open Database License 1.0. The geometries used and credits are included in the pack; derived databases under ODbL remain under ODbL.

Neighbouring area, cities and hydrography: Natural Earth 5.1.1, public domain, generalised boundaries not for cadastral use.

Relief: SRTM15+ / Tozer et al. (2019), reference publication, via GMT earth_relief_02m derived from SRTM15+V2.7. Grid smoothed to two arc minutes, suitable for a national overview, without topographic precision.

Population: Schiavina et al. (2023), GHS-POP R2023A, 2020 residential estimates, © European Union / JRC, CC BY 4.0. The 1 km² Mollweide cells are expressed in inhabitants/km². Methodology: Pesaresi et al. (2024).

The four new maps: created by Carte-monde.org, November 2026, under CC BY 4.0. Cite authors, sources and reference years, and indicate adaptations. Additional and older maps retain their own rights.

Country maps · Other maps and archives

Previous versions: maps and files preserved

These files remain available at their original URLs. For corrected maps, use the main links above. Each edition retains its credits and date.

Raster base map, cities, rivers and lakes: Natural Earth, public domain. Other boundary credits and licences are retained in the pack. Cartographic work CC BY 4.0; ODbL-derived data retains its licence. No topographic accuracy is claimed.

Other maps: sources and reuse

Reference maps by external authors. Each document retains its licence, credits and date. “View map” links open the document on Commons; ZIP buttons provide access to the files kept in this collection.

Luxemburg Topographisch.png
Author: Carport · CC BY-SA 3.0 · Original file page, sources and licence

Date stated by the source: 15 December 2012. The data year may differ from the document date; consult its legend.

View the map on Commons

To reuse a CC BY map, cite its authors, source and licence and indicate any changes. Adaptations of a CC BY-SA map retain the same or a compatible licence. CC0 documents may be reused freely; retaining the source makes them easier to identify. These rights do not make all administrative boundaries current.
Previous collection — original files preserved
Flag of Luxembourg
Flag of Luxembourg
Online Maps of Luxembourg
luxembourg, relief map
Original French files
Previous language edition

Maps of the Netherlands: regions, cities, relief and population

Flag of the Netherlands

NETHERLANDS · PRINTABLE MAPS

Five printable maps of the Netherlands: regions and cities, location in Europe, two views of the relief and population. PDFs, images and sources are available below.

Our five maps have English labels. Maps from other publishers retain their original language.

Regions, cities and location in Europe

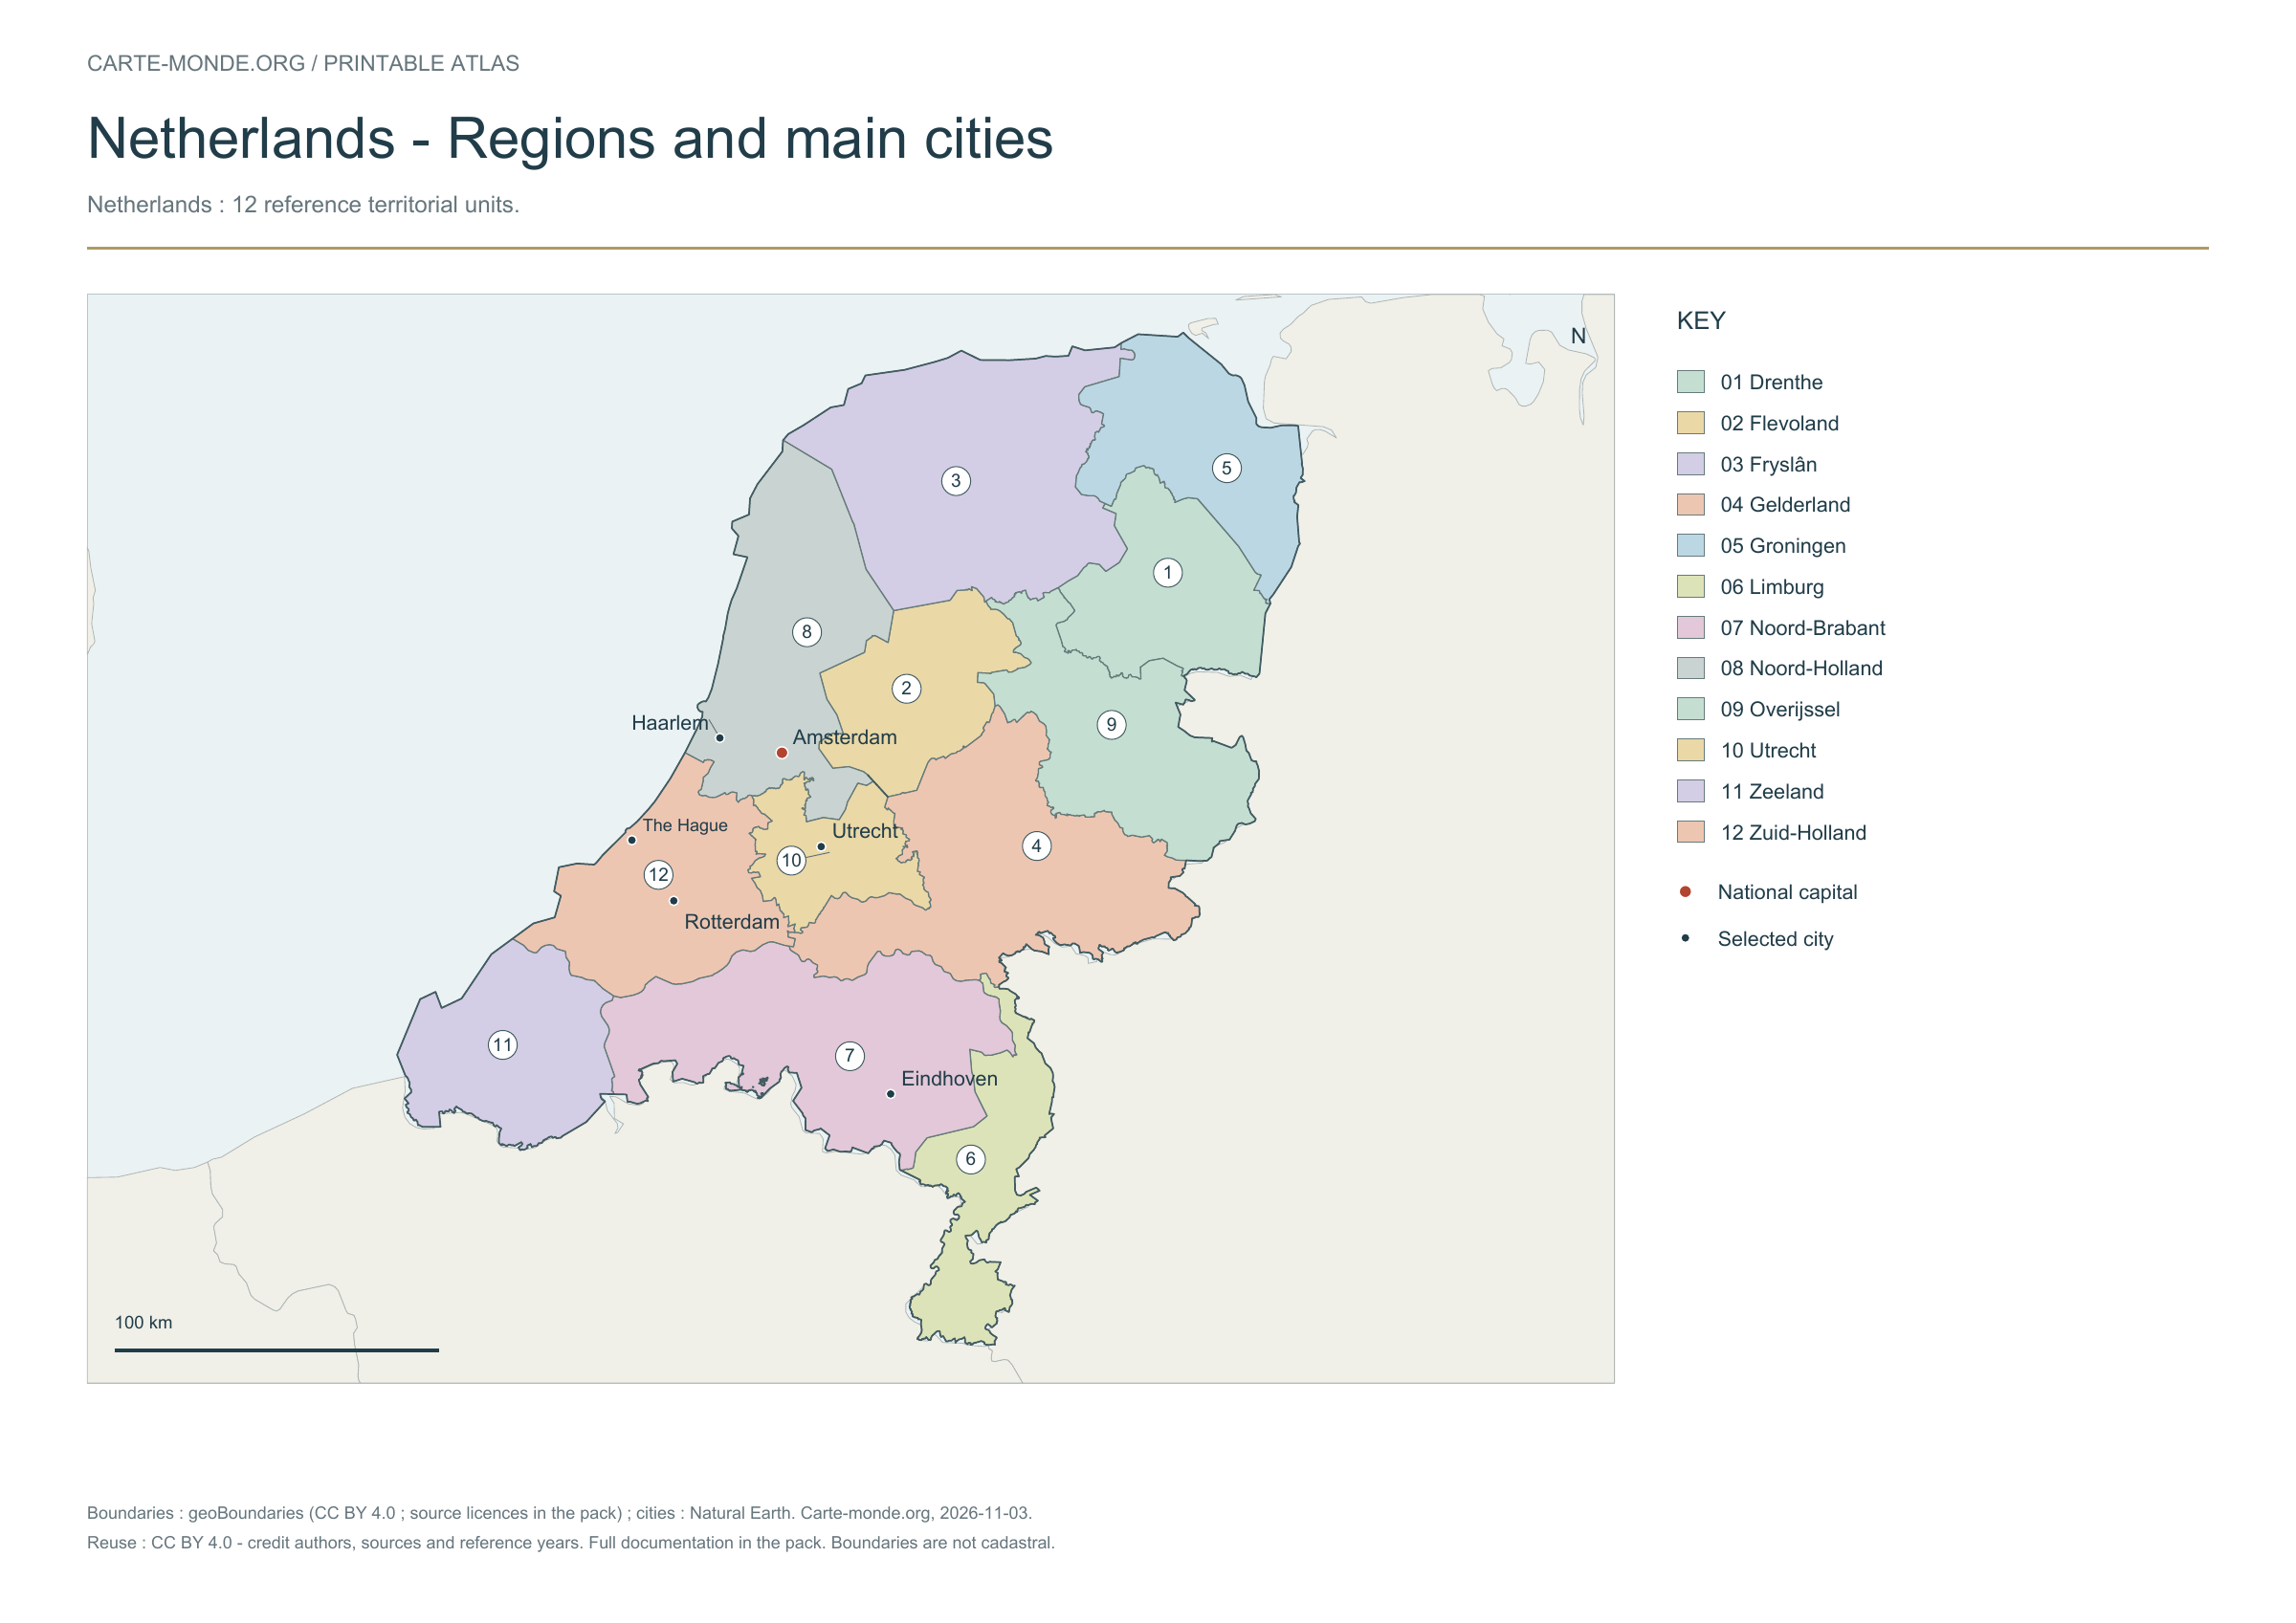
Netherlands: 12 reference territorial units.

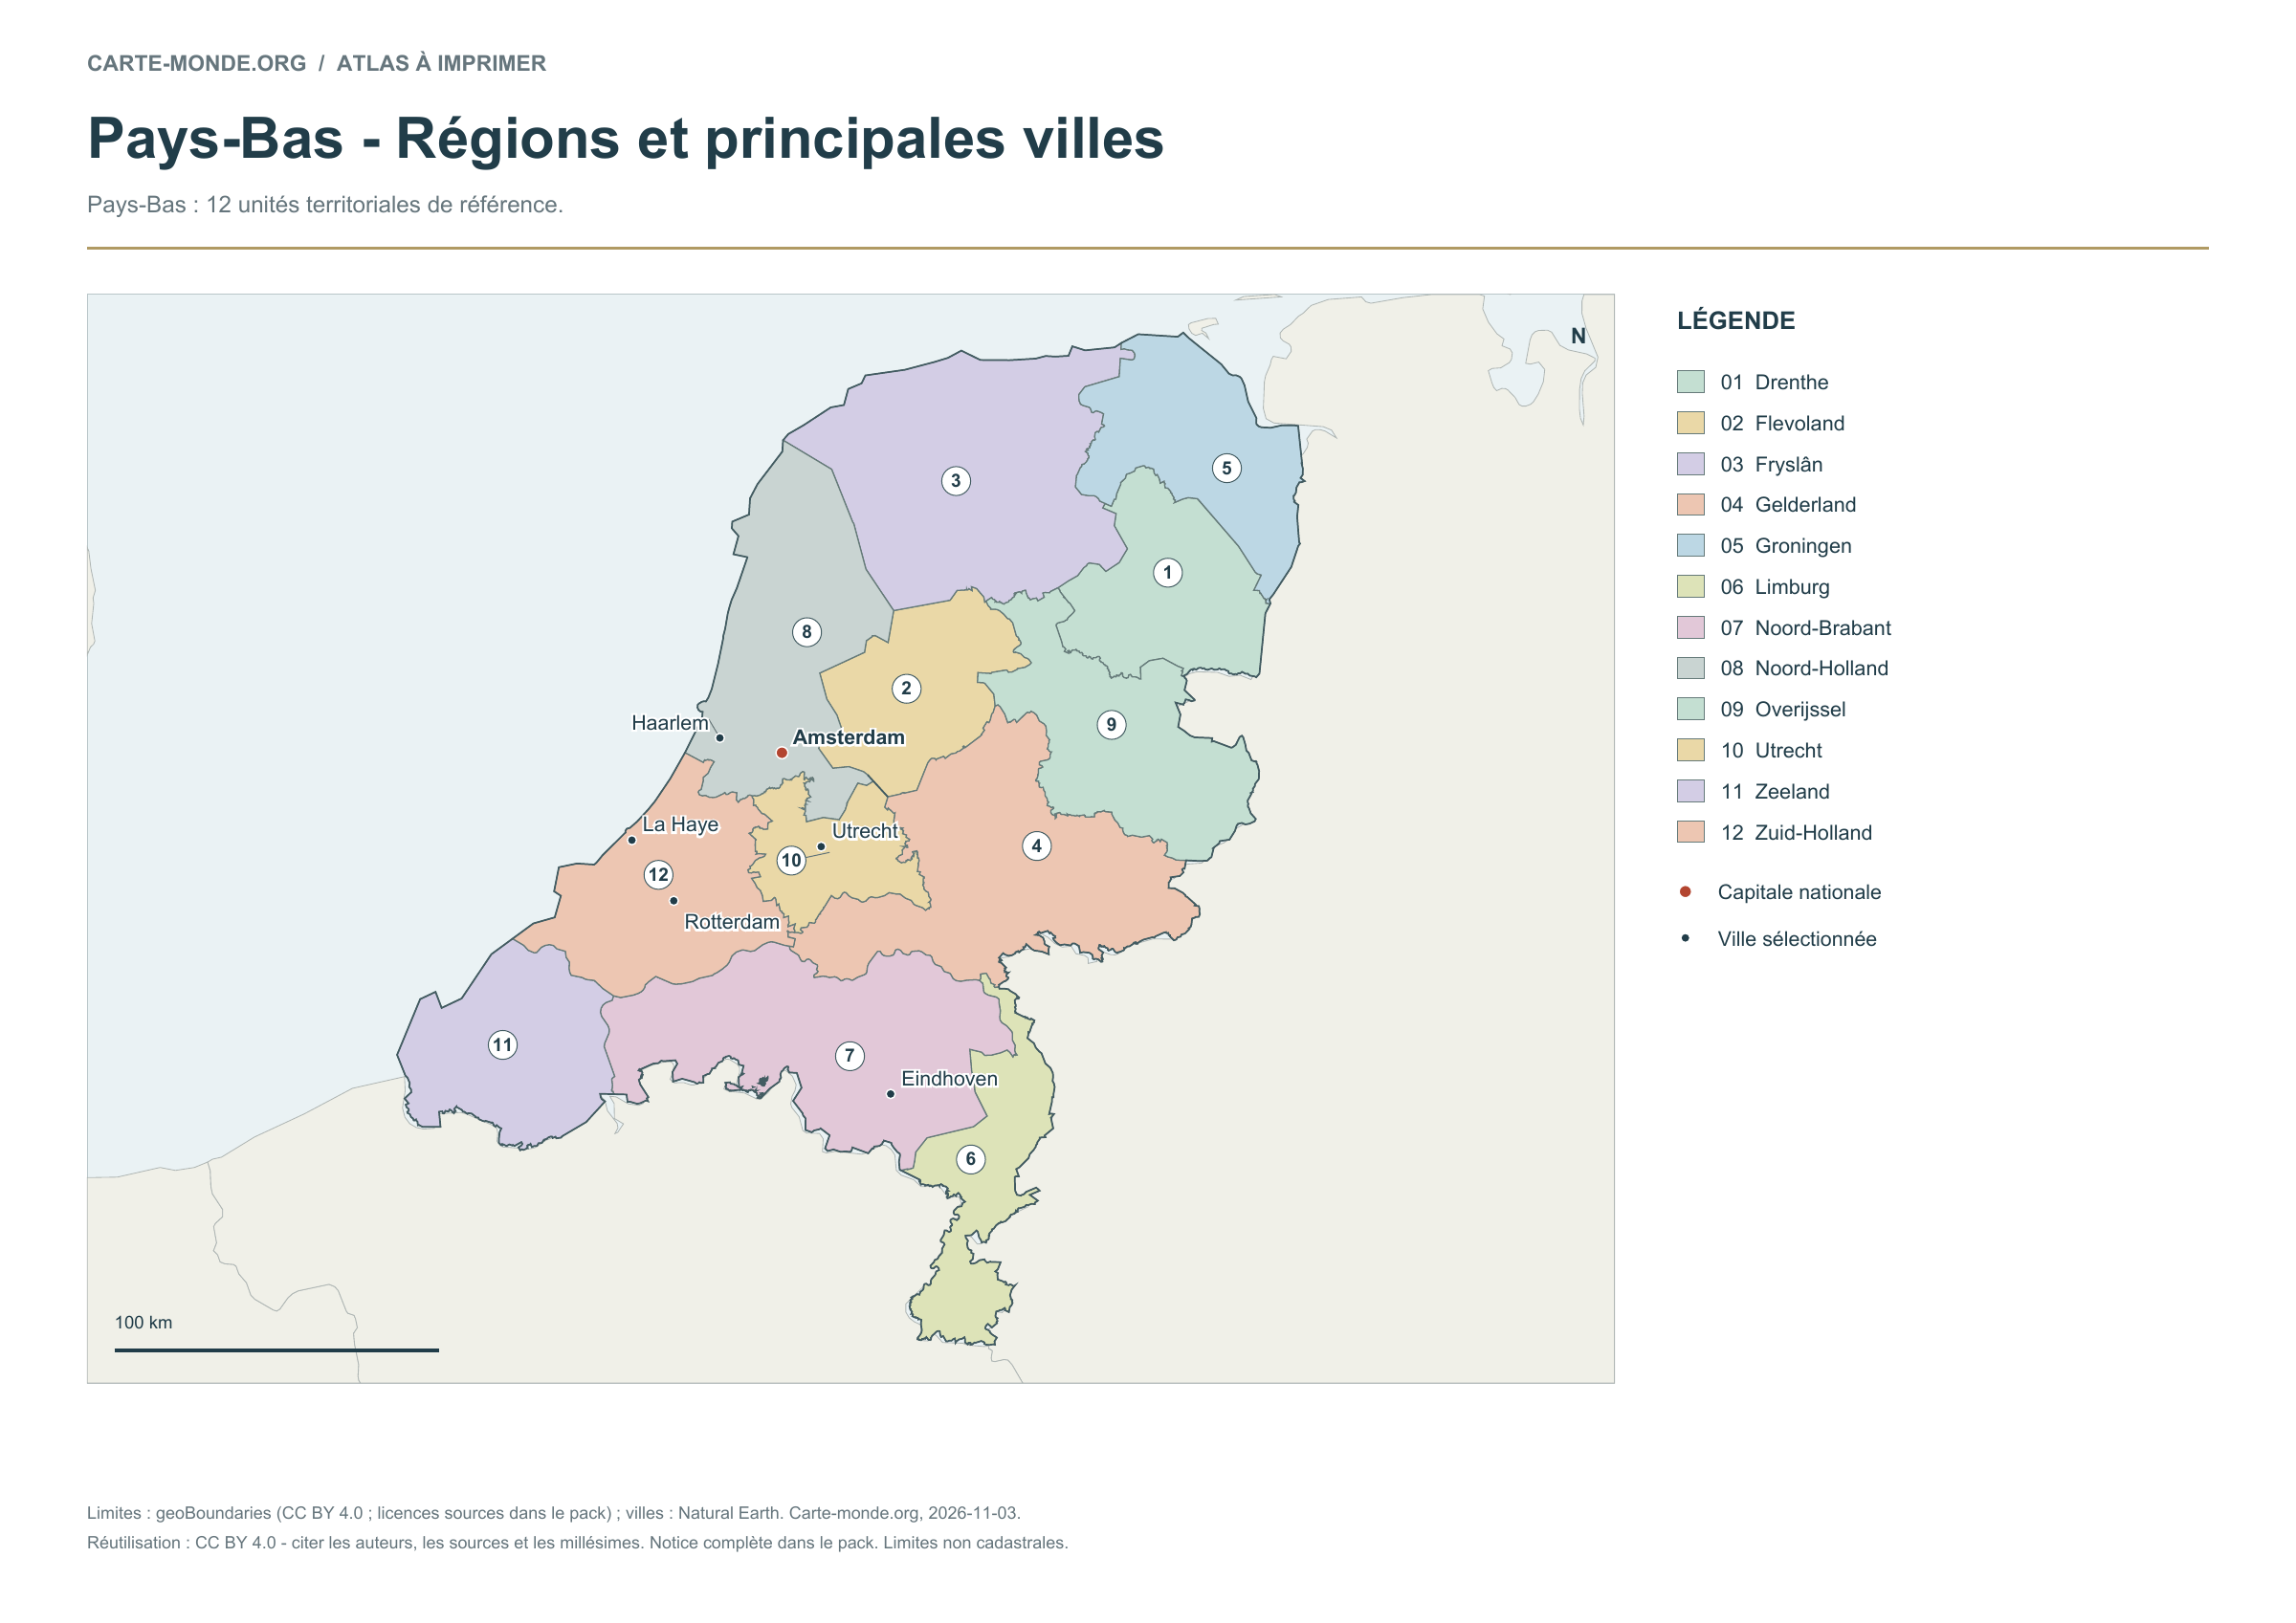
Regions and main cities — Netherlands

Carte-monde.org · November 2026

Regions and main cities

The 12 reference territorial units are numbered and named in the key, with selected cities and the capital.

A4 landscape PDF · PNG 2 400 px · CC BY 4.0

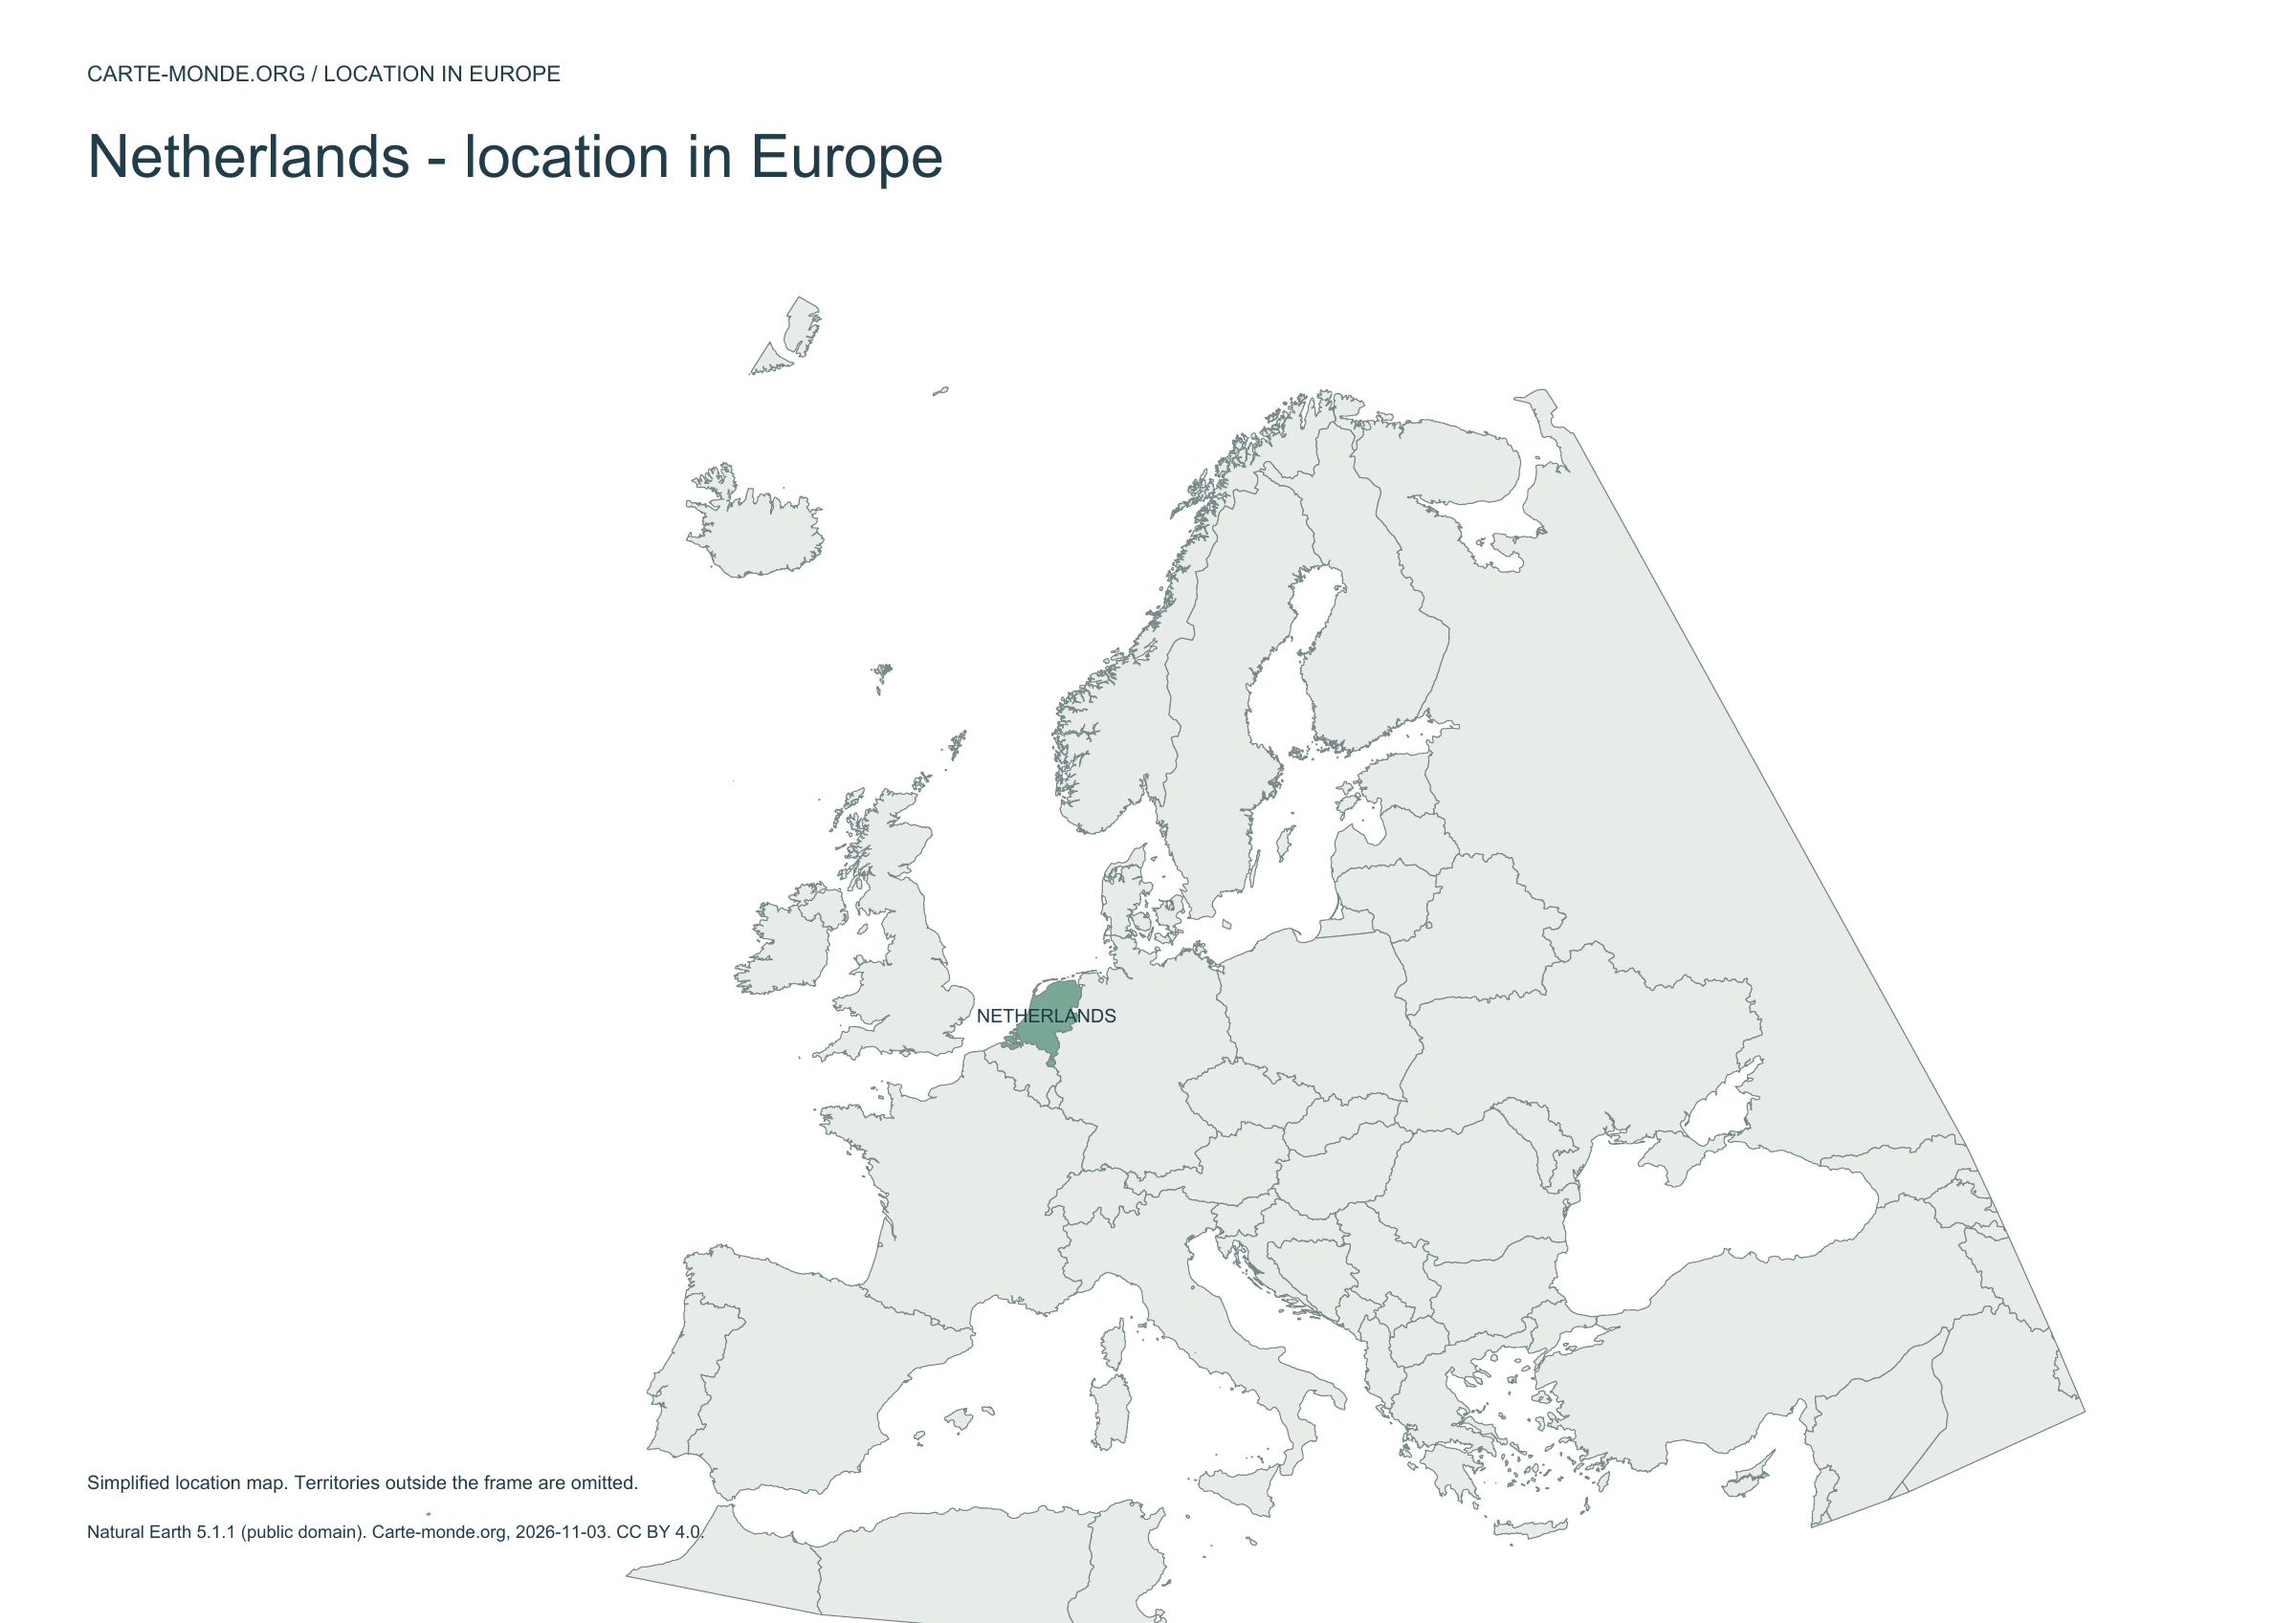
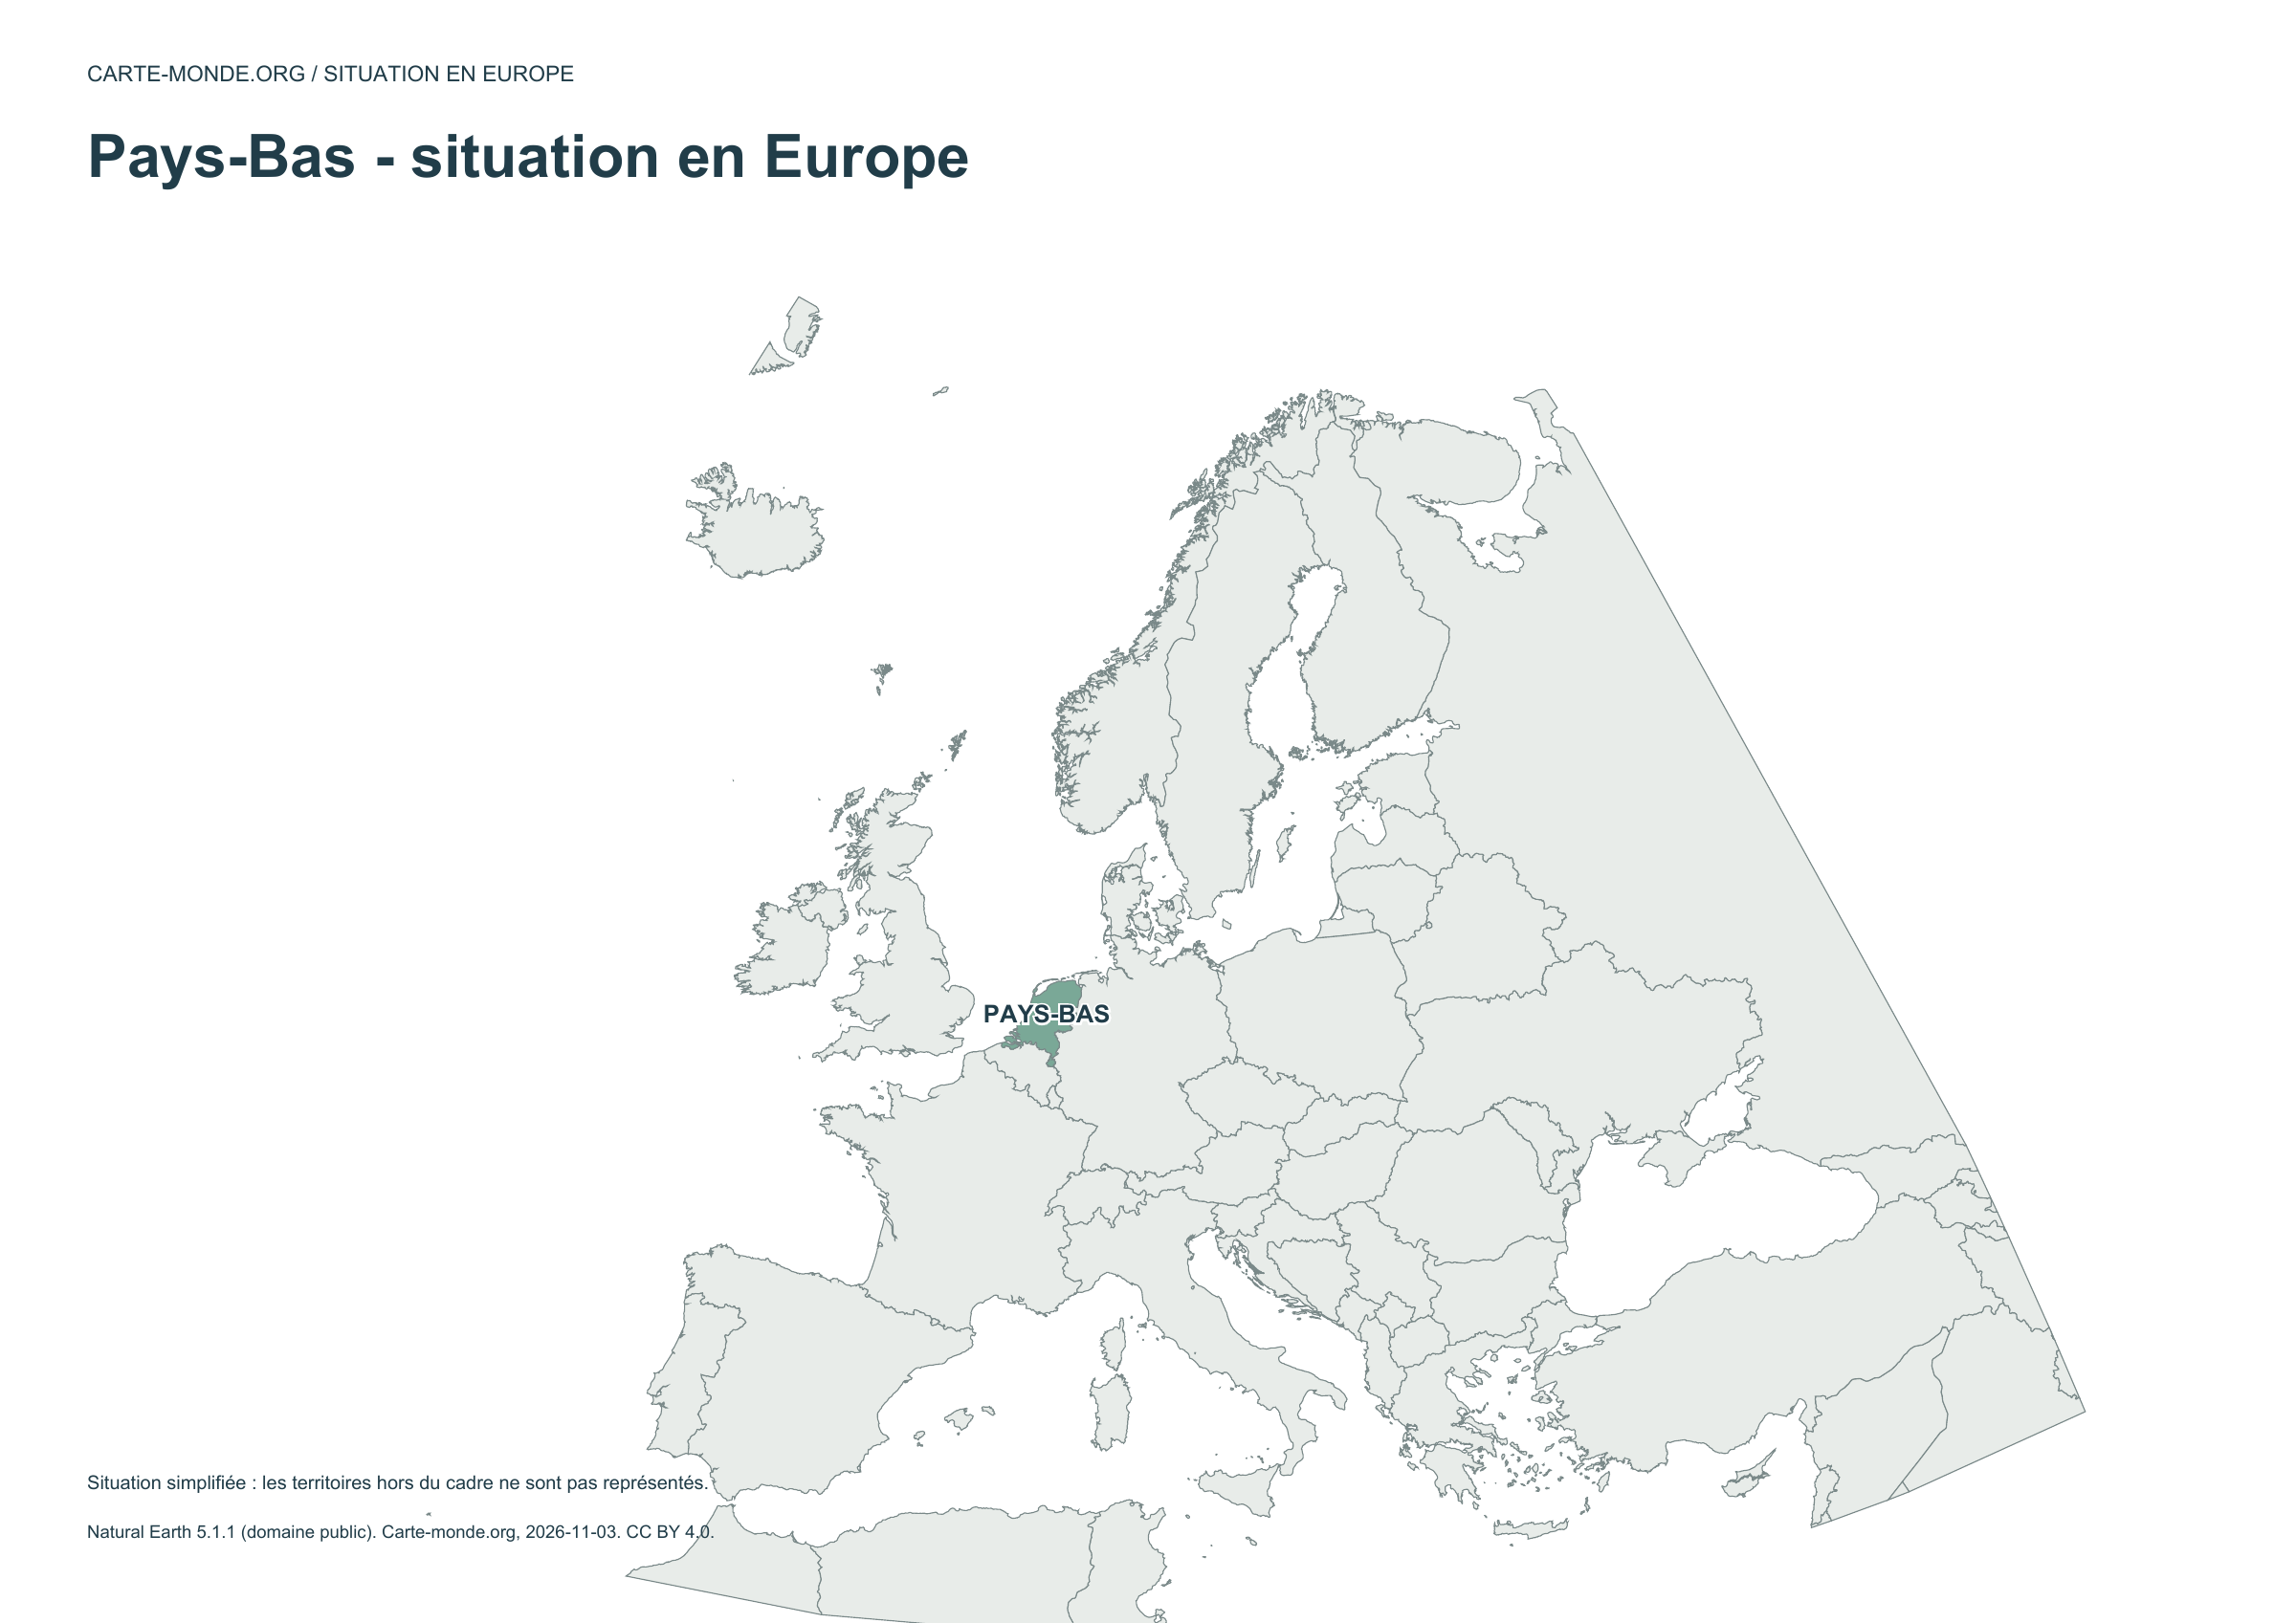
Location in Europe — Netherlands

Carte-monde.org · November 2026

Location in Europe

The country is highlighted within a simplified European frame; territories outside this frame are not shown.

A4 landscape PDF · PNG 2 400 px · CC BY 4.0

Two maps to understand the relief

Choose shaded relief for an overview, or elevation classes for school use.

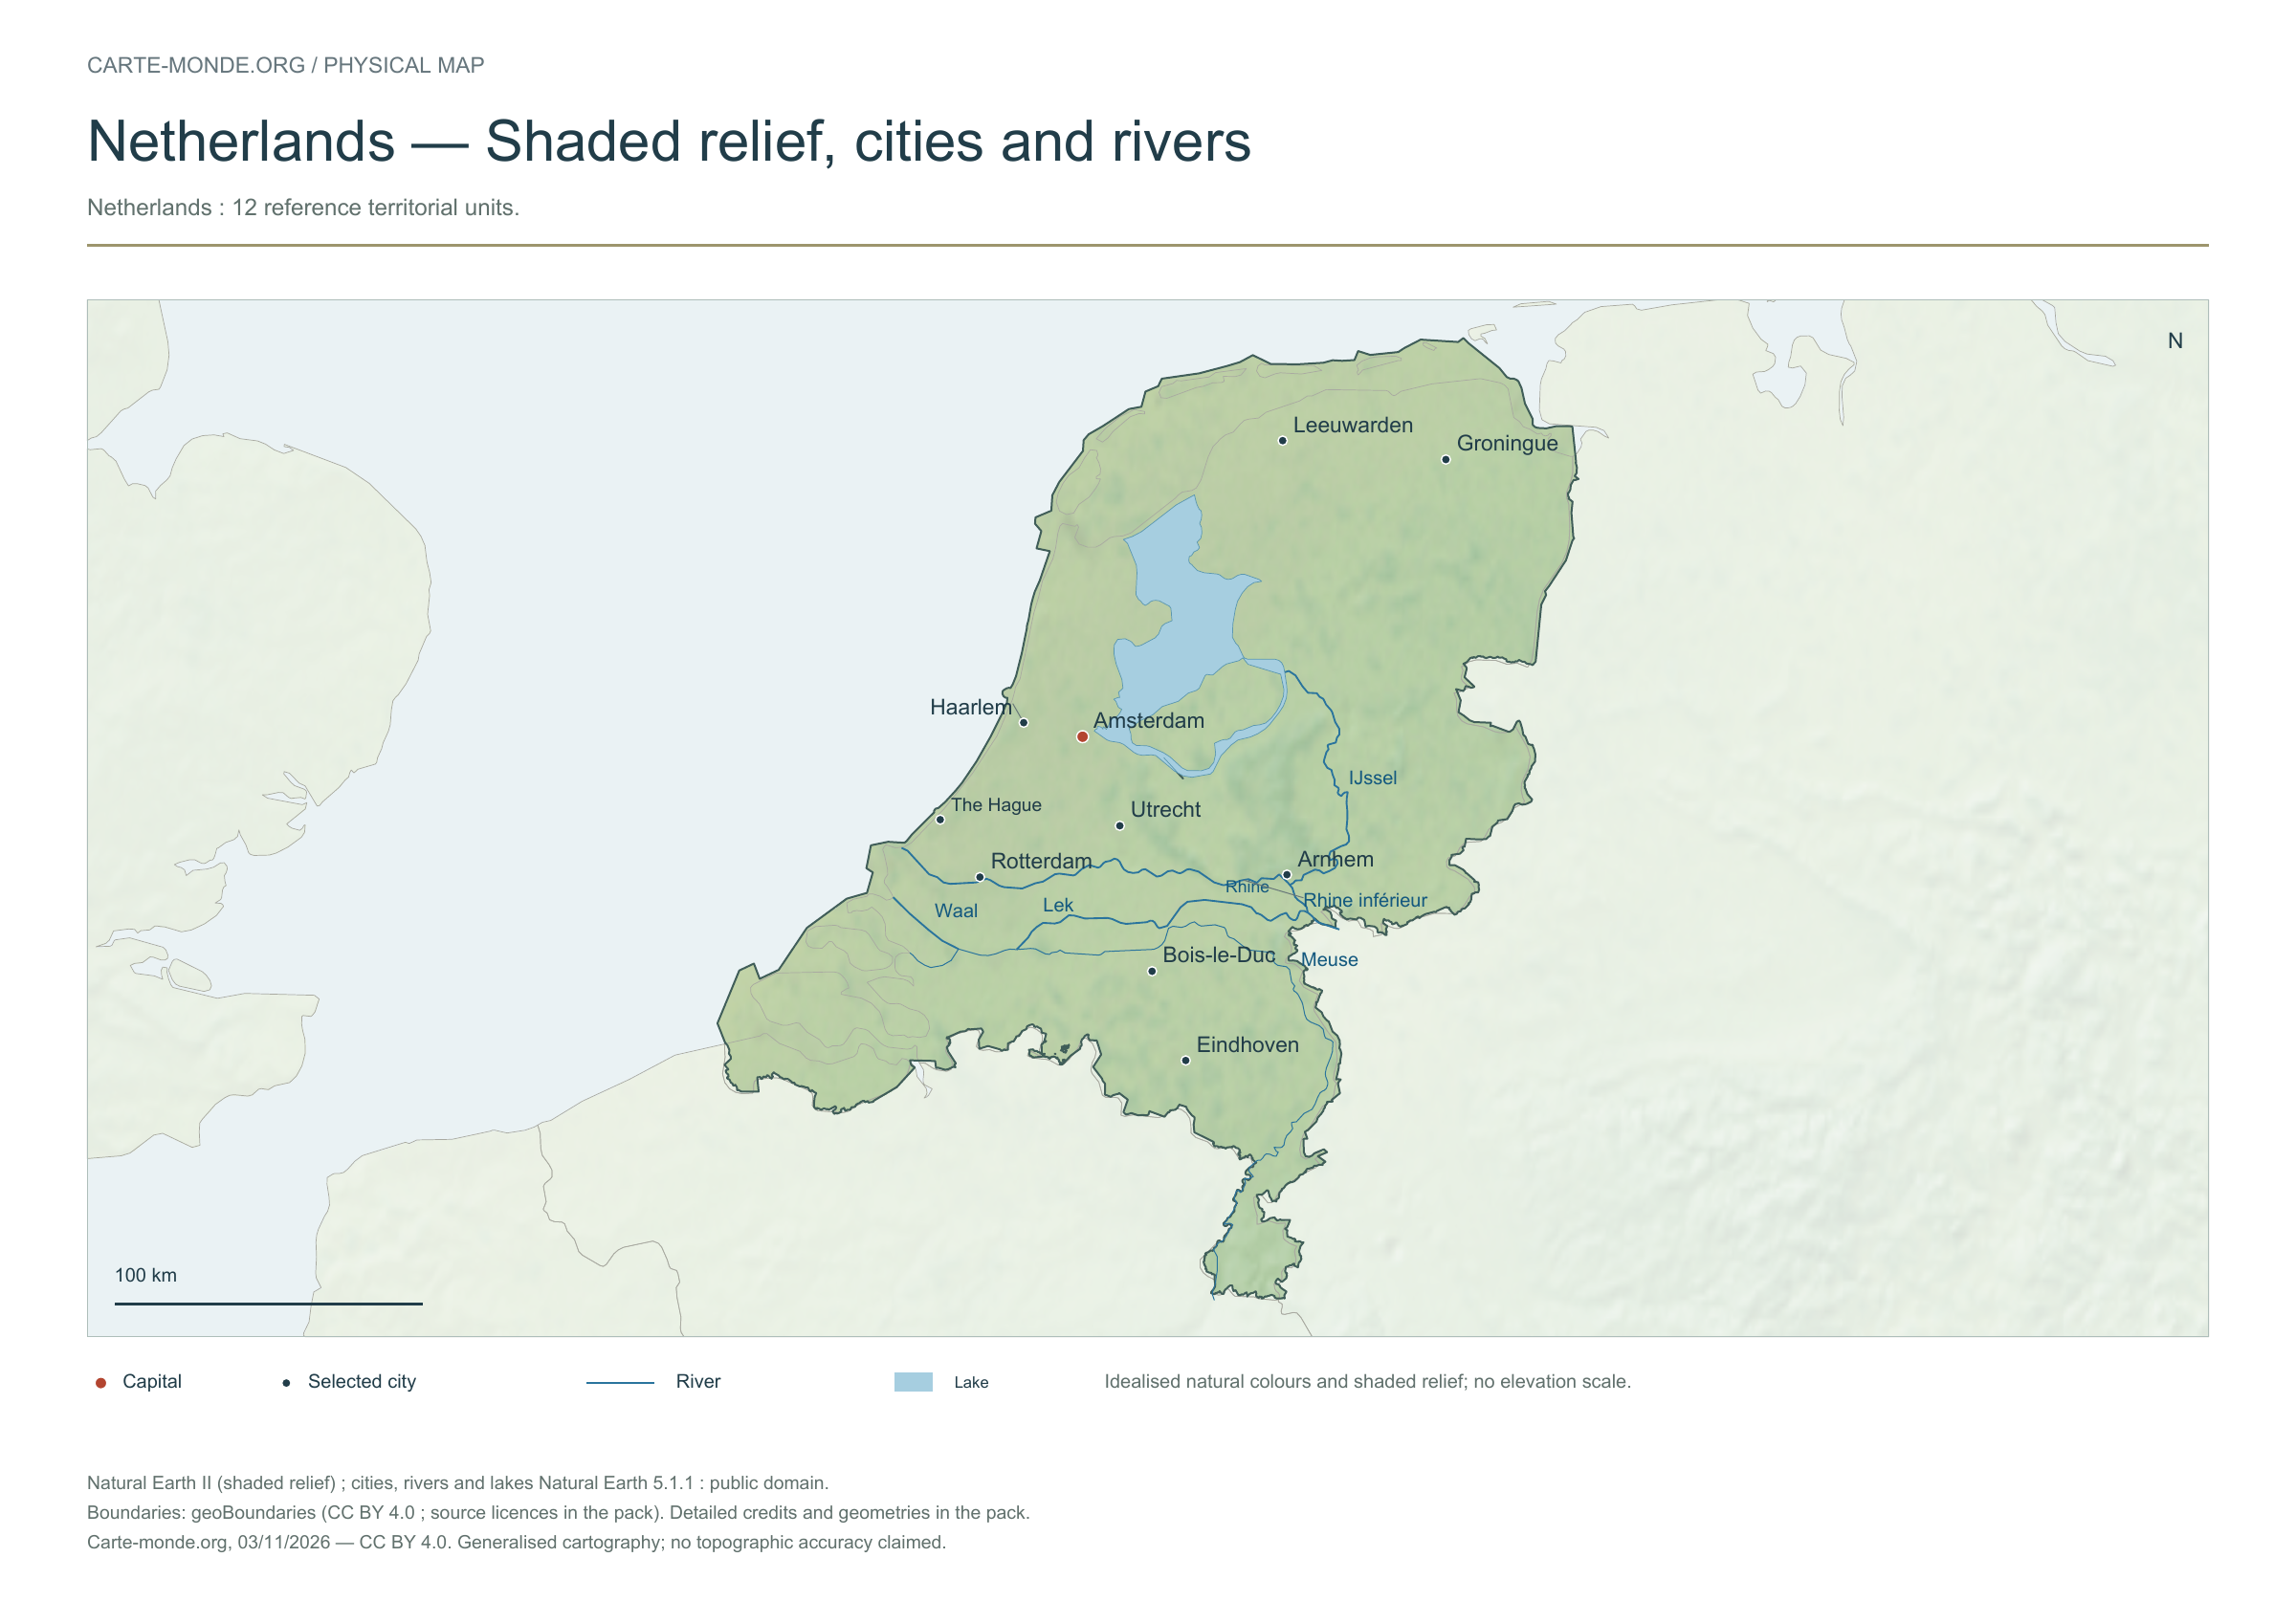
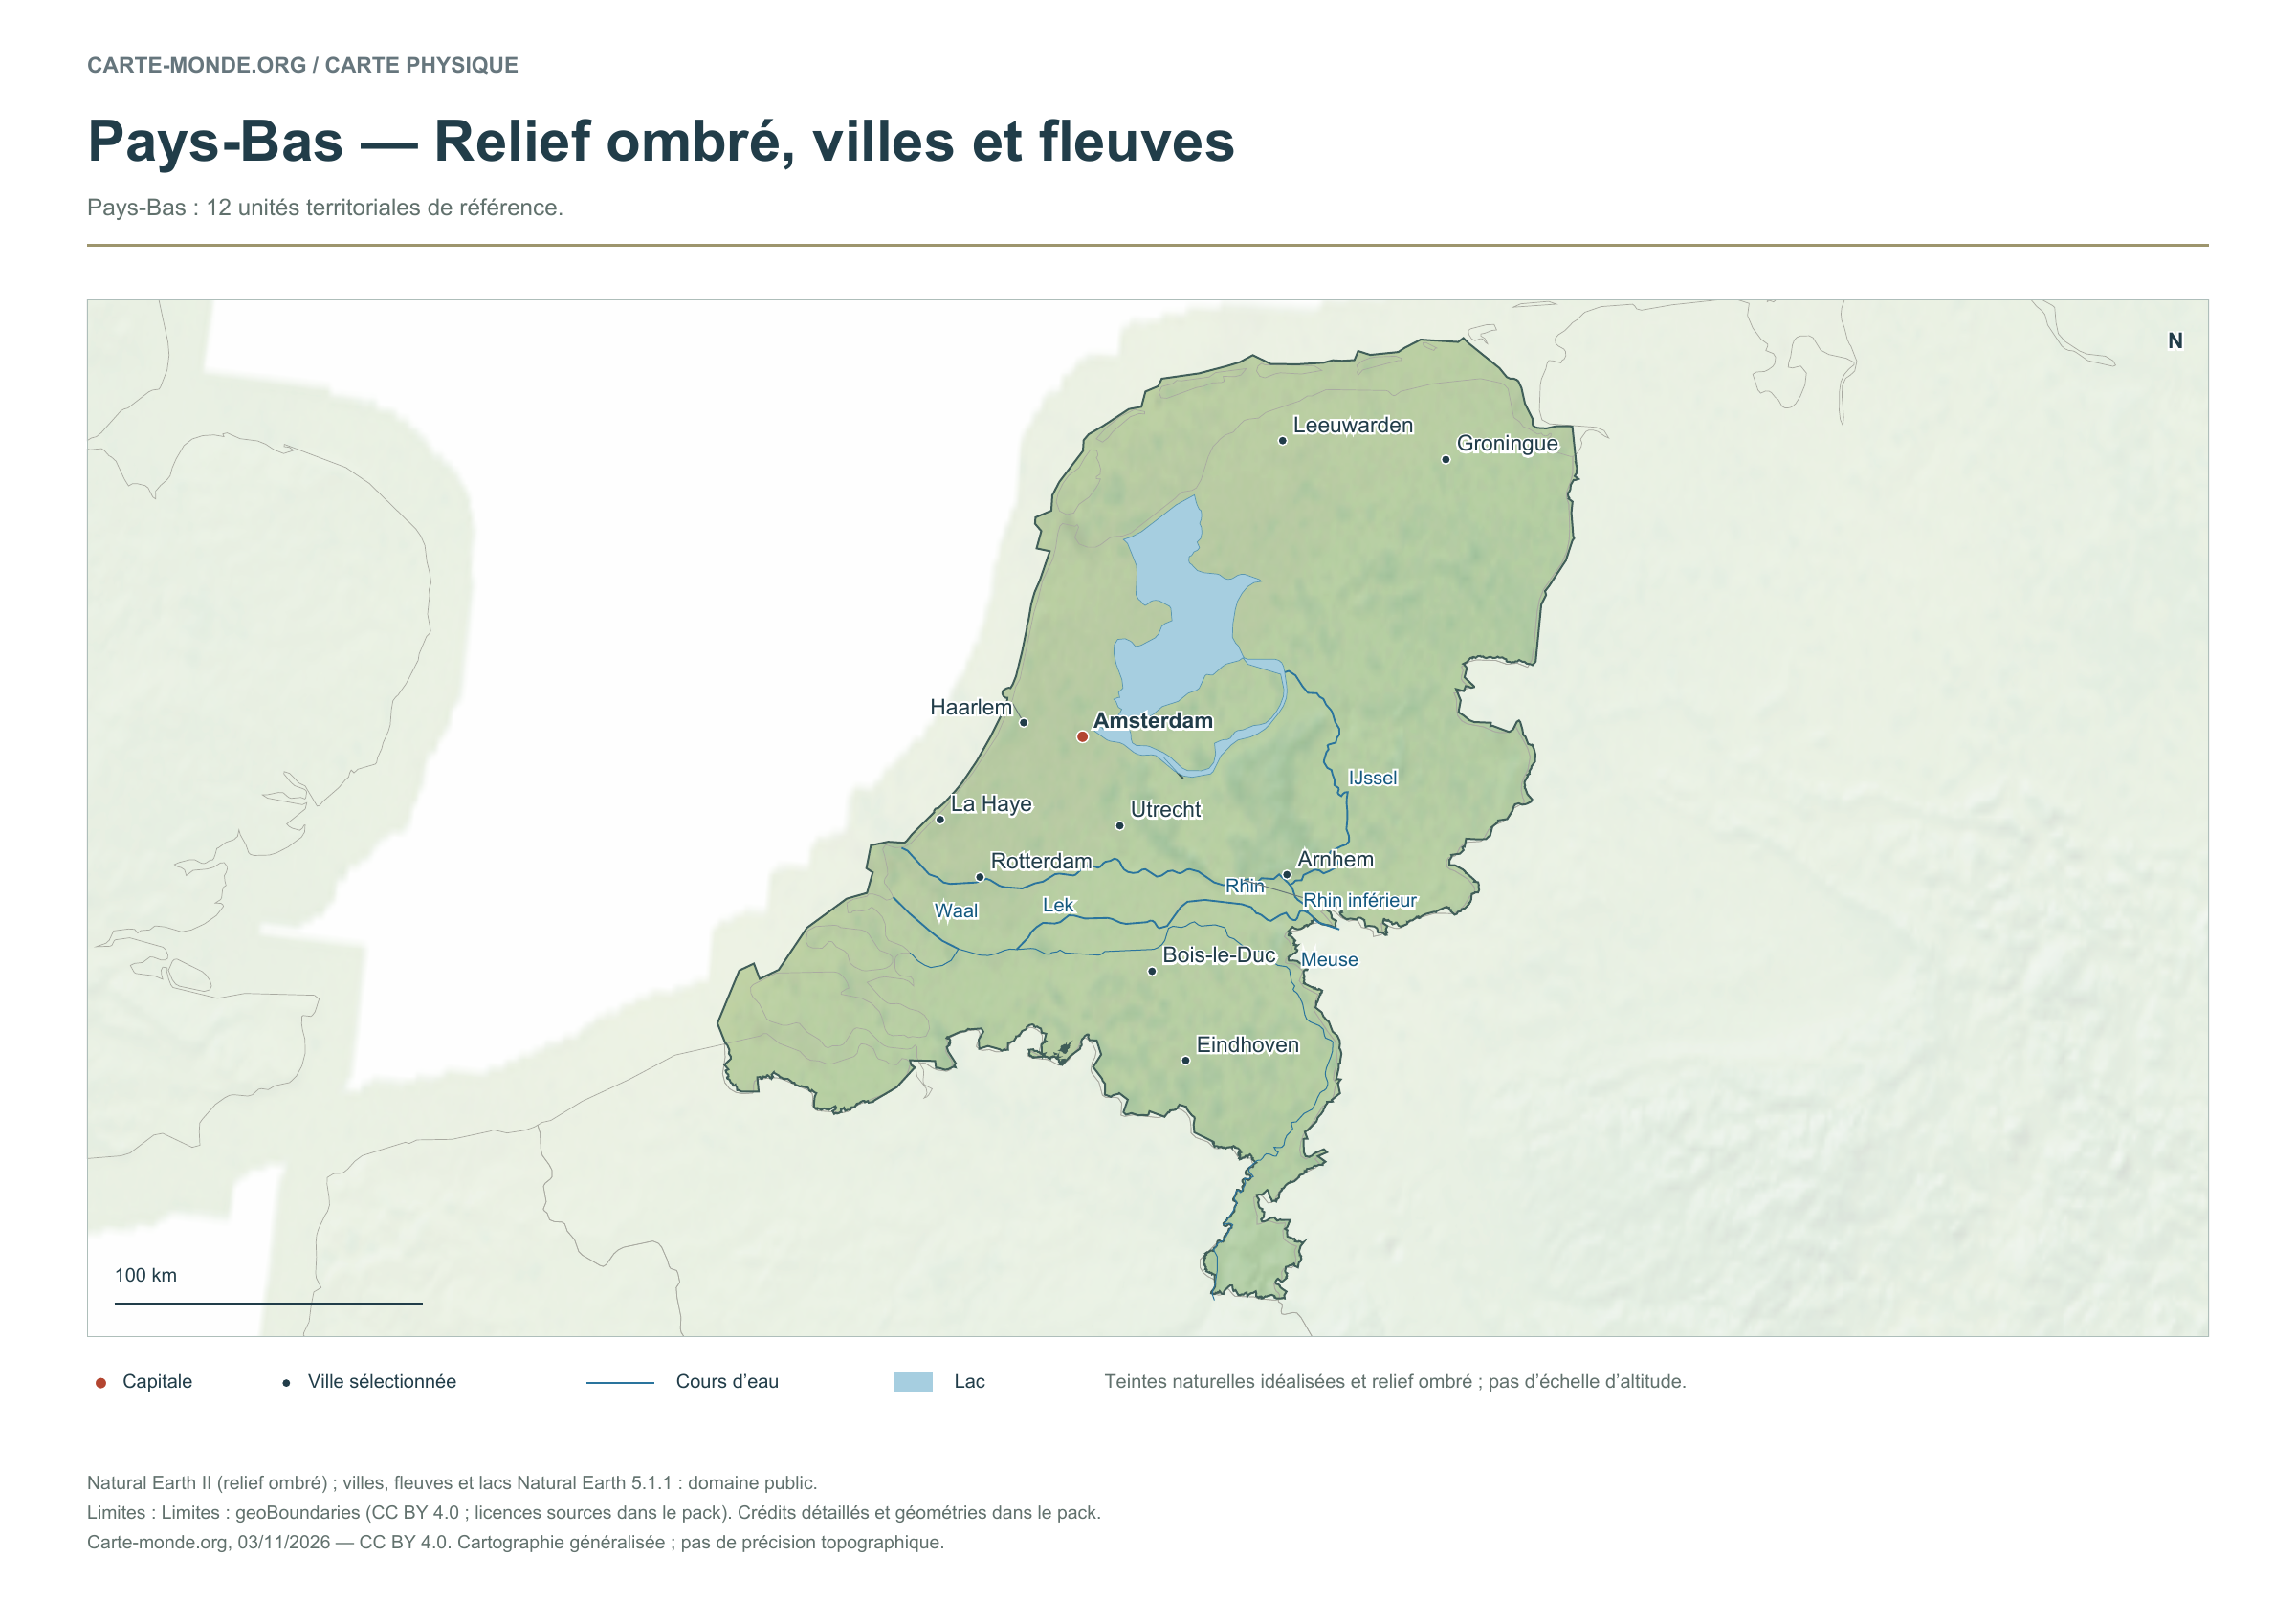
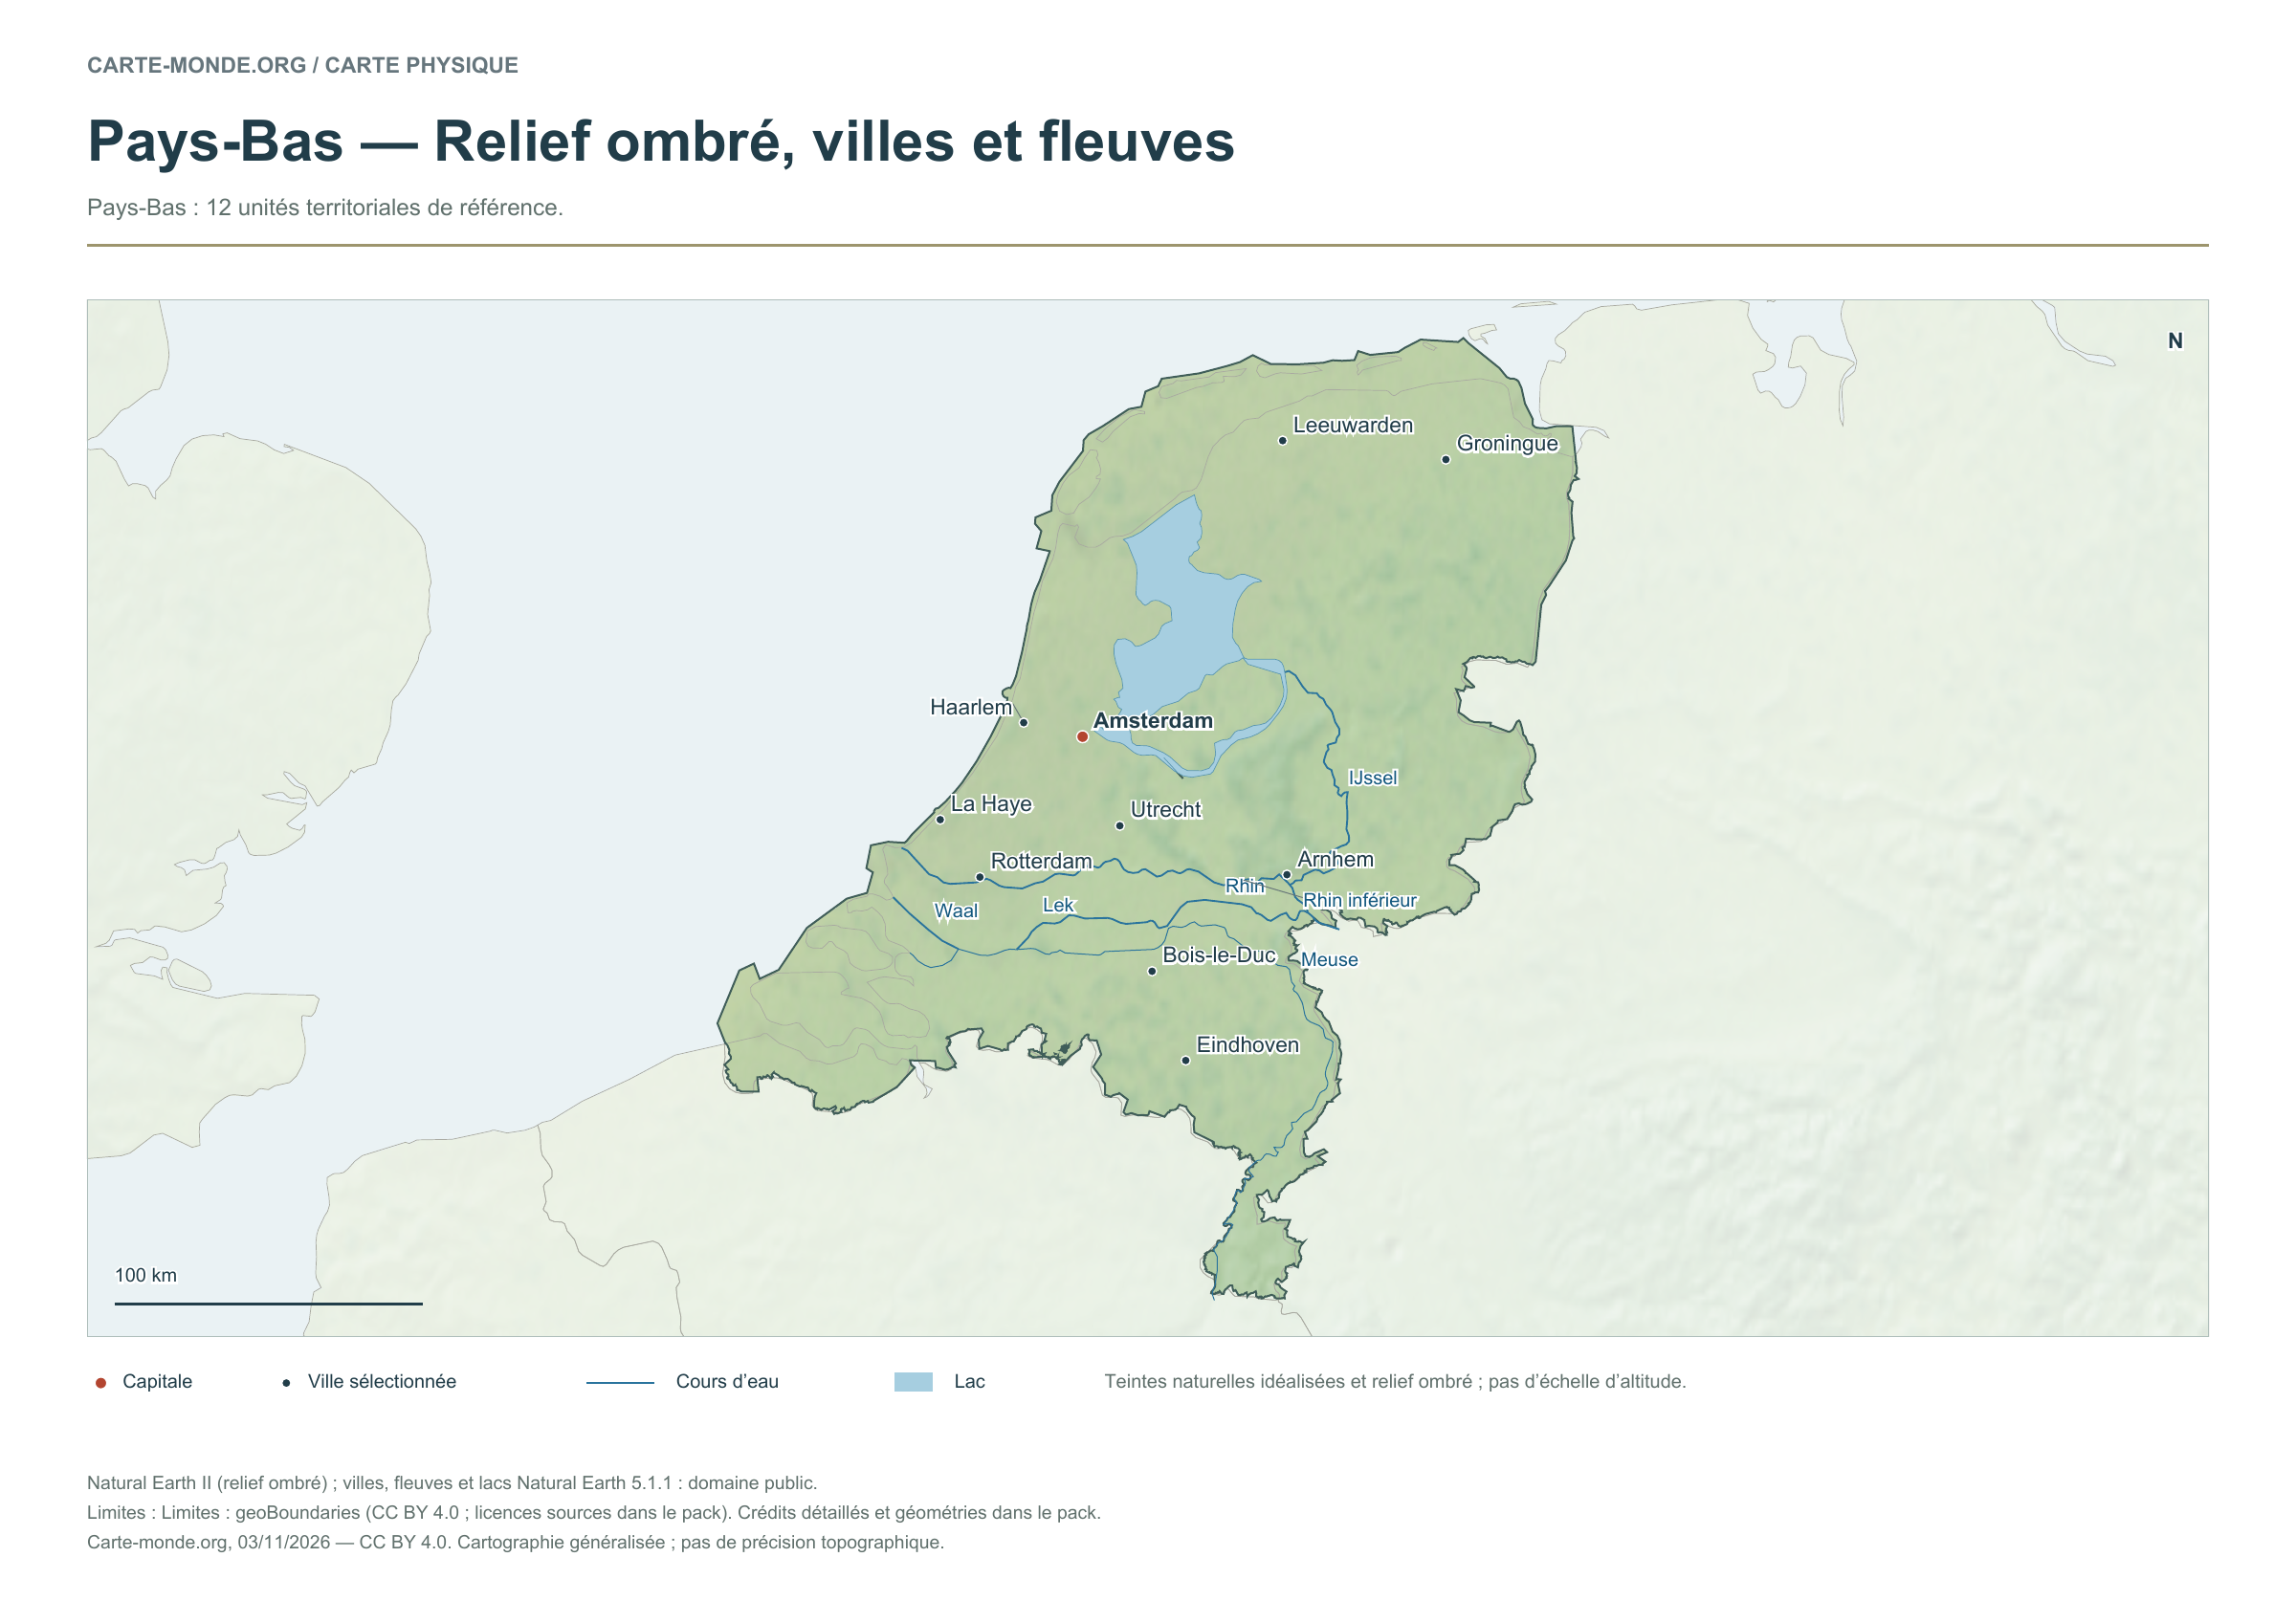
Netherlands — Shaded relief, cities and rivers

Carte-monde.org · November 2026

Shaded relief, cities and rivers

To identify major landforms, cities and the river network. The natural colours are not an elevation scale.

Raster base map, cities, rivers and lakes: Natural Earth, public domain. Other boundary credits and licences are retained in the pack. Cartographic work CC BY 4.0; ODbL-derived data retains its licence. No topographic accuracy is claimed.

Territory, data and selection of names

Netherlands: 12 reference territorial units.

Natural Earth II shaded relief base map, 10 selected cities. Named rivers: IJssel, Lek, Meuse, Rhin, Rhin inférieur, Waal.

The colours represent idealised natural cover; they do not correspond to elevation classes. This global background remains generalised, particularly for small states.

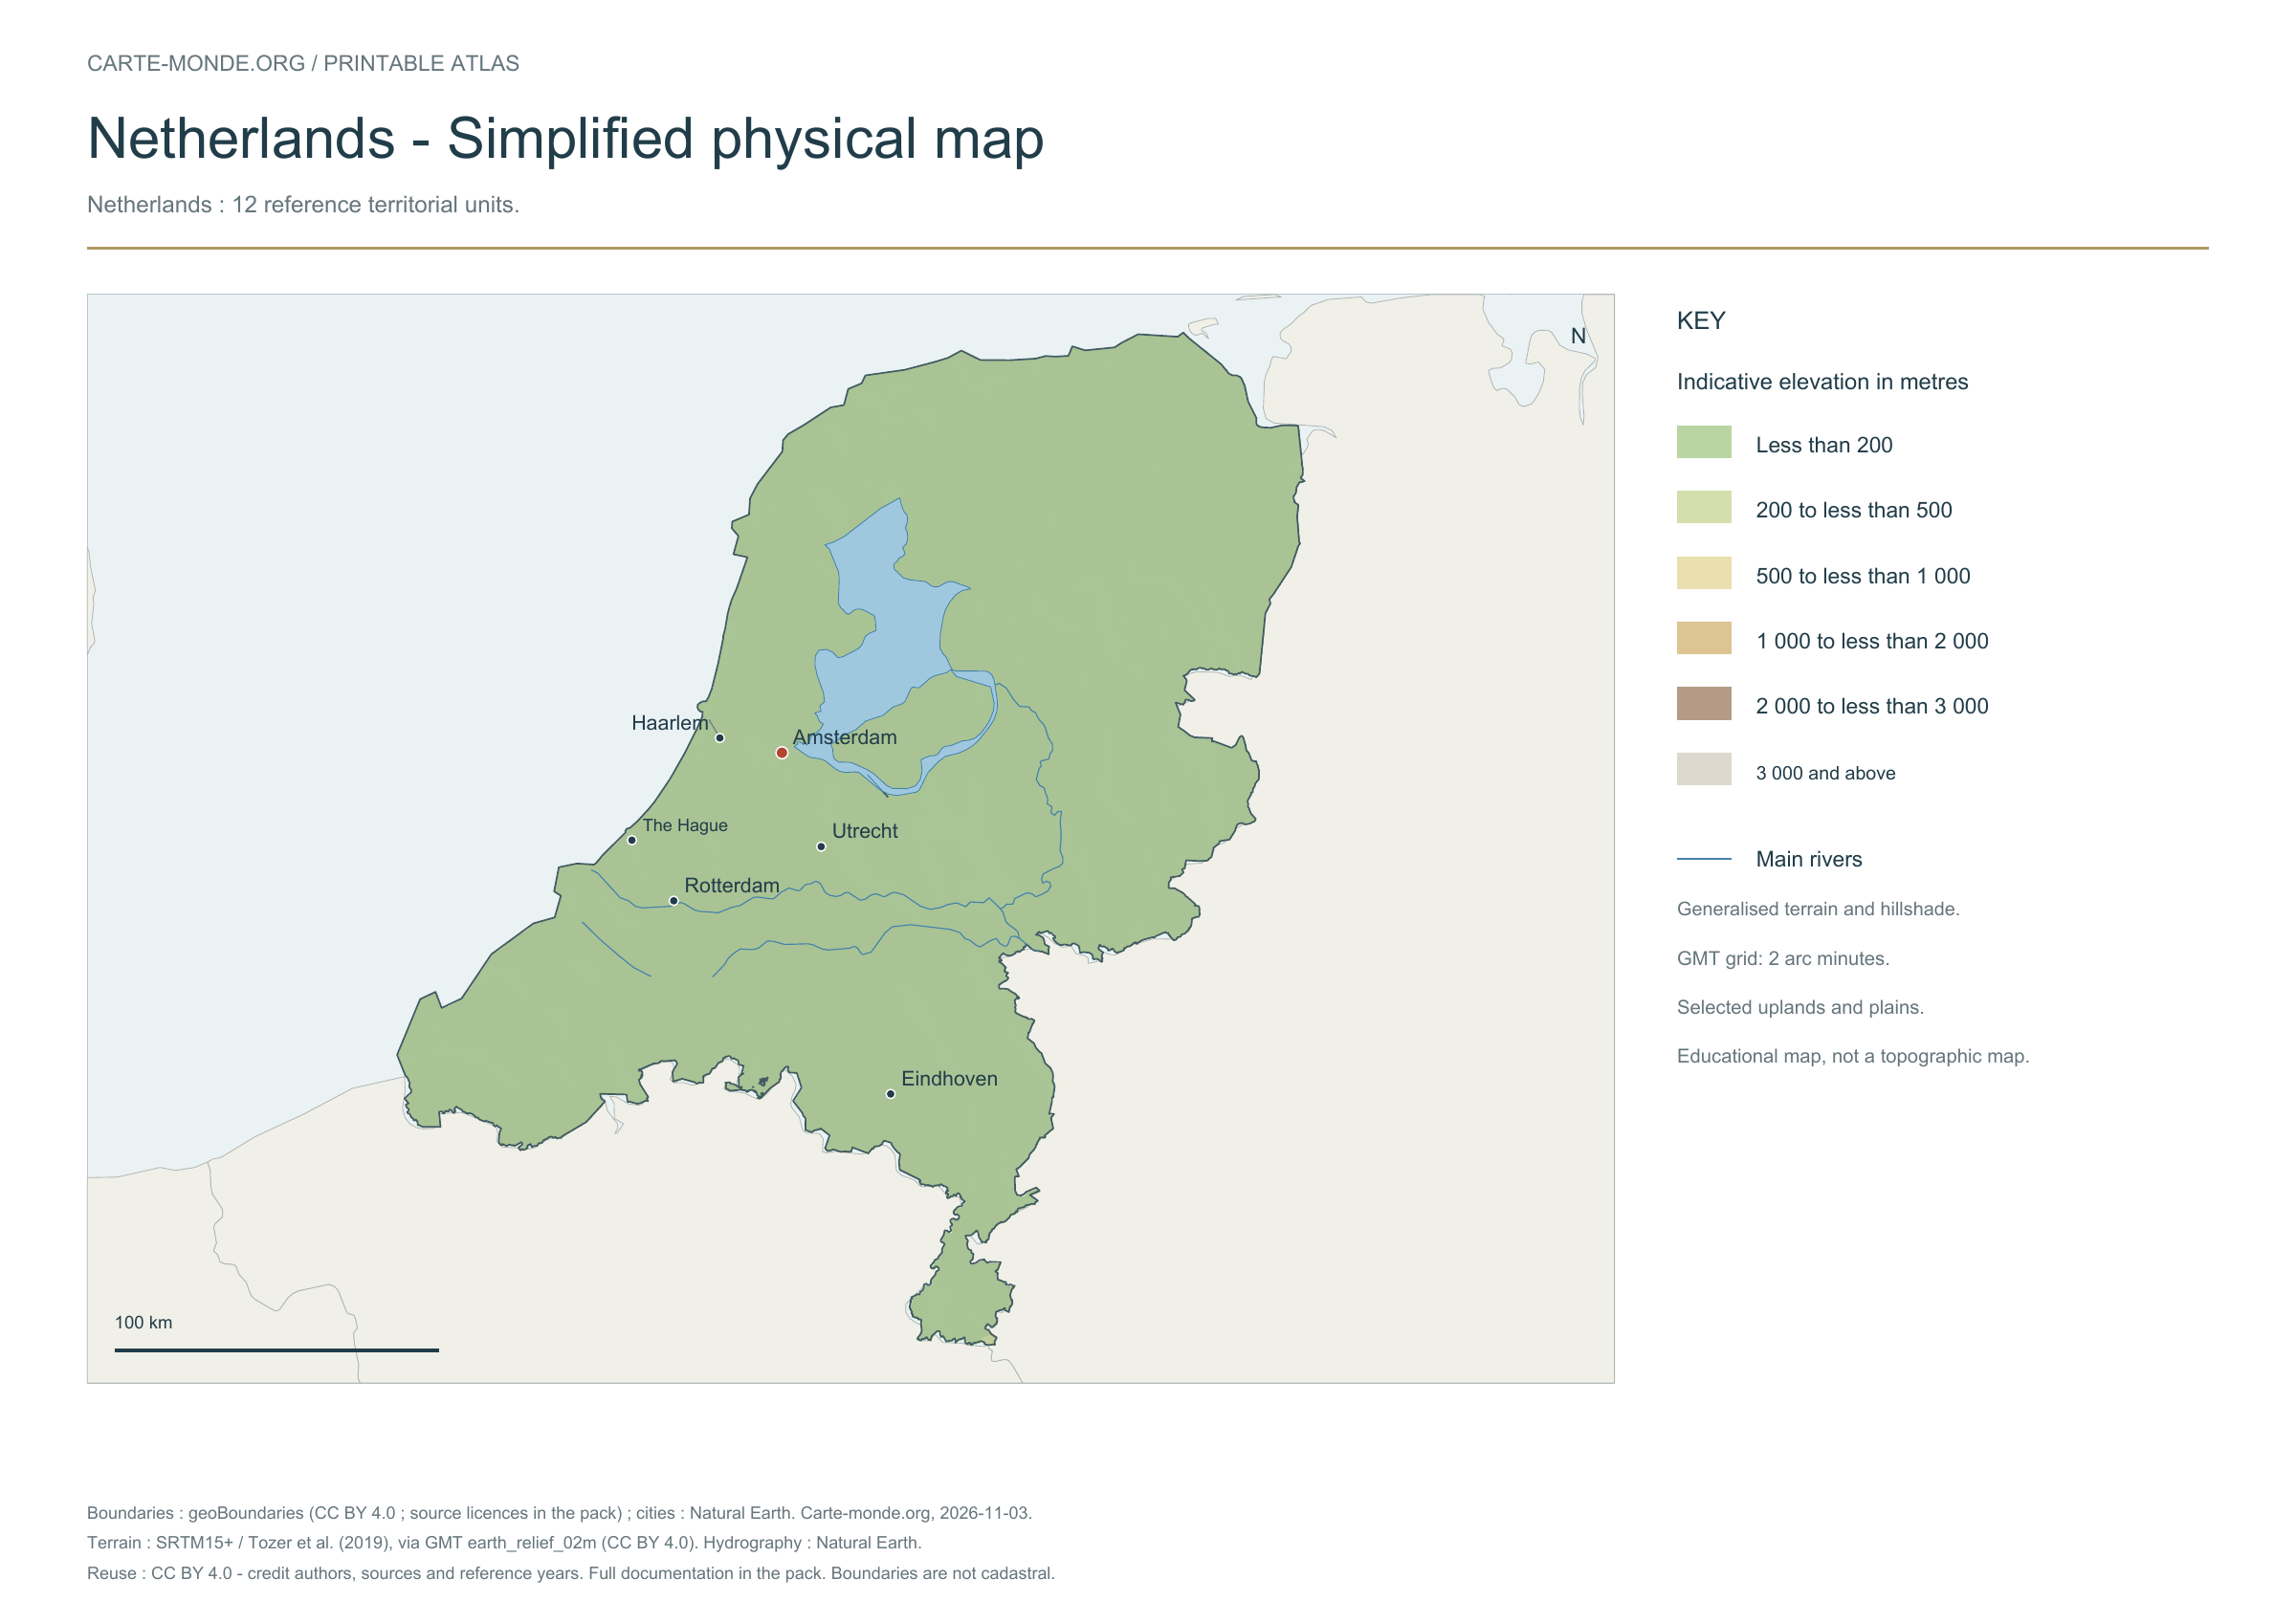
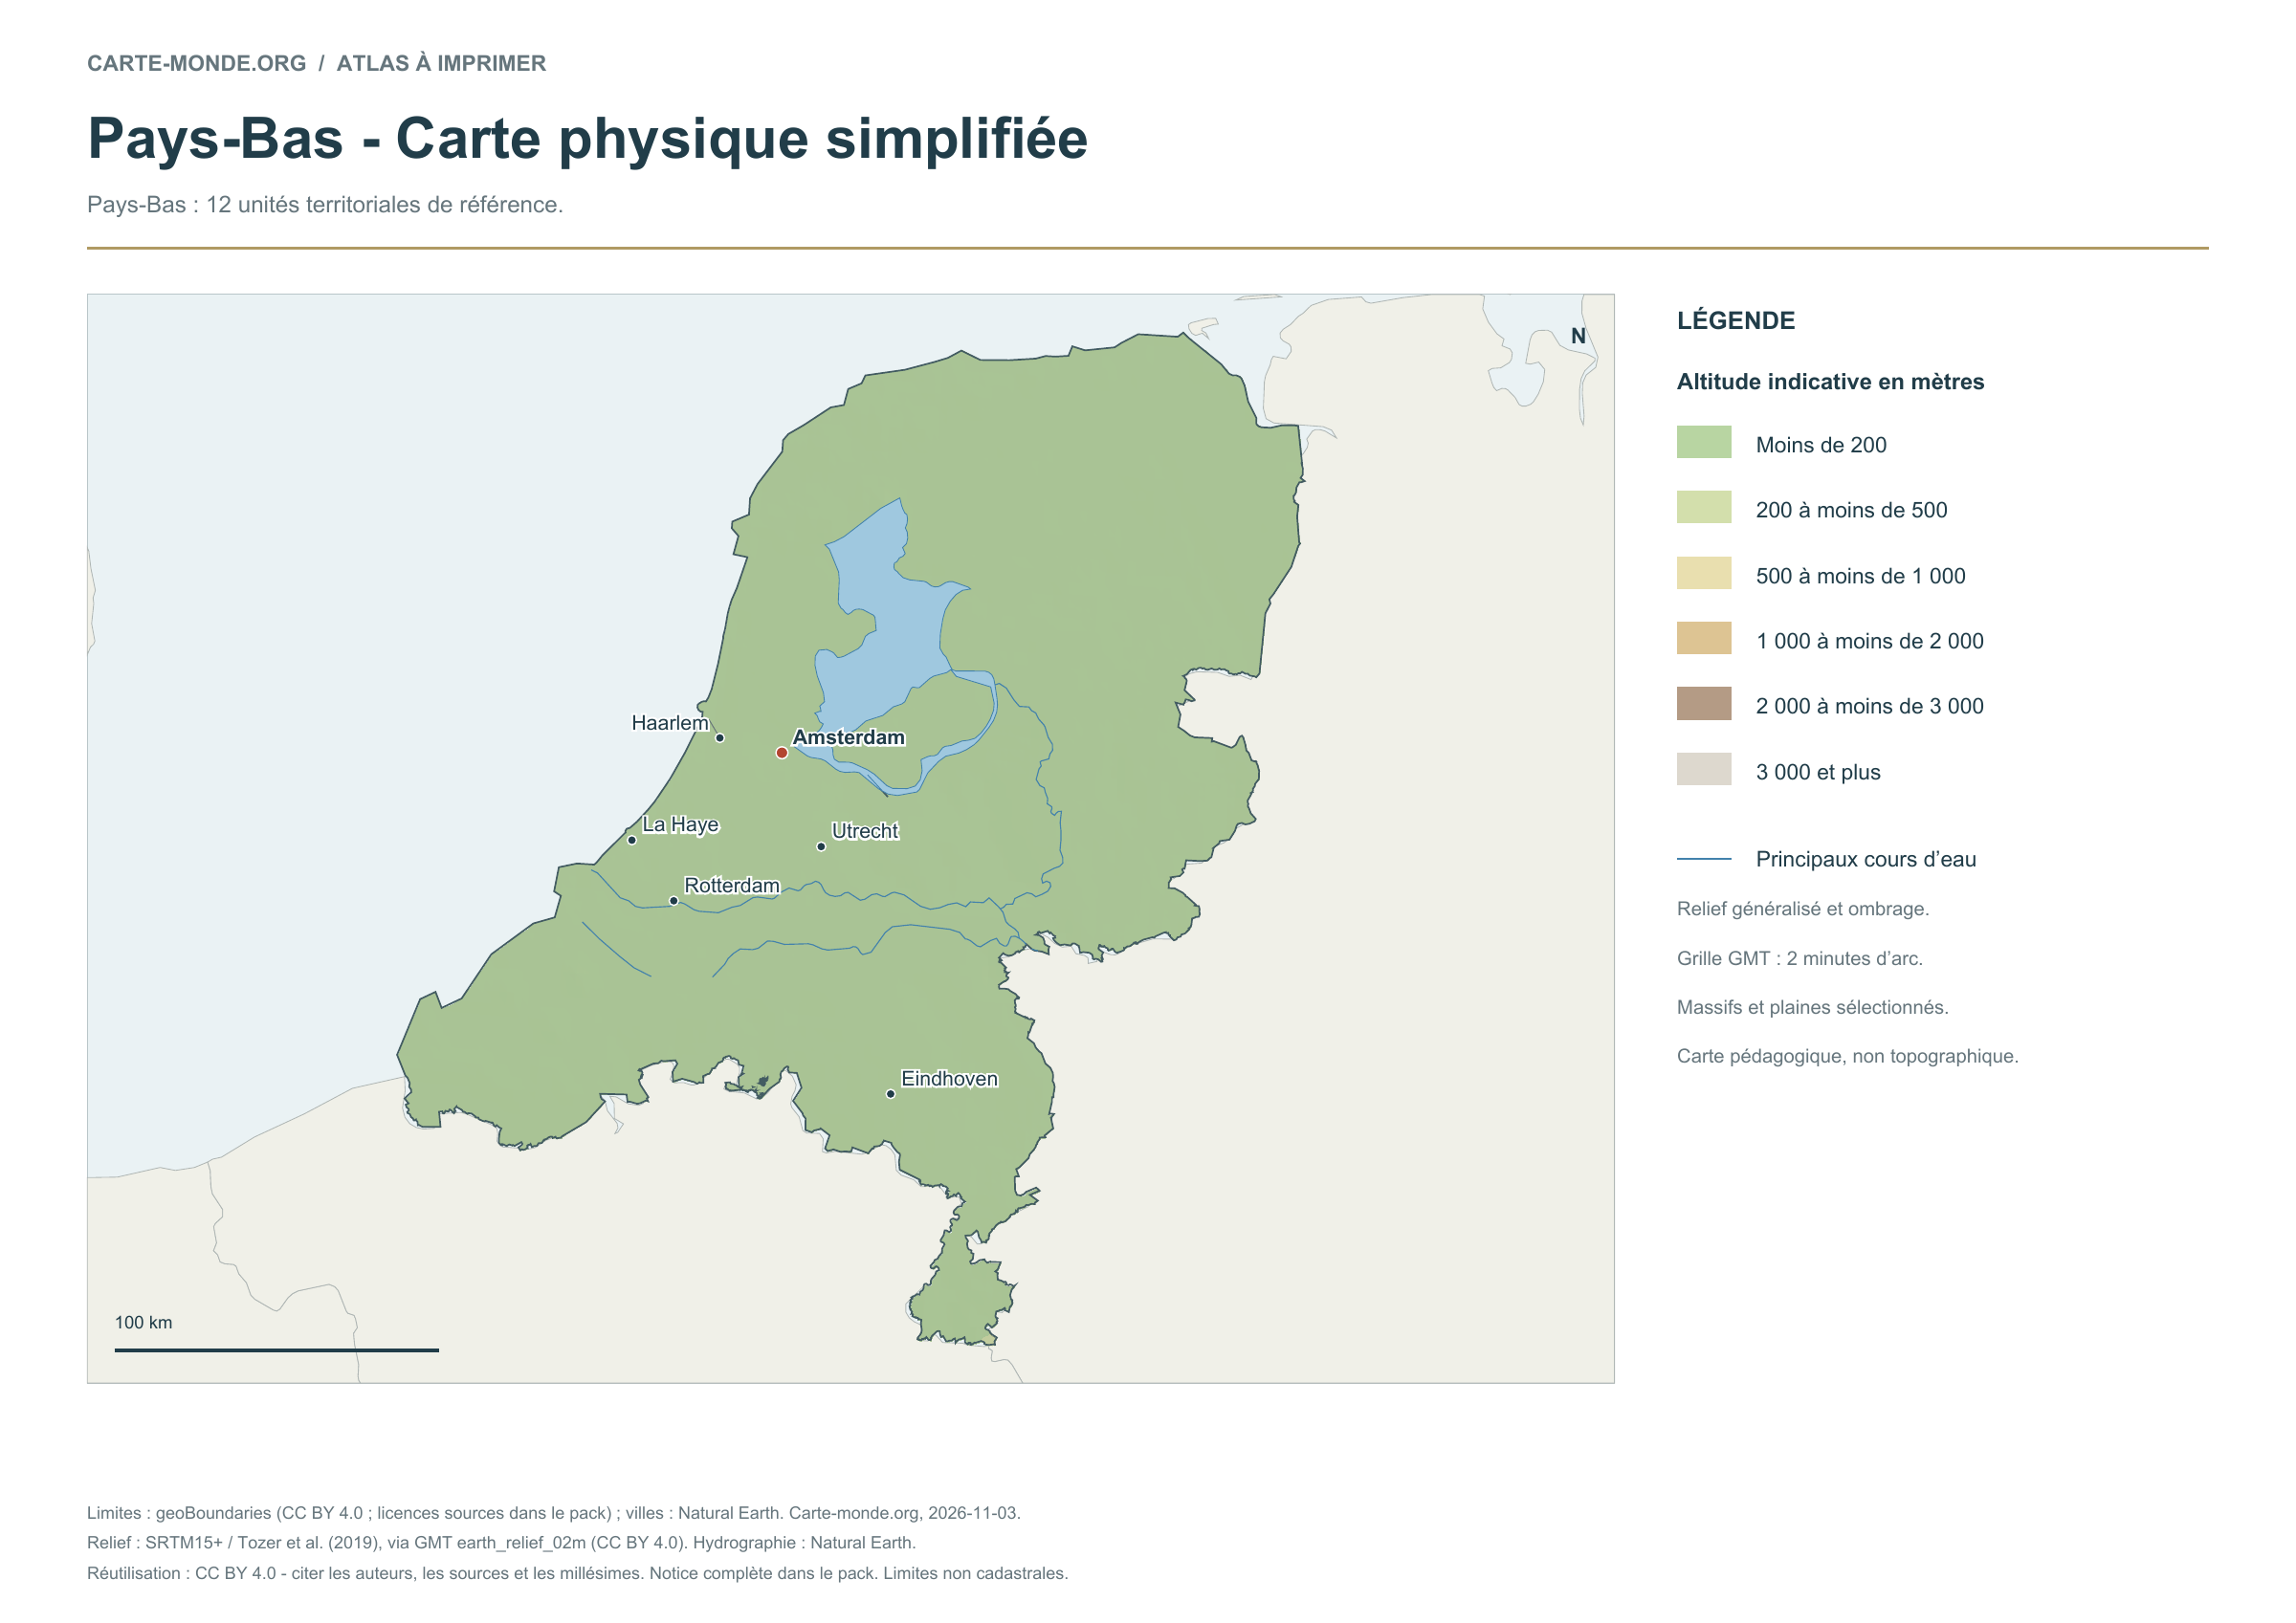
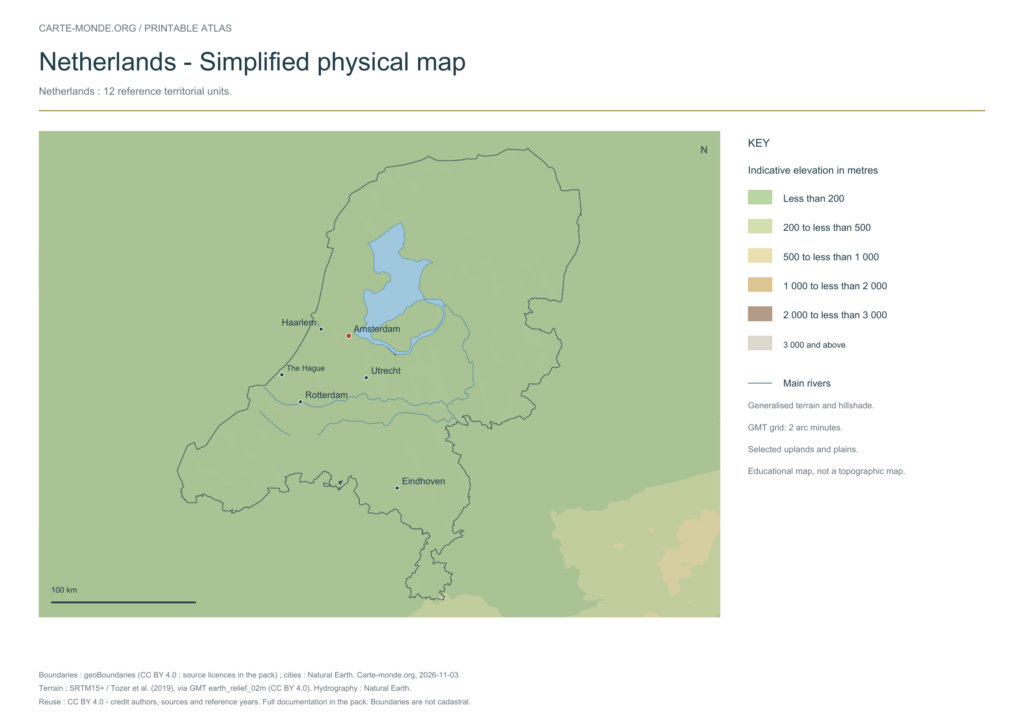
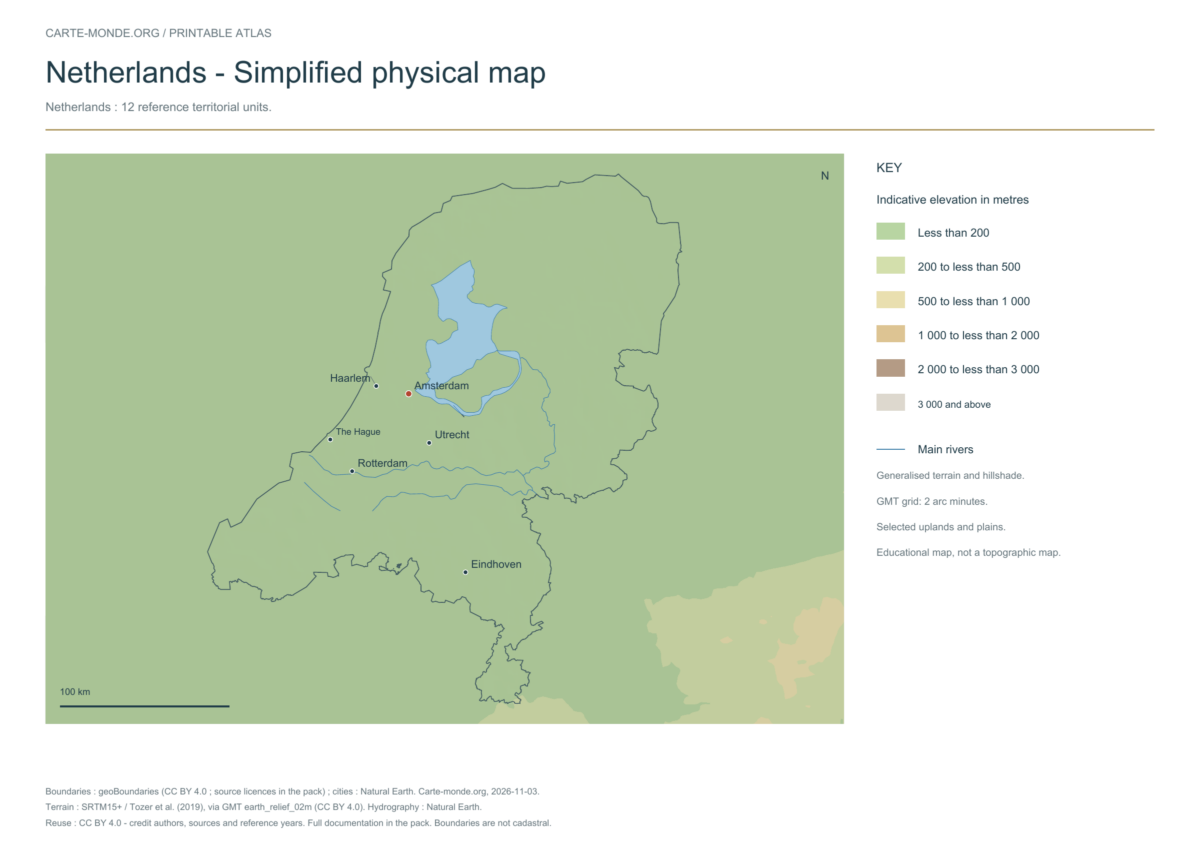
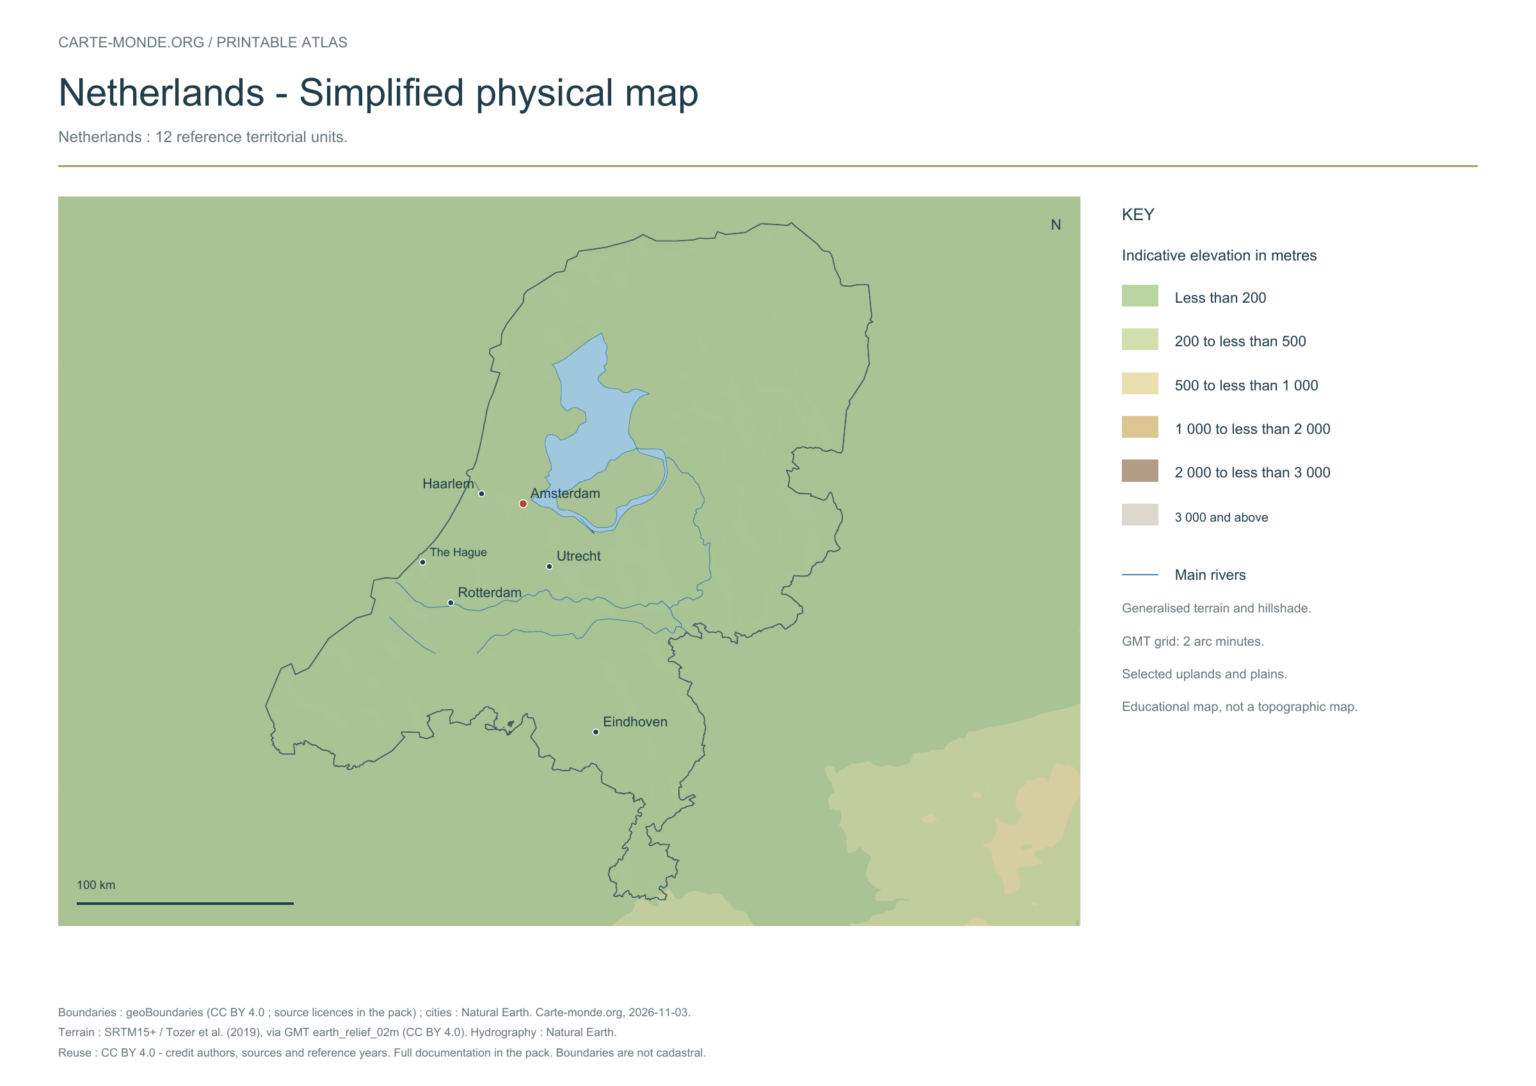
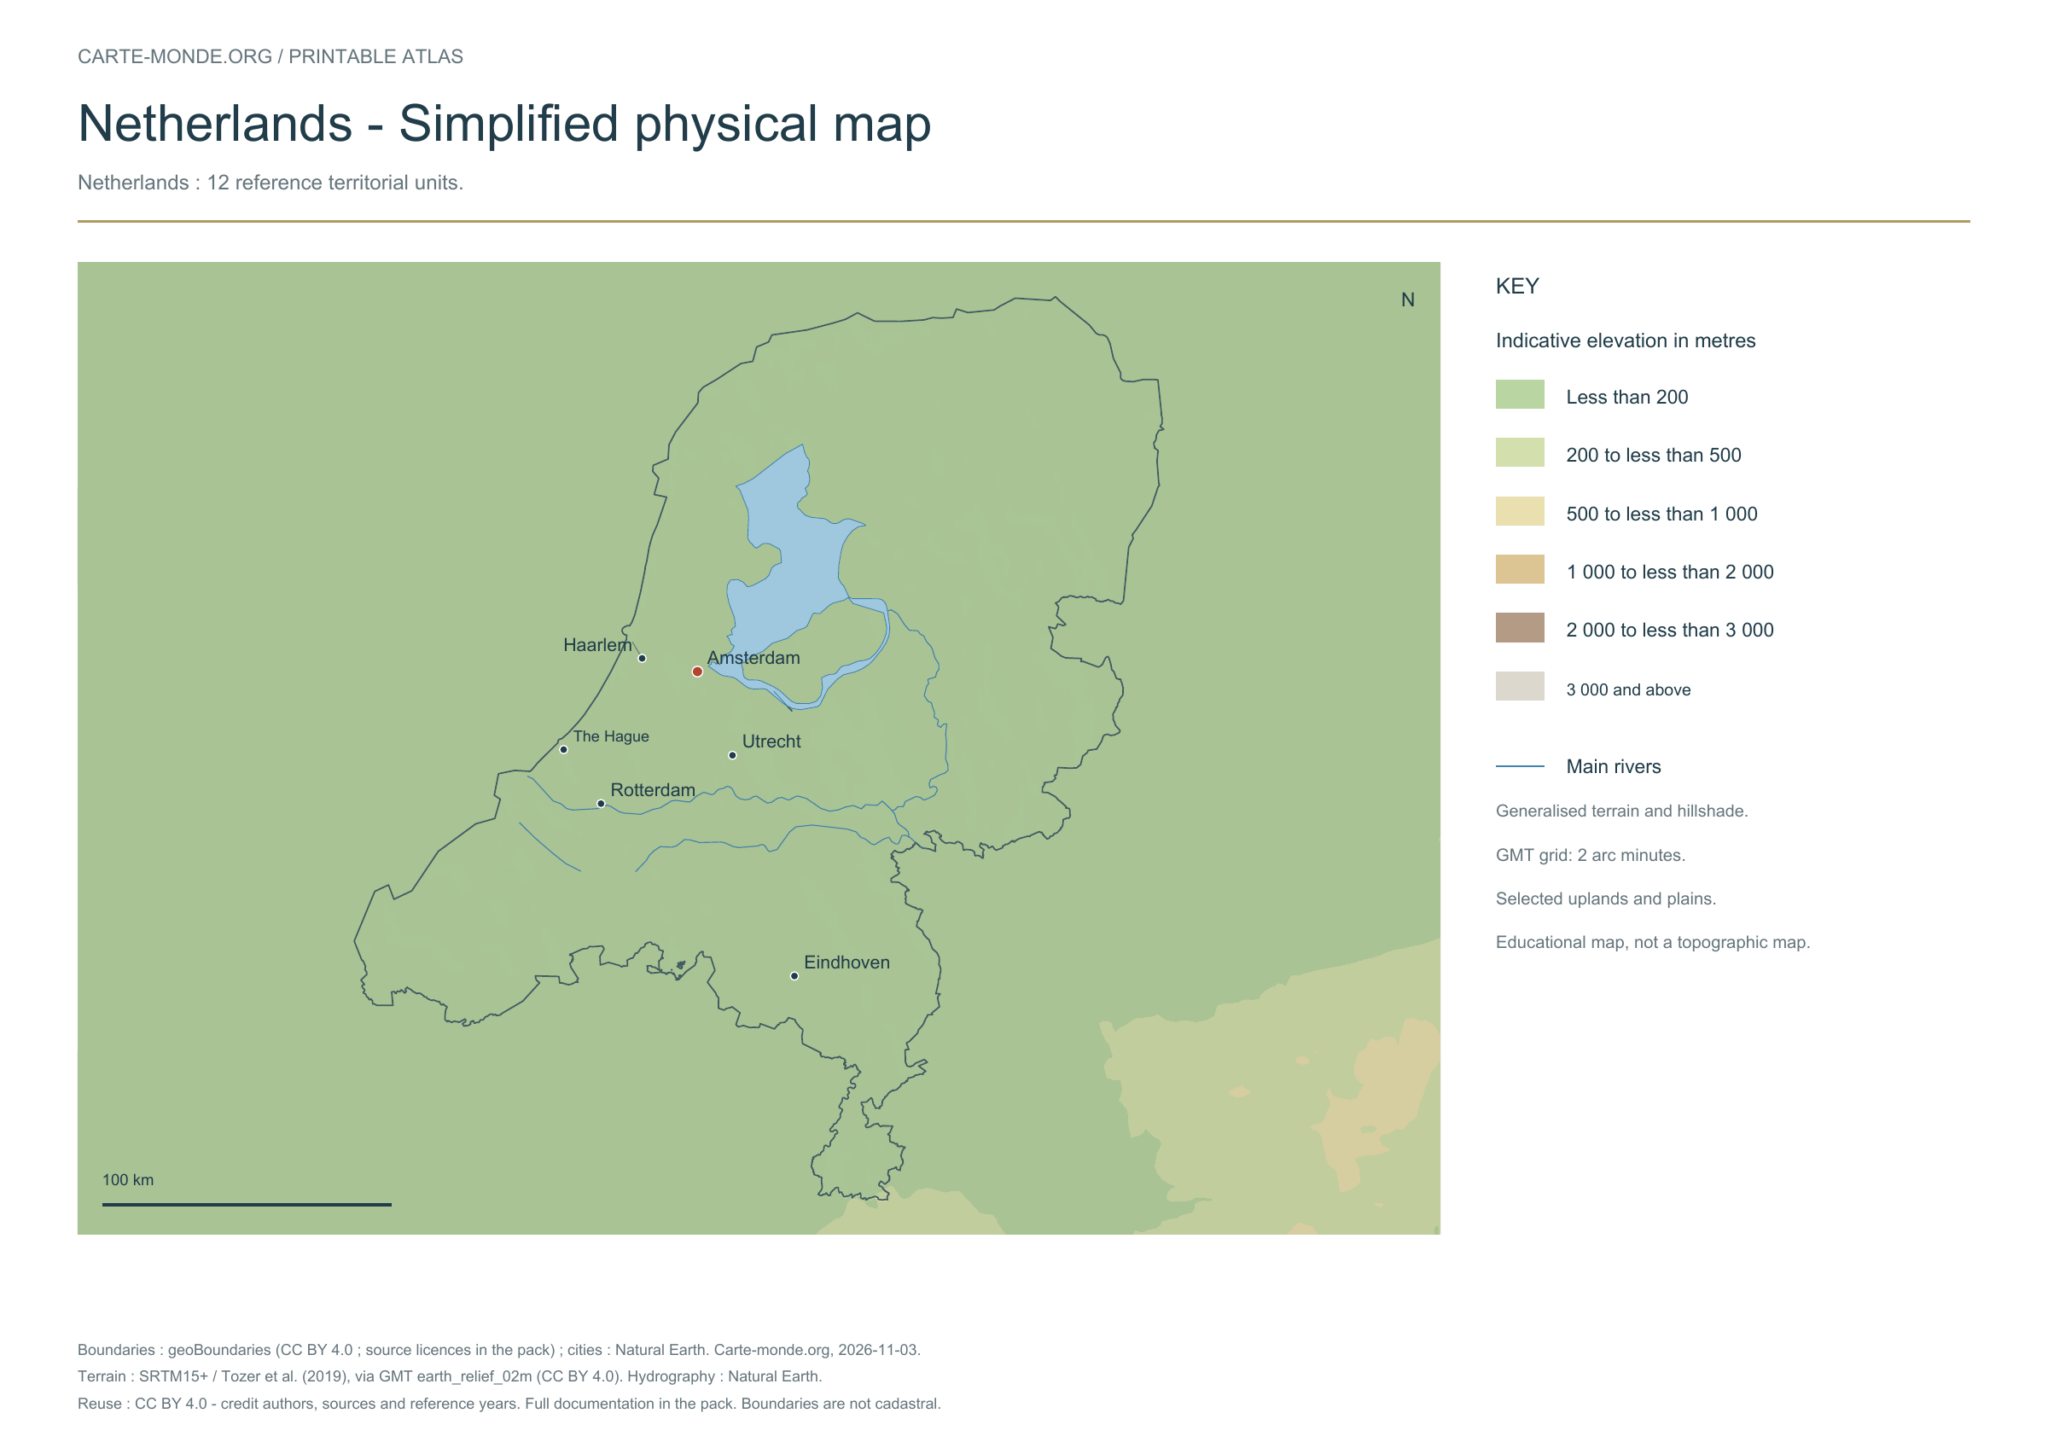
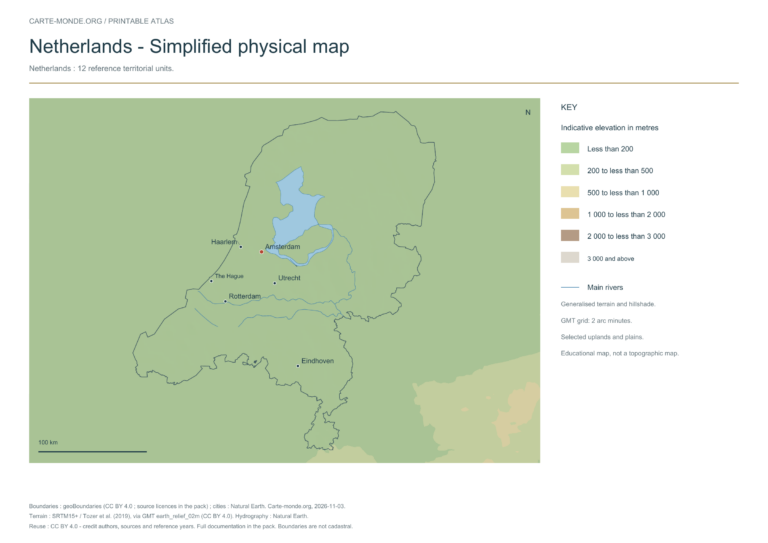
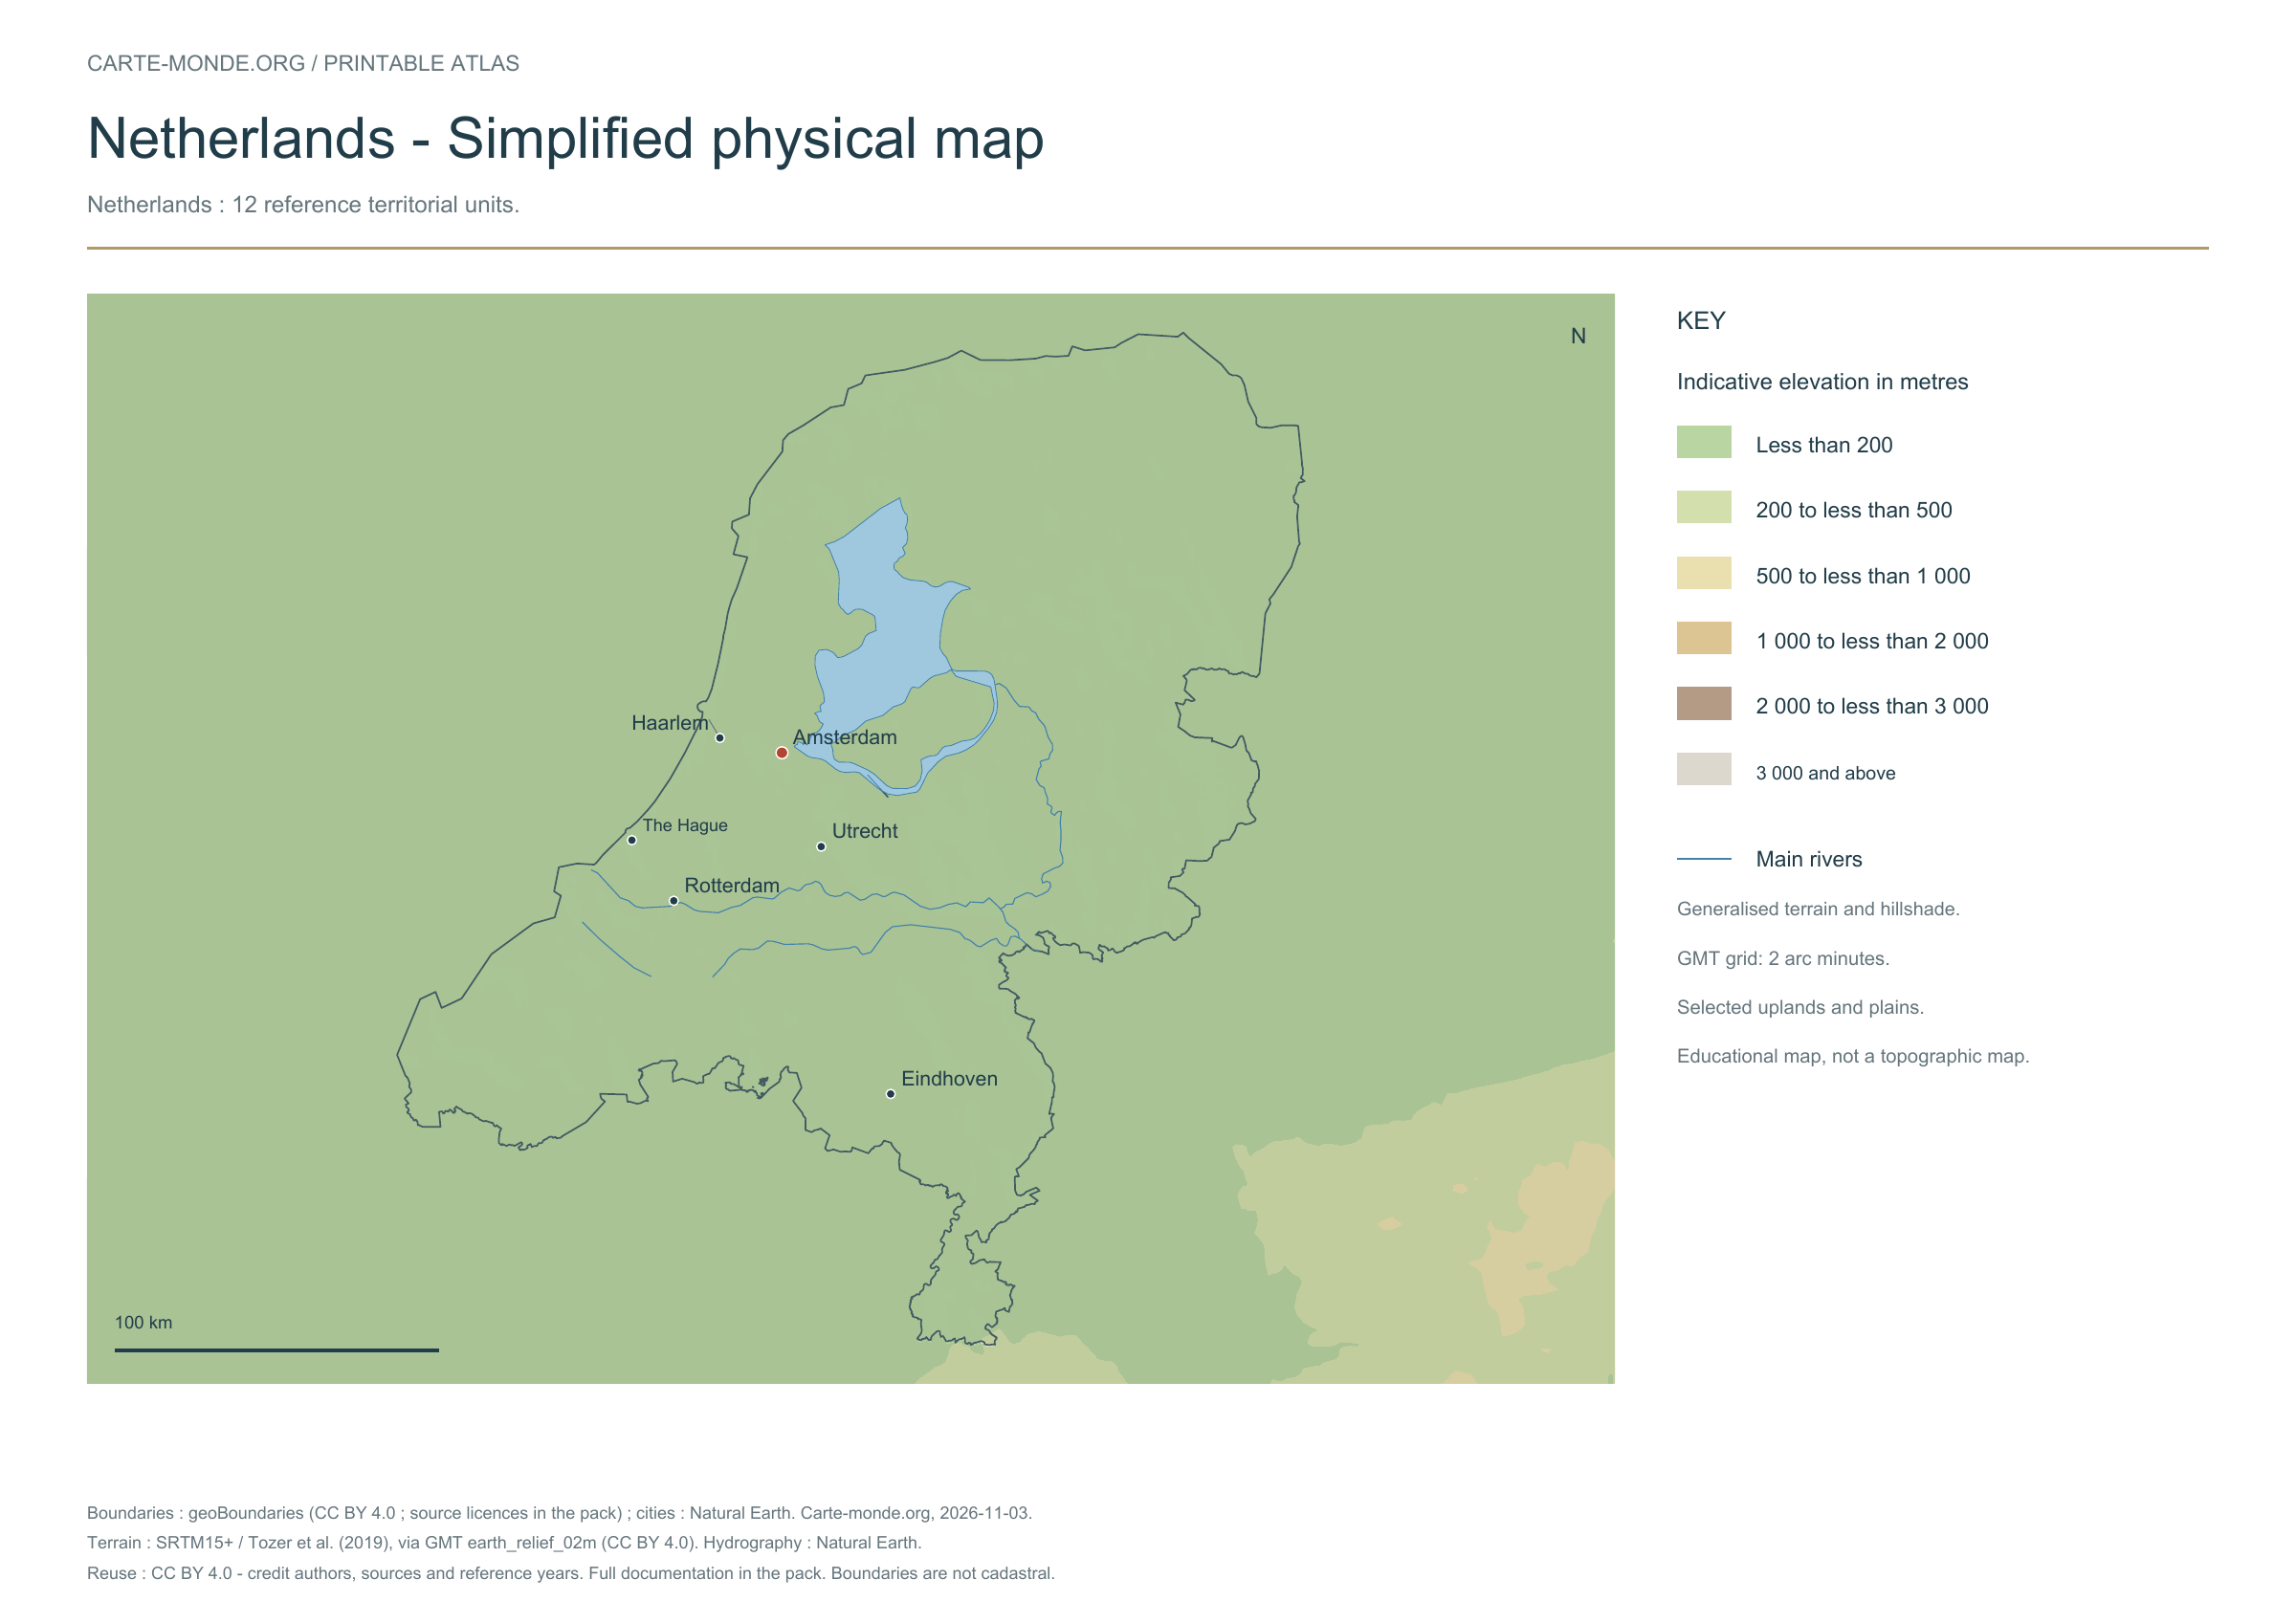
Simplified physical map — Netherlands

Carte-monde.org · November 2026

Simplified elevations

Smoothed relief, elevation colours, main mountain ranges, plains and watercourses. Educational map at national scale.

A4 landscape PDF · PNG 2 400 px · CC BY 4.0

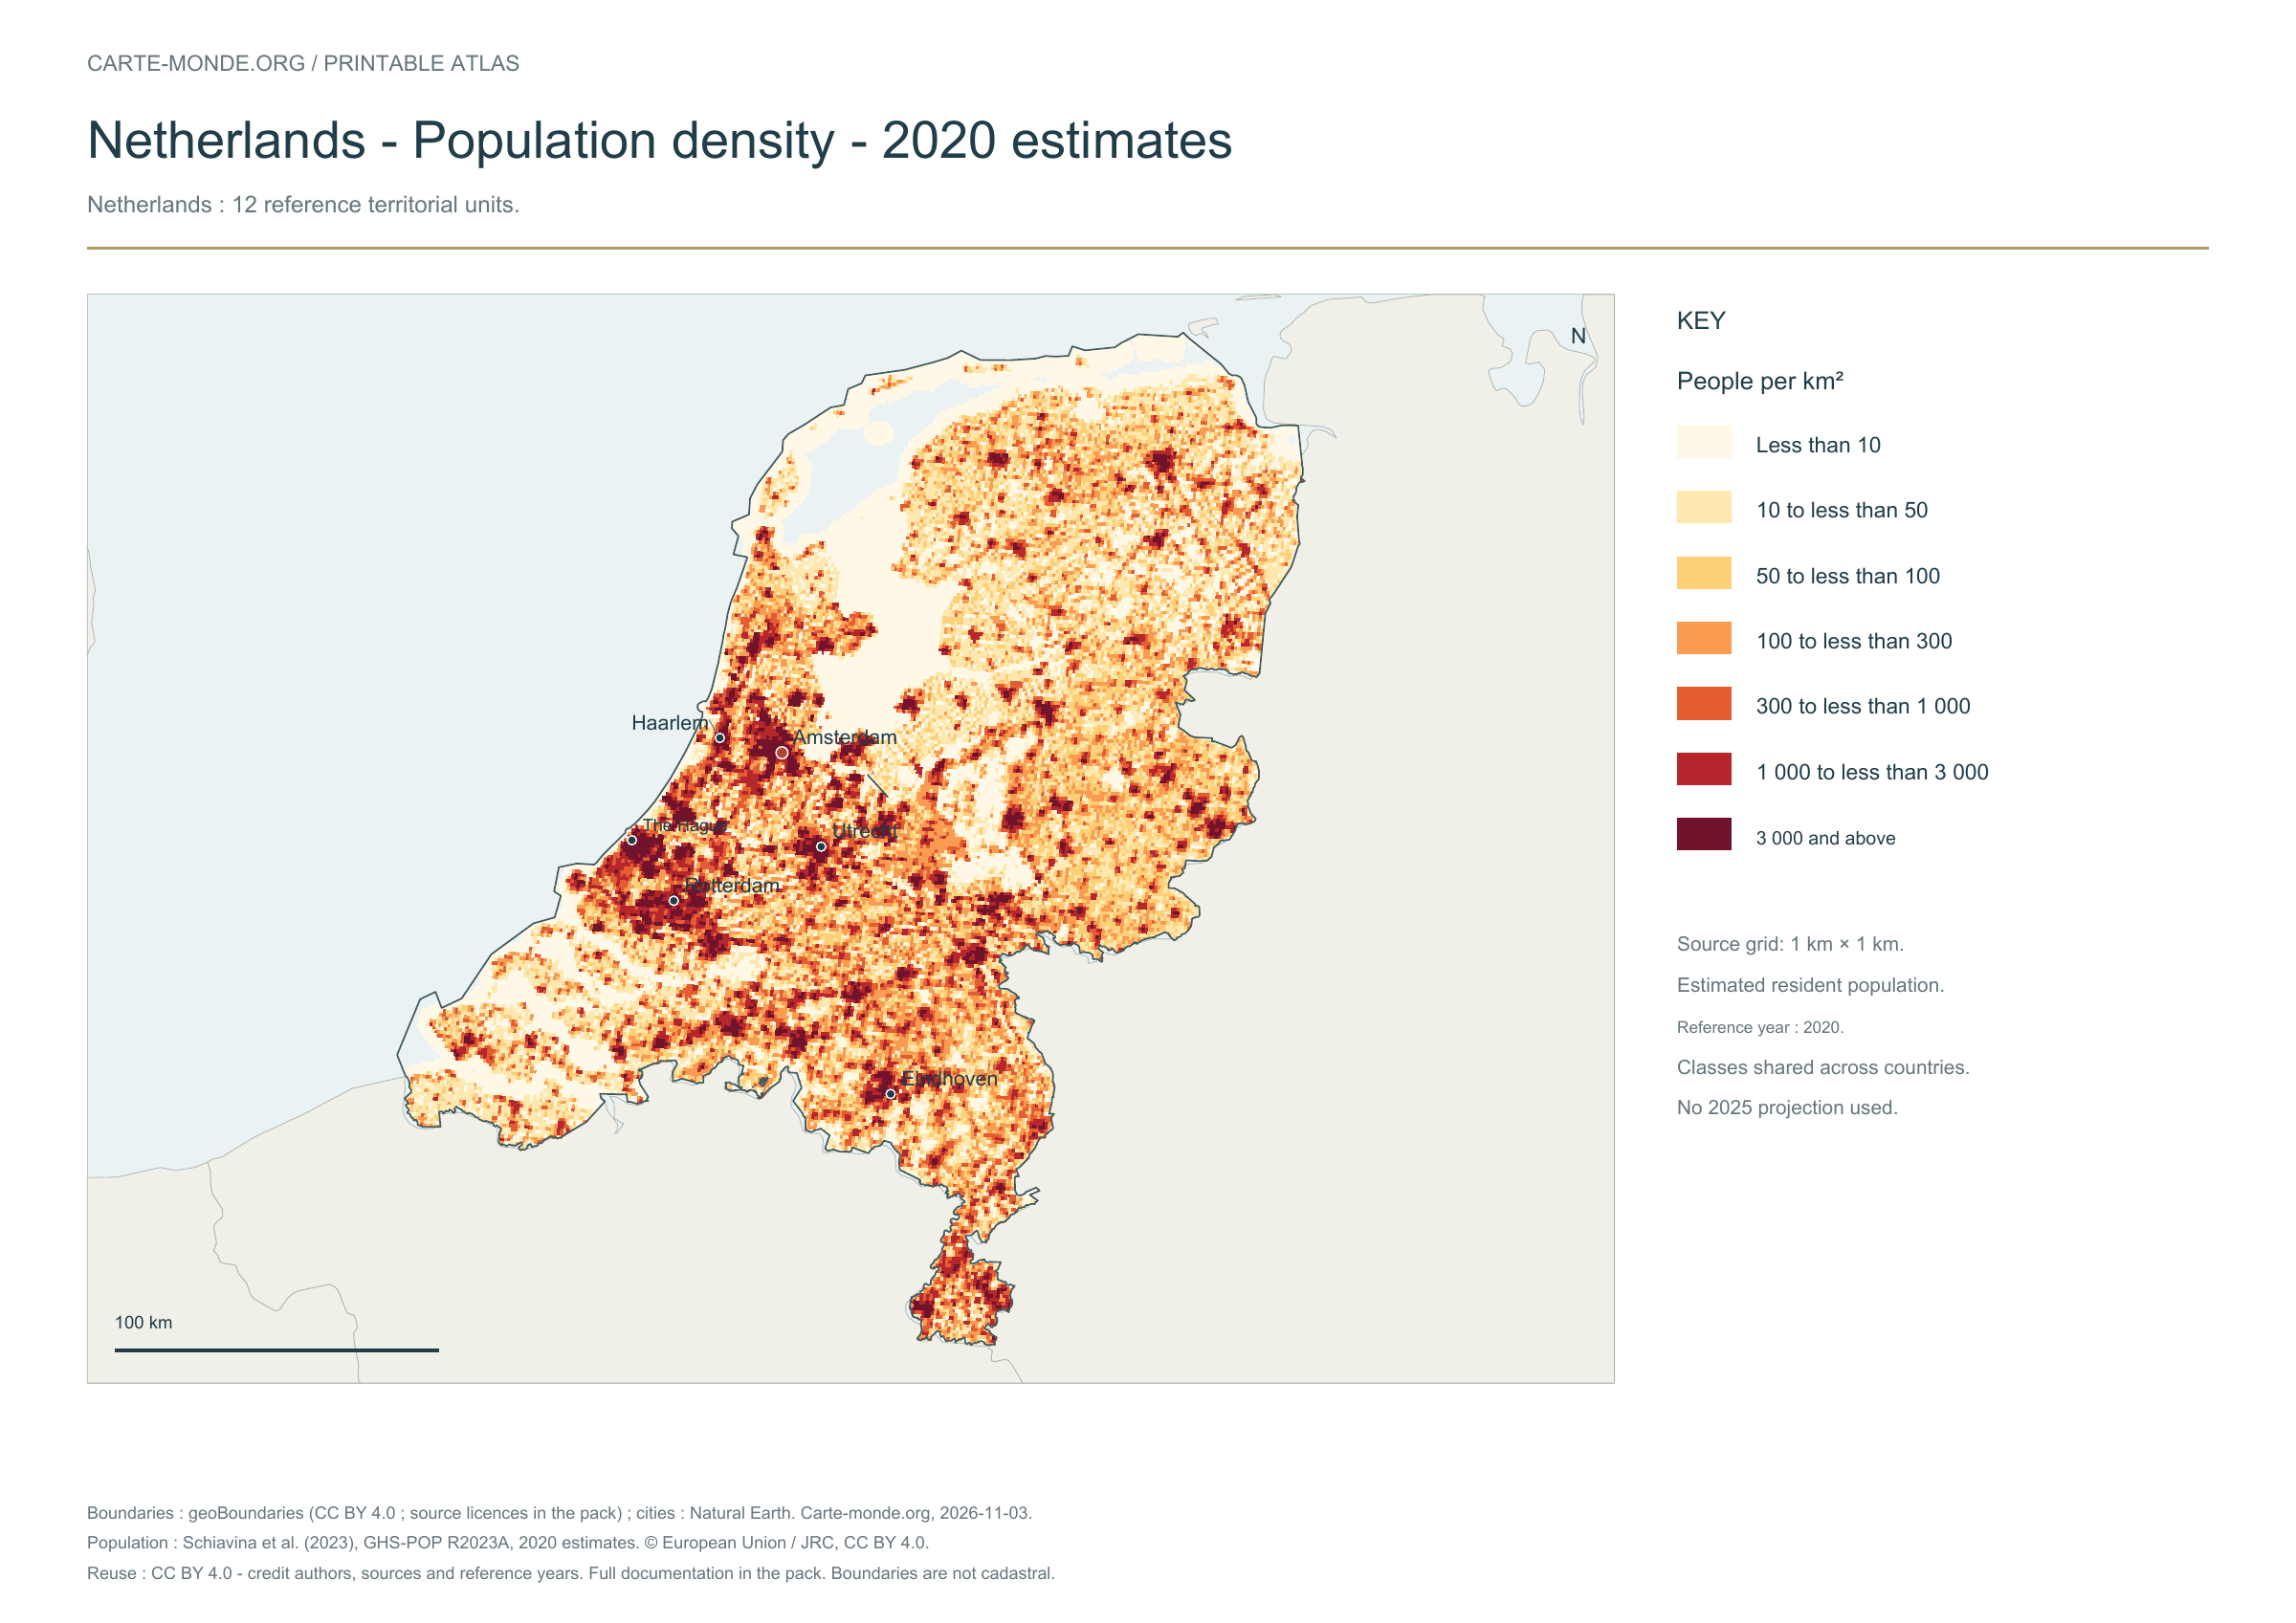
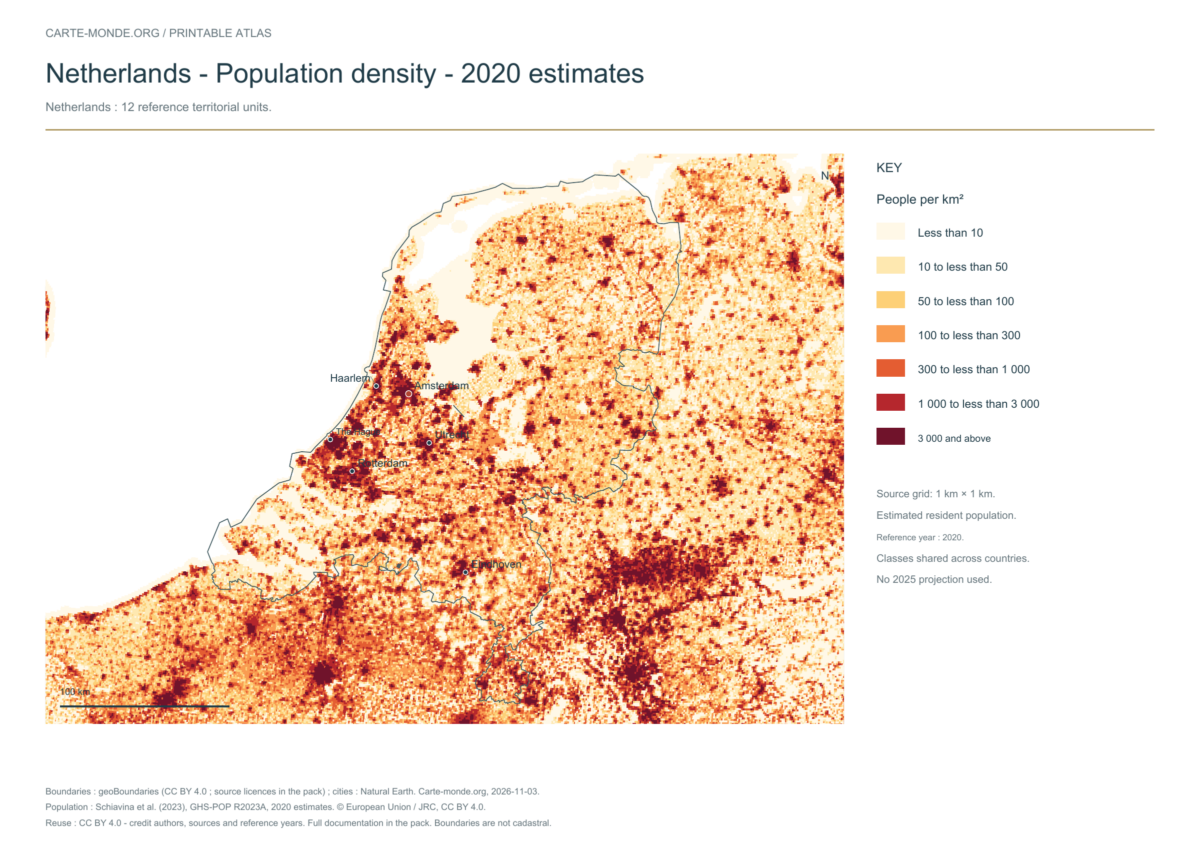
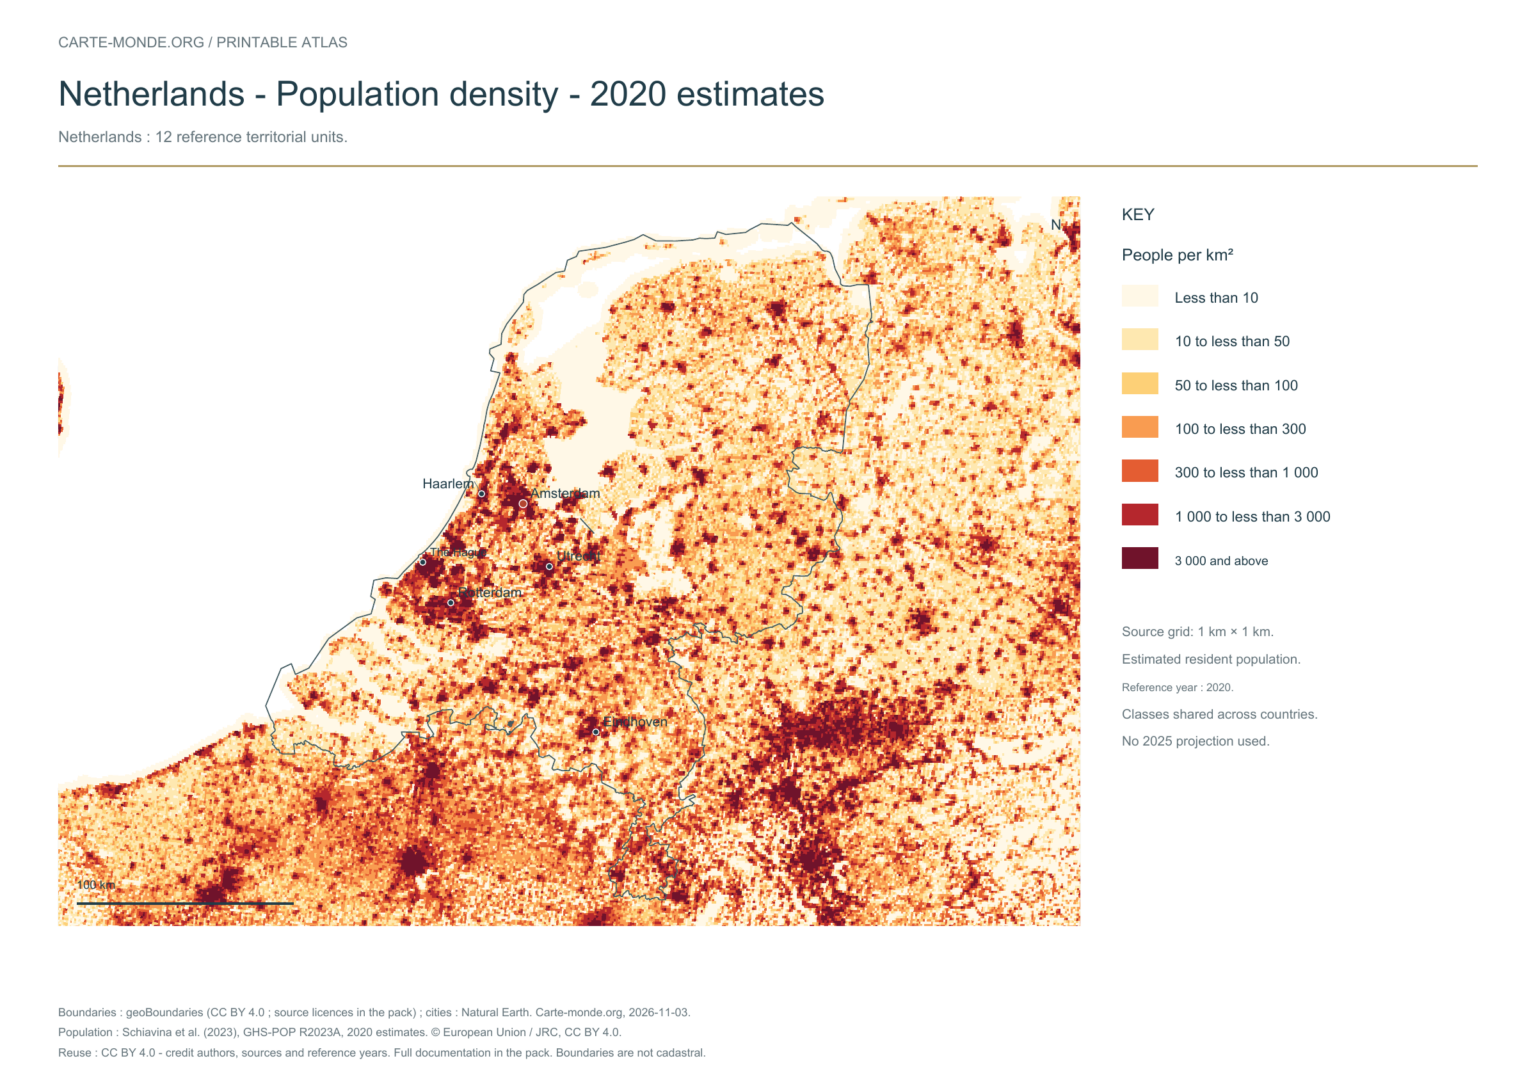
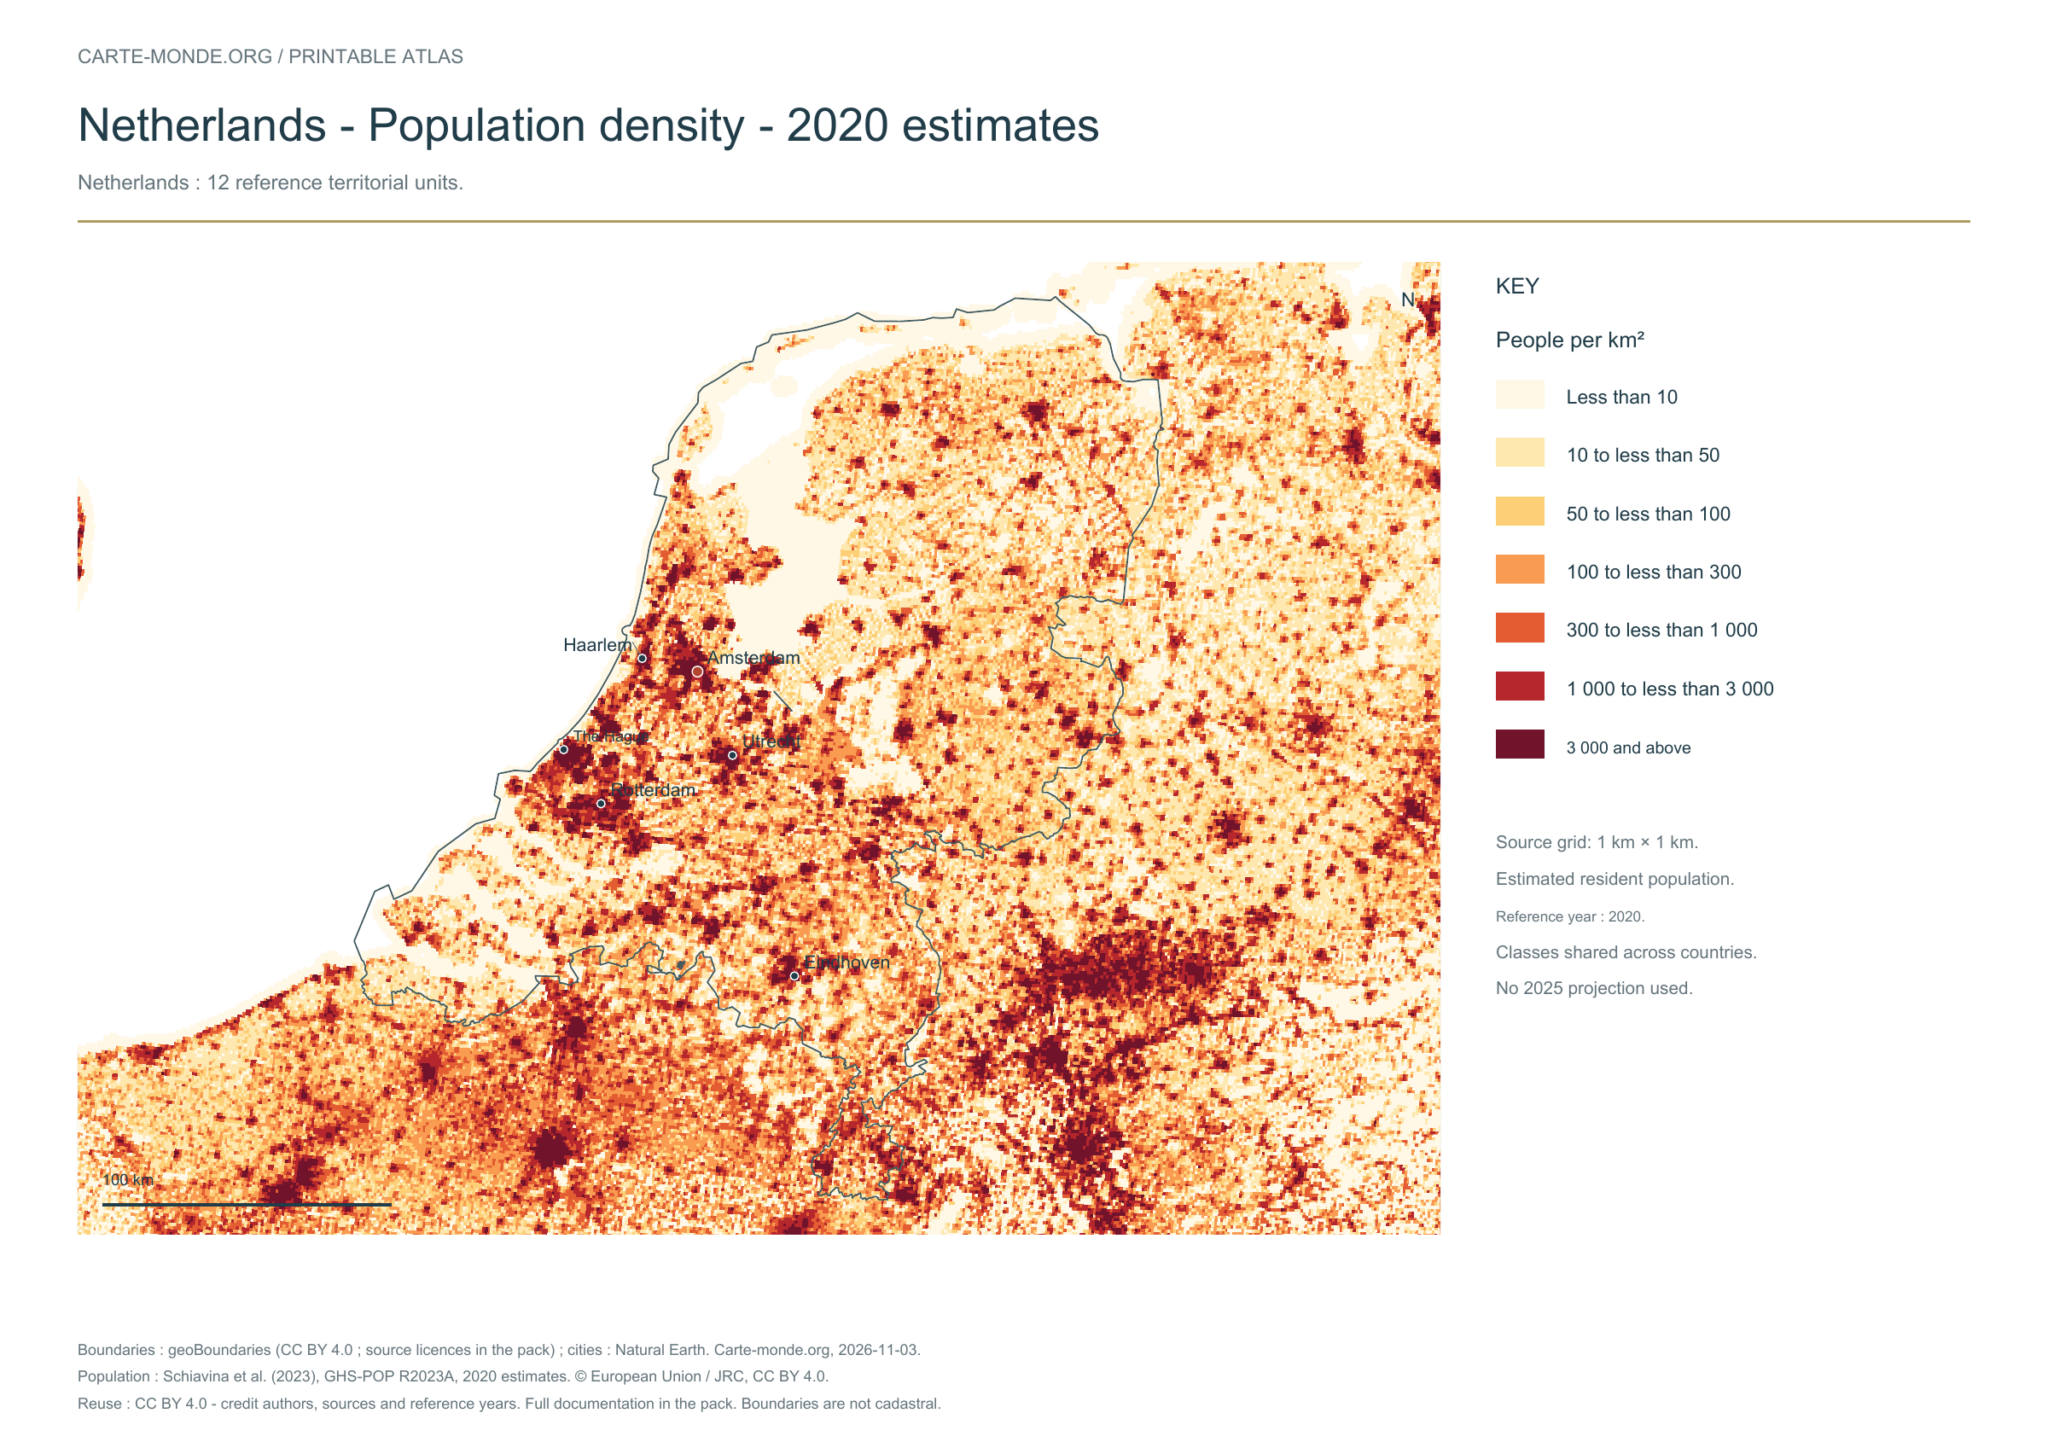
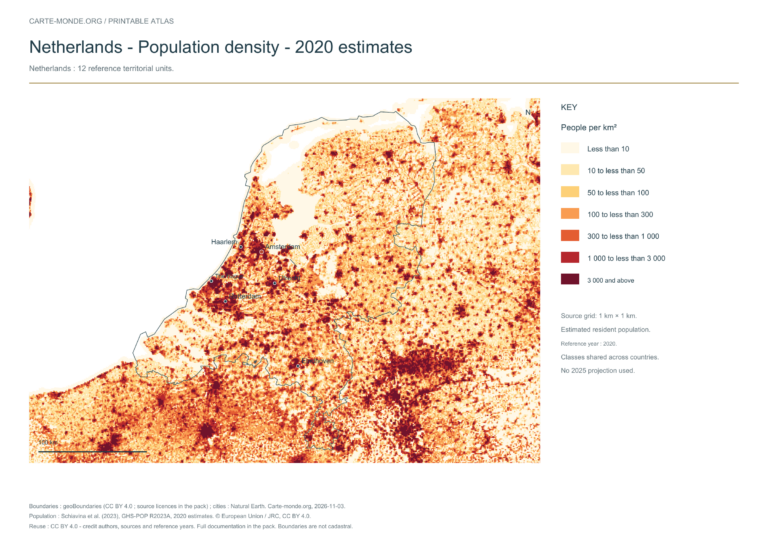
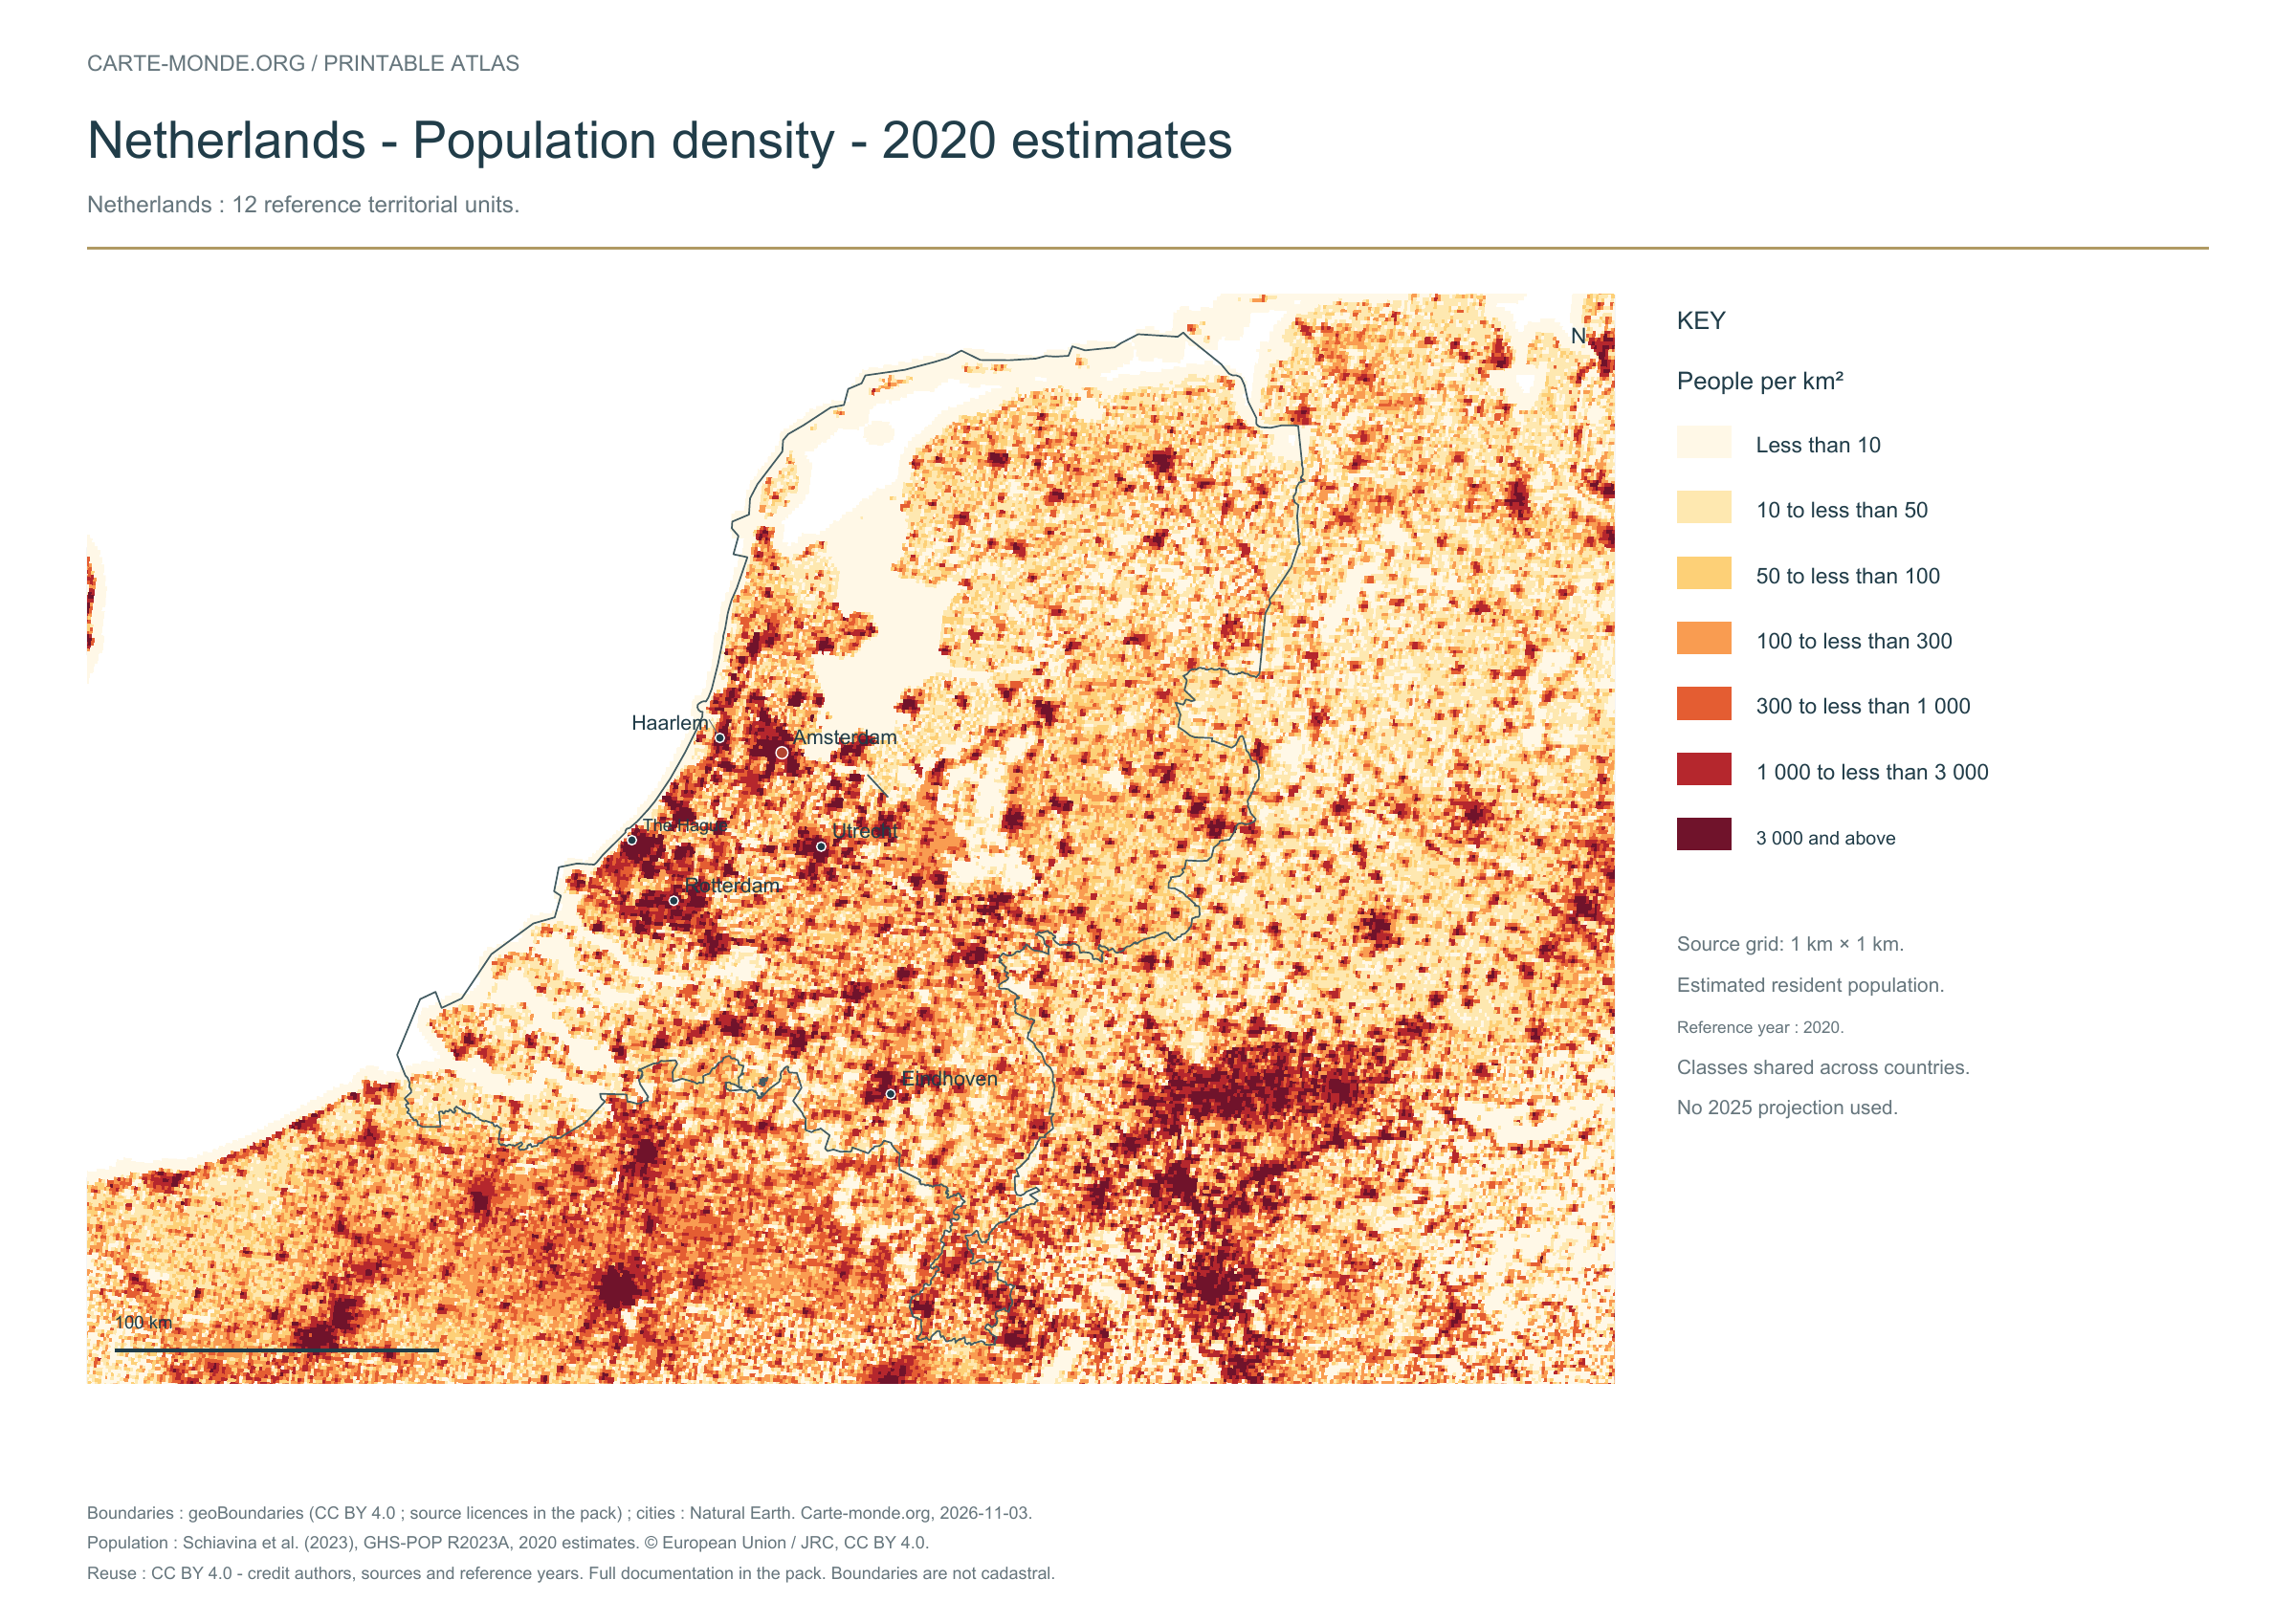
Population density: 2020 estimates

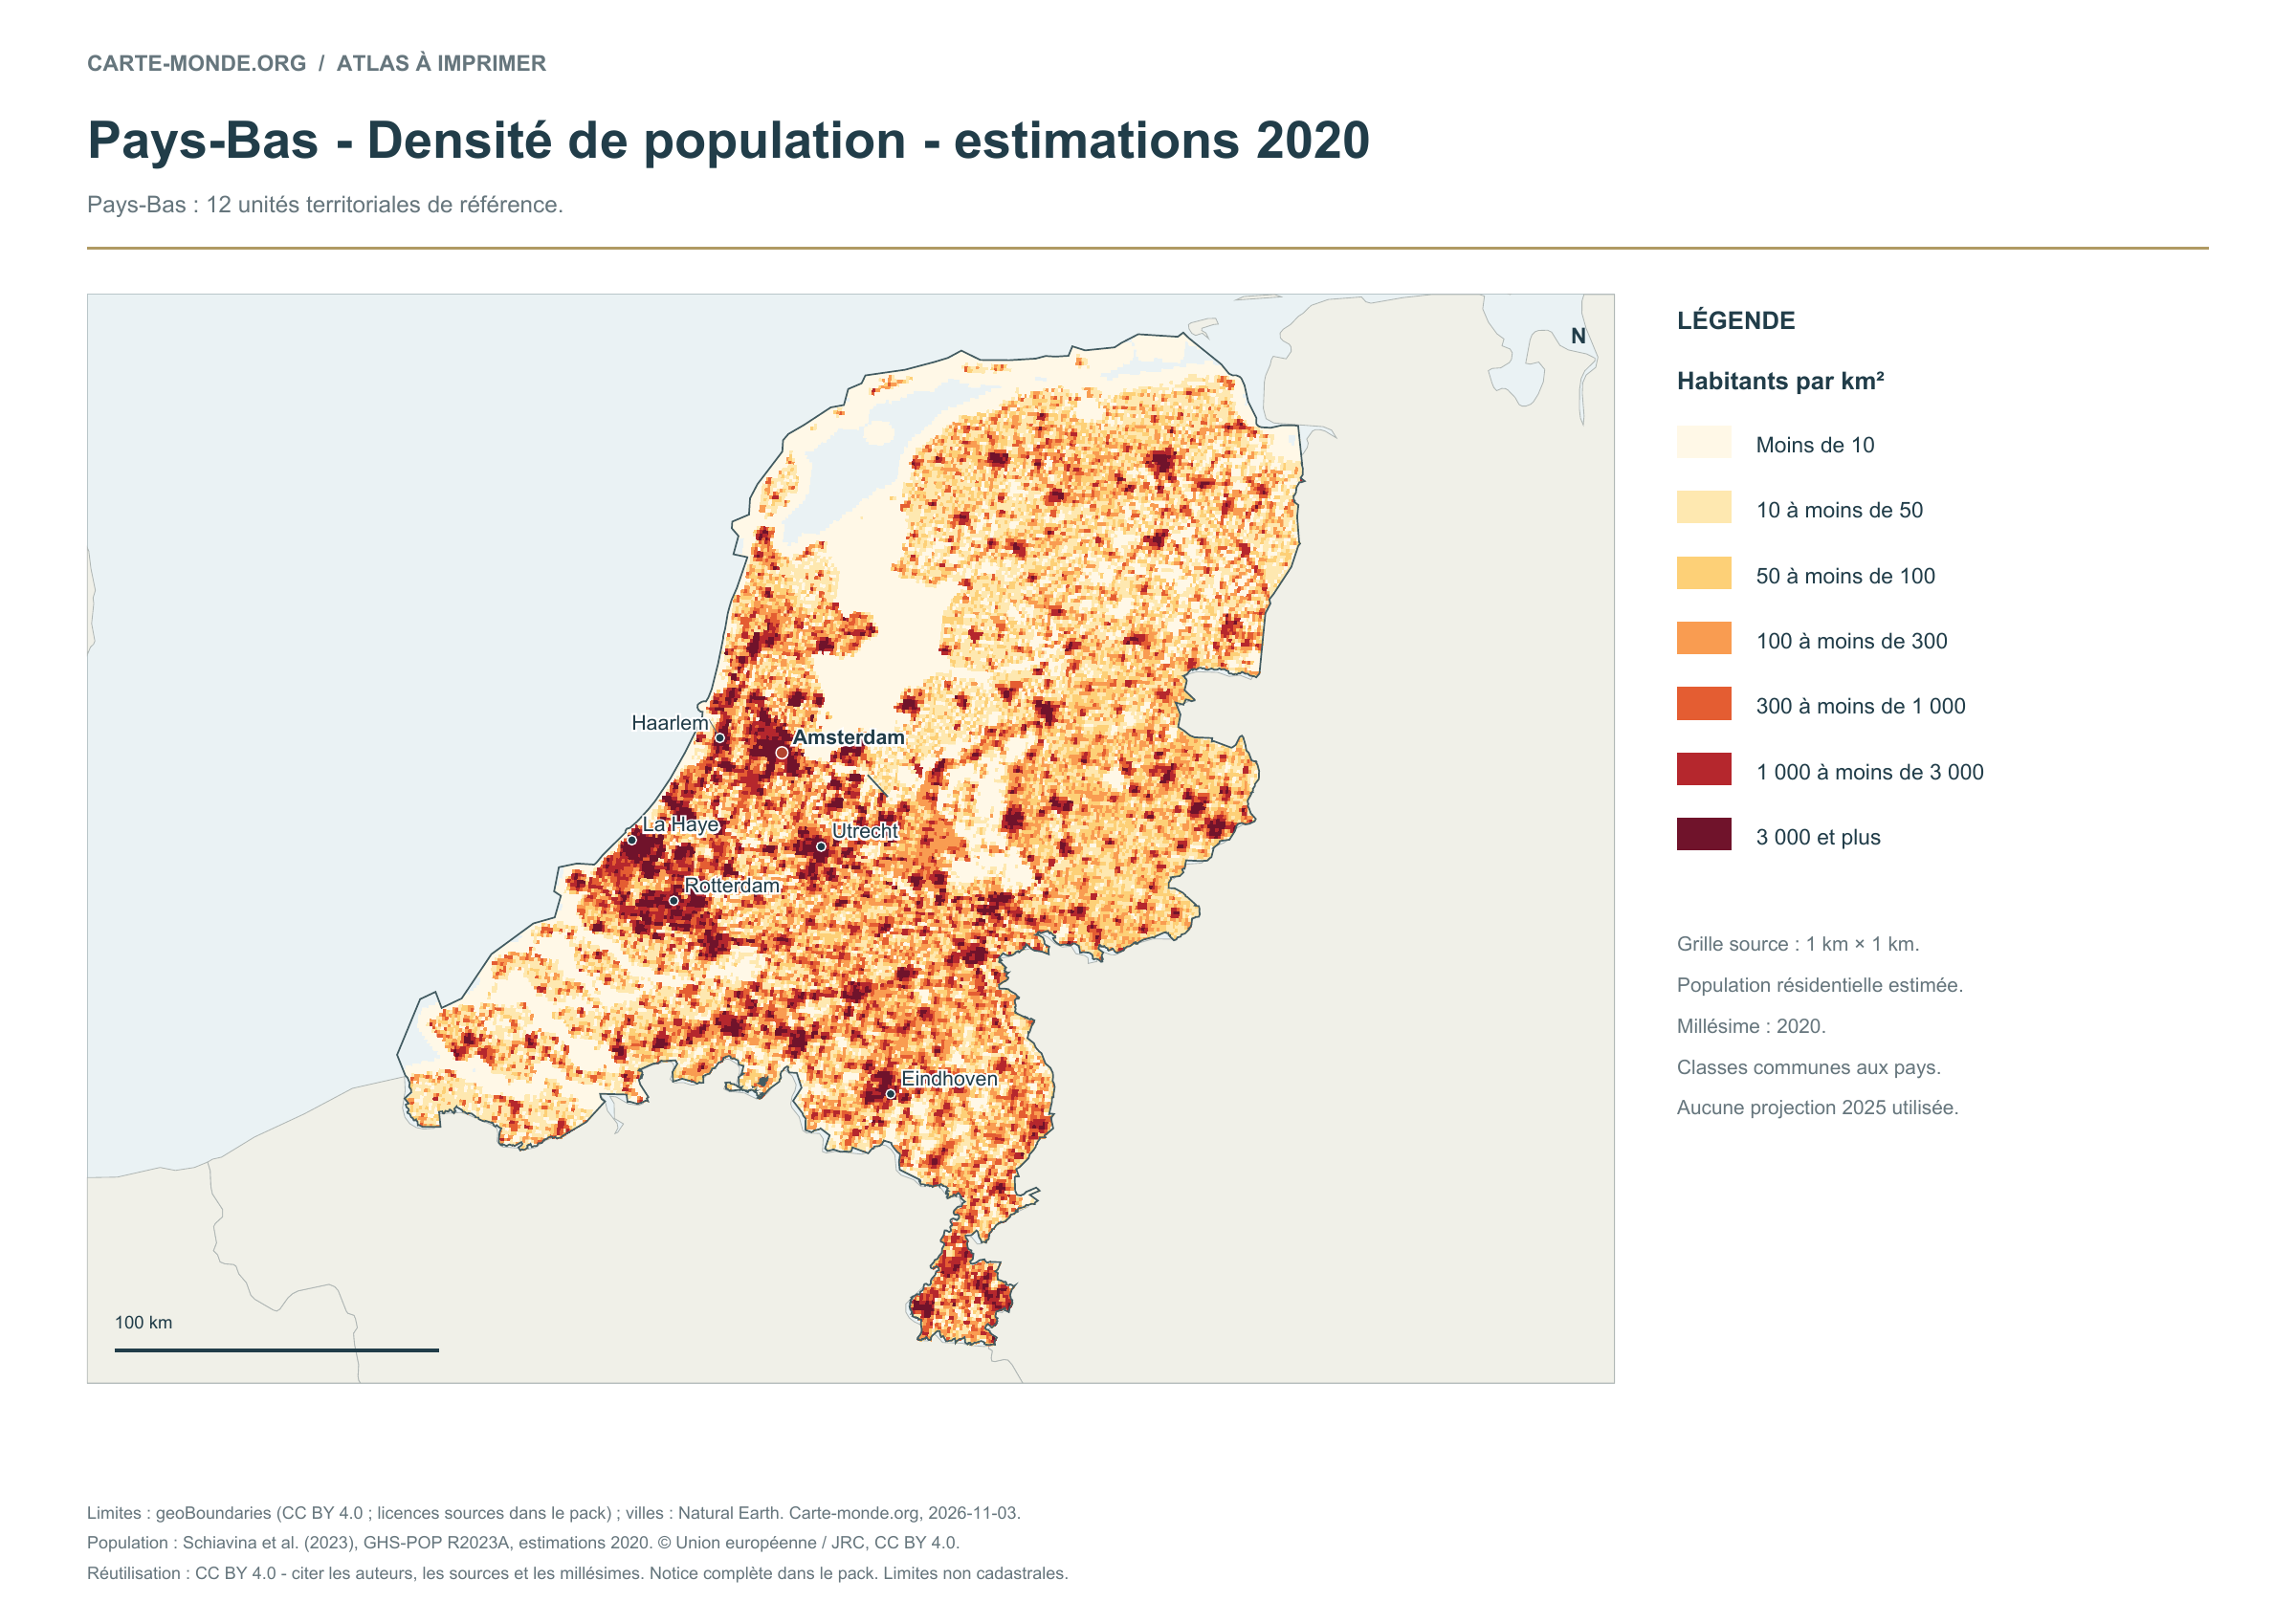
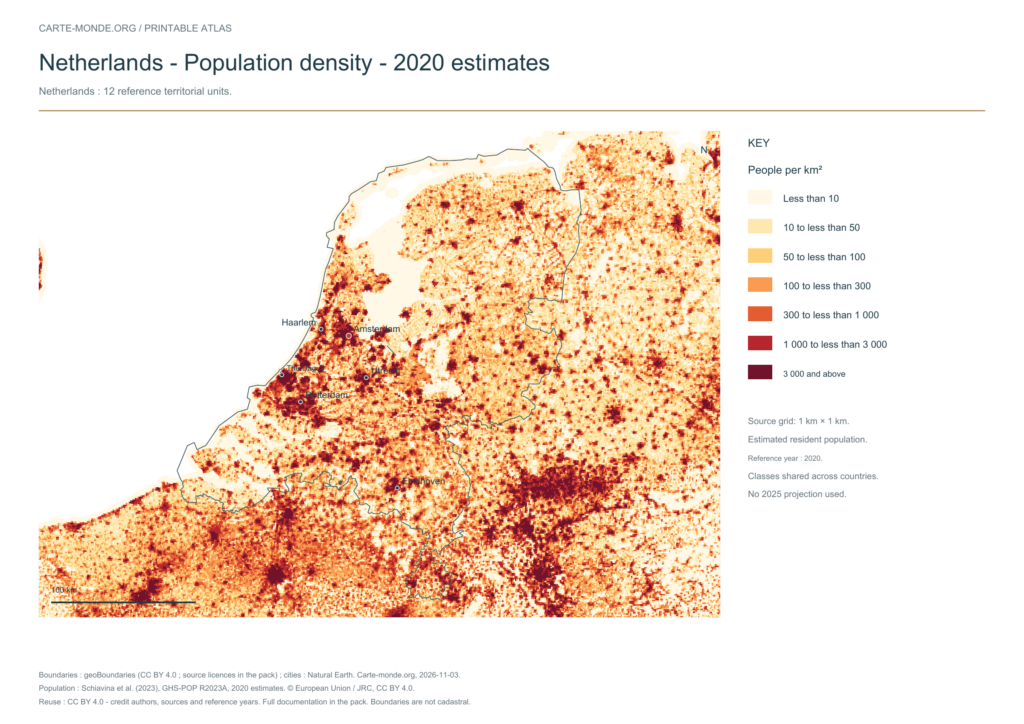
Population density — 2020 estimates — Netherlands

Carte-monde.org · November 2026

Population density — 2020 estimates

Estimated residential population in 2020, on a source grid of 1 km². Inhabitants/km² classes are shared across countries; no 2025 projection. Cells without data remain transparent and do not represent zero population.

A4 landscape PDF · PNG 2 400 px · CC BY 4.0

The data represents estimated residential population in 2020, on a 1 km² source grid. The document’s creation date does not change this reference year.

The five in-house maps in one pack

Regions and cities, location in Europe, simplified elevations, 2020 population density and shaded relief: five A4 PDFs, their PNGs and SVGs, with sources and licences.

Download the five maps — ZIP
Previous edition packs

The four maps in one pack

Four A4 PDFs, their PNGs and SVGs, with full notes. Terrain and density use an embedded image background; text and linework remain vector-based.

Download the Netherlands pack — ZIP

Find the old maps of the Netherlands

Previously published maps remain accessible at their original URLs, with the collection’s text and credits.

Open the old maps of the Netherlands

Choose and print a map

Regions and cities show how the territory is organized; the location map places the country; terrain shows the main natural regions; density shows population distribution. Print the in-house PDFs in A4 landscape with “Fit to page”. Insets have their own scales.

For exercises: six blank base maps of the Netherlands.

Sources, reference years and reuse

Administrative boundaries: geoBoundaries / National Georegister. European Netherlands, excluding the Caribbean — Geographic data date: 2022. The file edition date does not mean that all boundaries have been updated. Boundary source and terms. Primary licence: CC0 1.0 Universal (CC0 1.0) Public Domain Dedication. The geometries used and credits are included in the pack; derived databases under ODbL remain under ODbL.

Neighbouring area, cities and hydrography: Natural Earth 5.1.1, public domain, generalised boundaries not for cadastral use.

Relief: SRTM15+ / Tozer et al. (2019), reference publication, via GMT earth_relief_02m derived from SRTM15+V2.7. Grid smoothed to two arc minutes, suitable for a national overview, without topographic precision.

Population: Schiavina et al. (2023), GHS-POP R2023A, 2020 residential estimates, © European Union / JRC, CC BY 4.0. The 1 km² Mollweide cells are expressed in inhabitants/km². Methodology: Pesaresi et al. (2024).

The four new maps: created by Carte-monde.org, November 2026, under CC BY 4.0. Cite authors, sources and reference years, and indicate adaptations. Additional and older maps retain their own rights.

Country maps · Other maps and archives

Previous versions: maps and files preserved

These files remain available at their original URLs. For corrected maps, use the main links above. Each edition retains its credits and date.

Raster base map, cities, rivers and lakes: Natural Earth, public domain. Other boundary credits and licences are retained in the pack. Cartographic work CC BY 4.0; ODbL-derived data retains its licence. No topographic accuracy is claimed.

Previous collection — original files preserved
Flag of the Netherlands
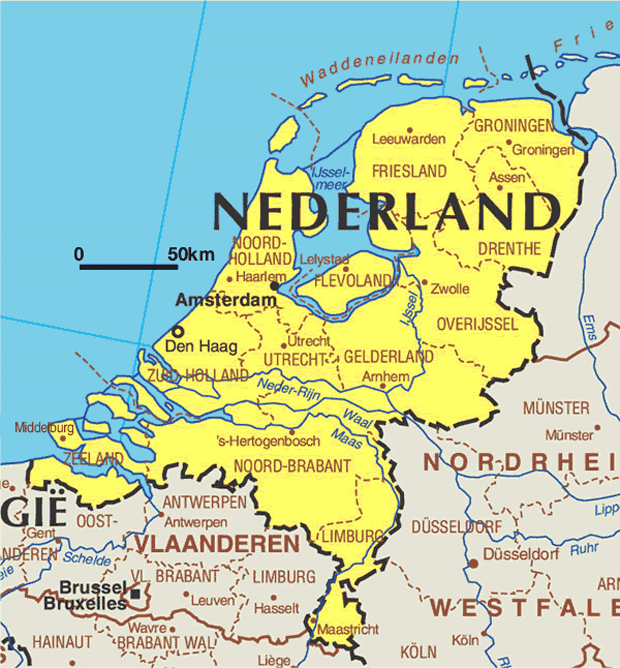
general map of the Netherlands
Map of Netherlands
Map of Netherlands
Original French files
Previous language edition

Maps of Poland: regions, cities, relief and population

Flag of Poland
Flag of Poland

POLAND · PRINTABLE MAPS

Five printable maps of Poland: regions and cities, location in Europe, two views of the relief and population. PDFs, images and sources are available below.

Our five maps have English labels. Maps from other publishers retain their original language.

Regions, cities and location in Europe

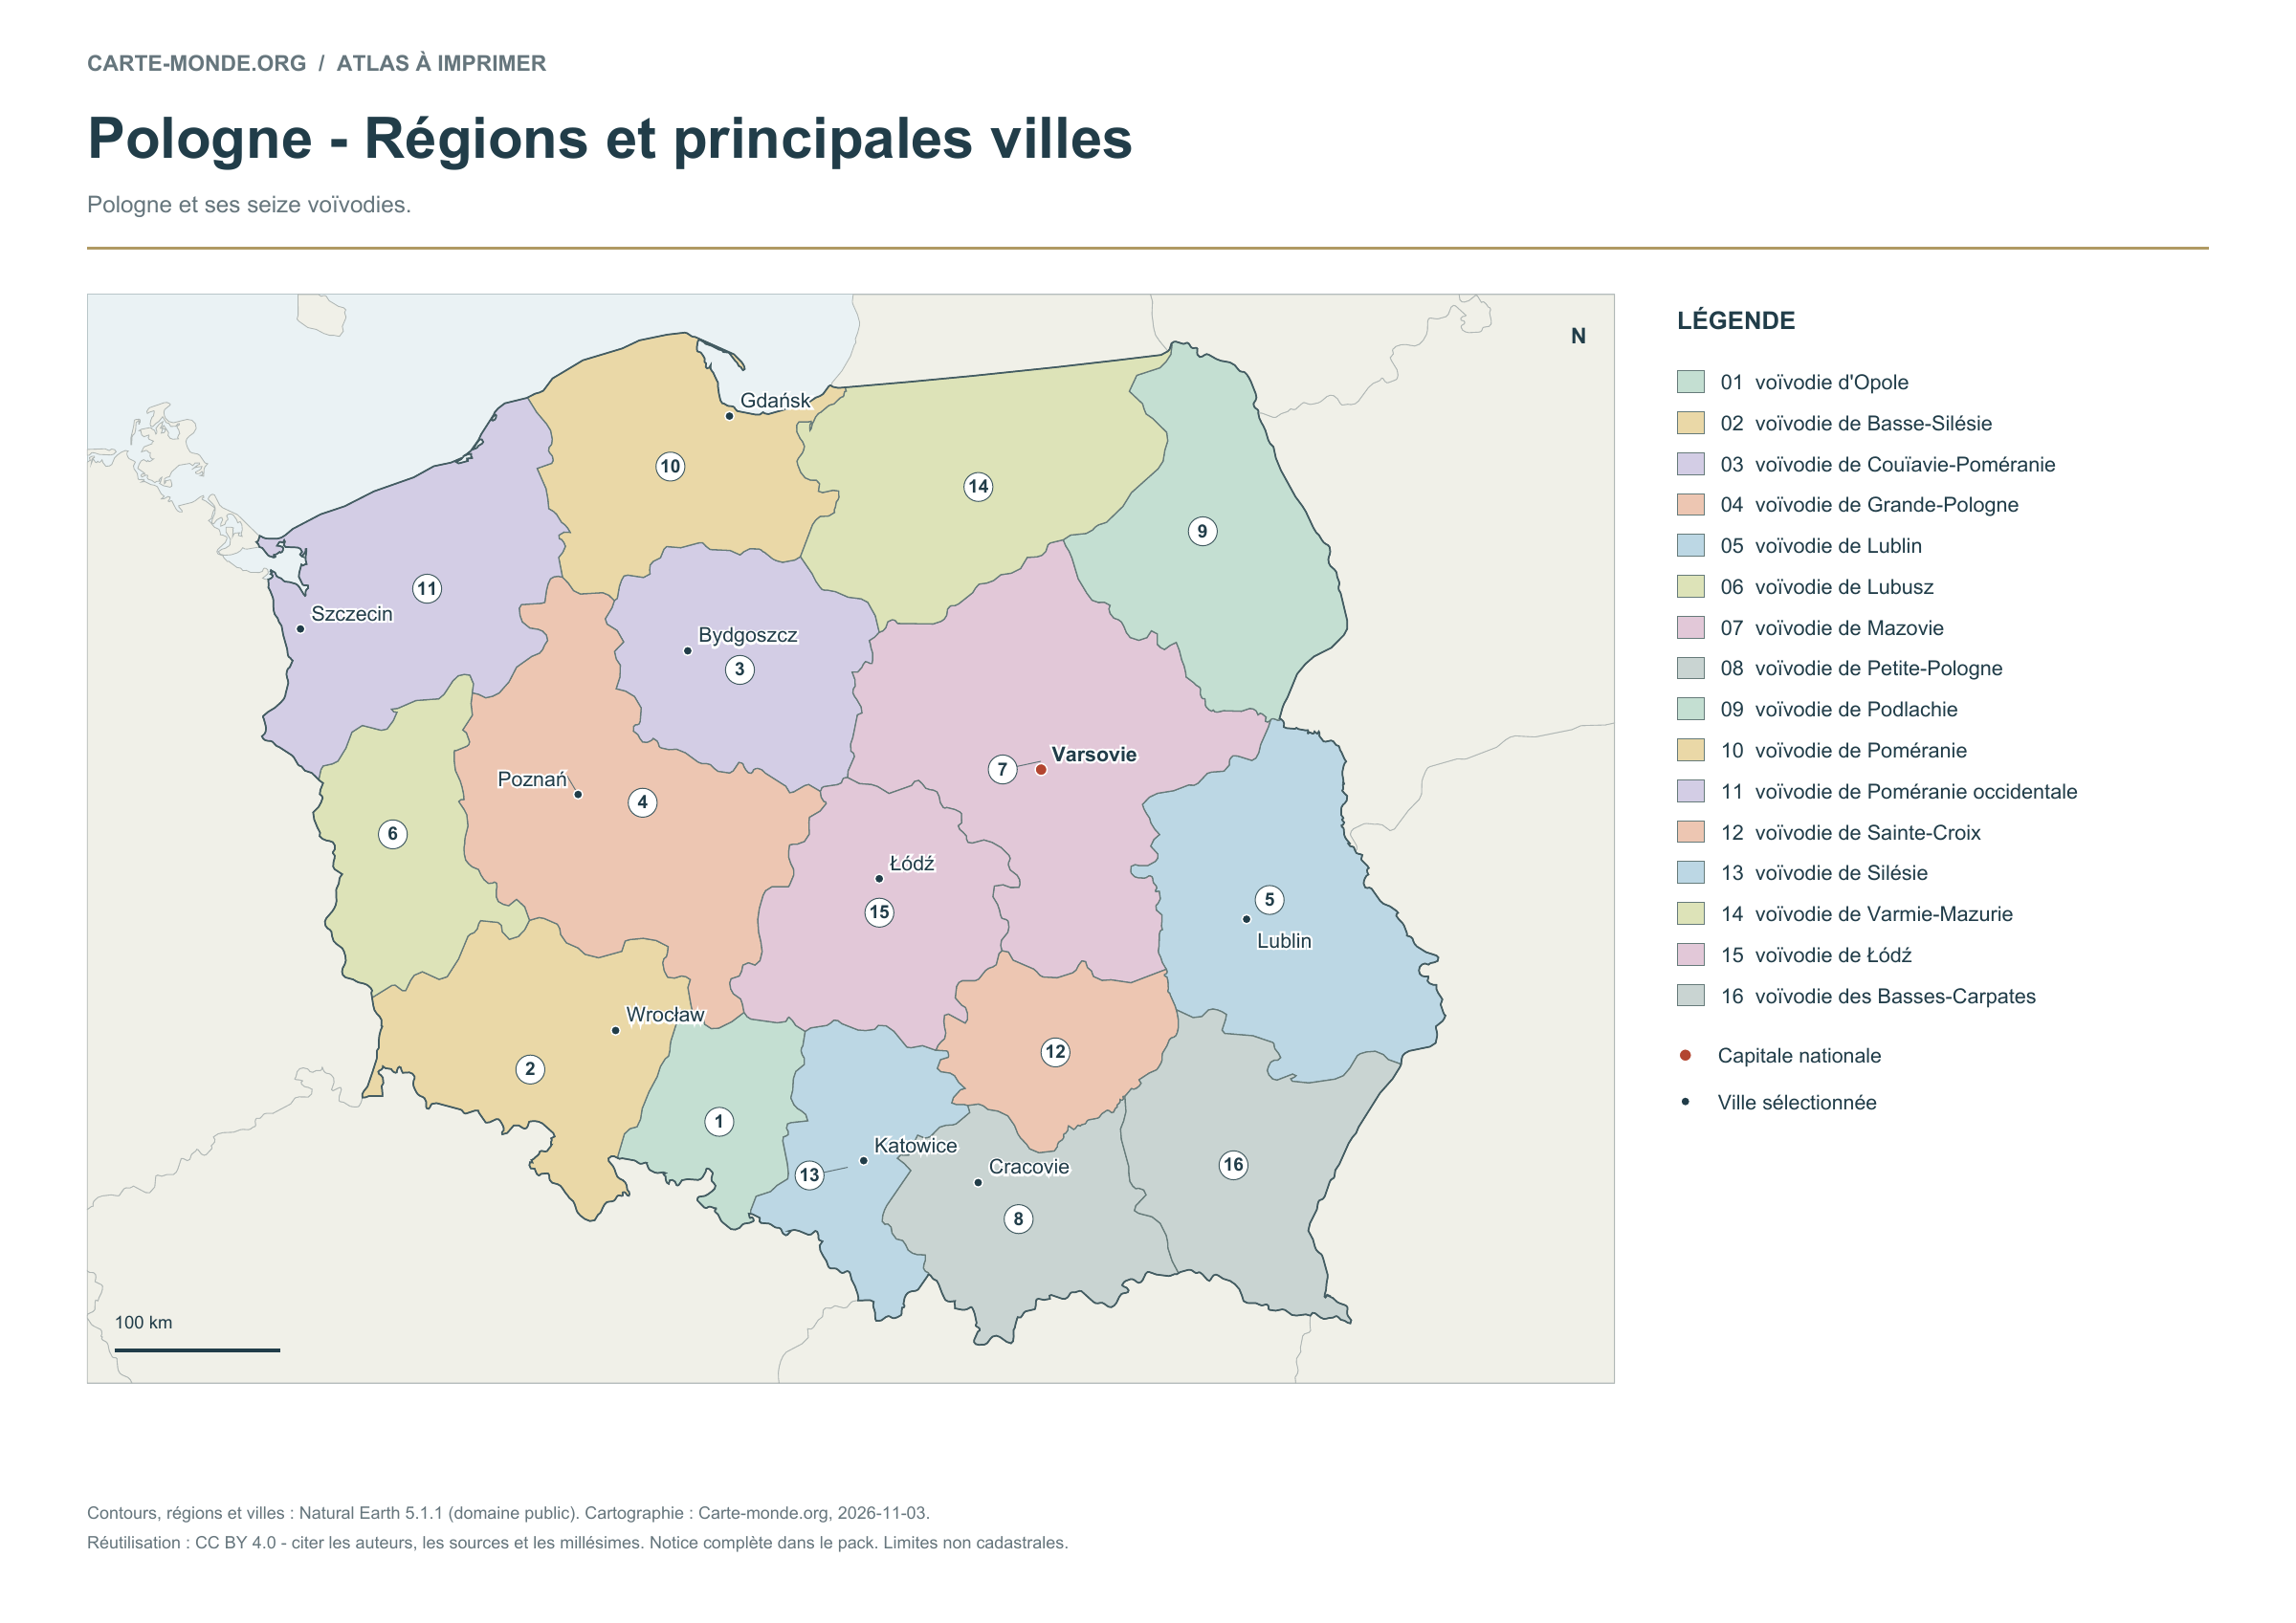
Poland and its sixteen voivodeships.

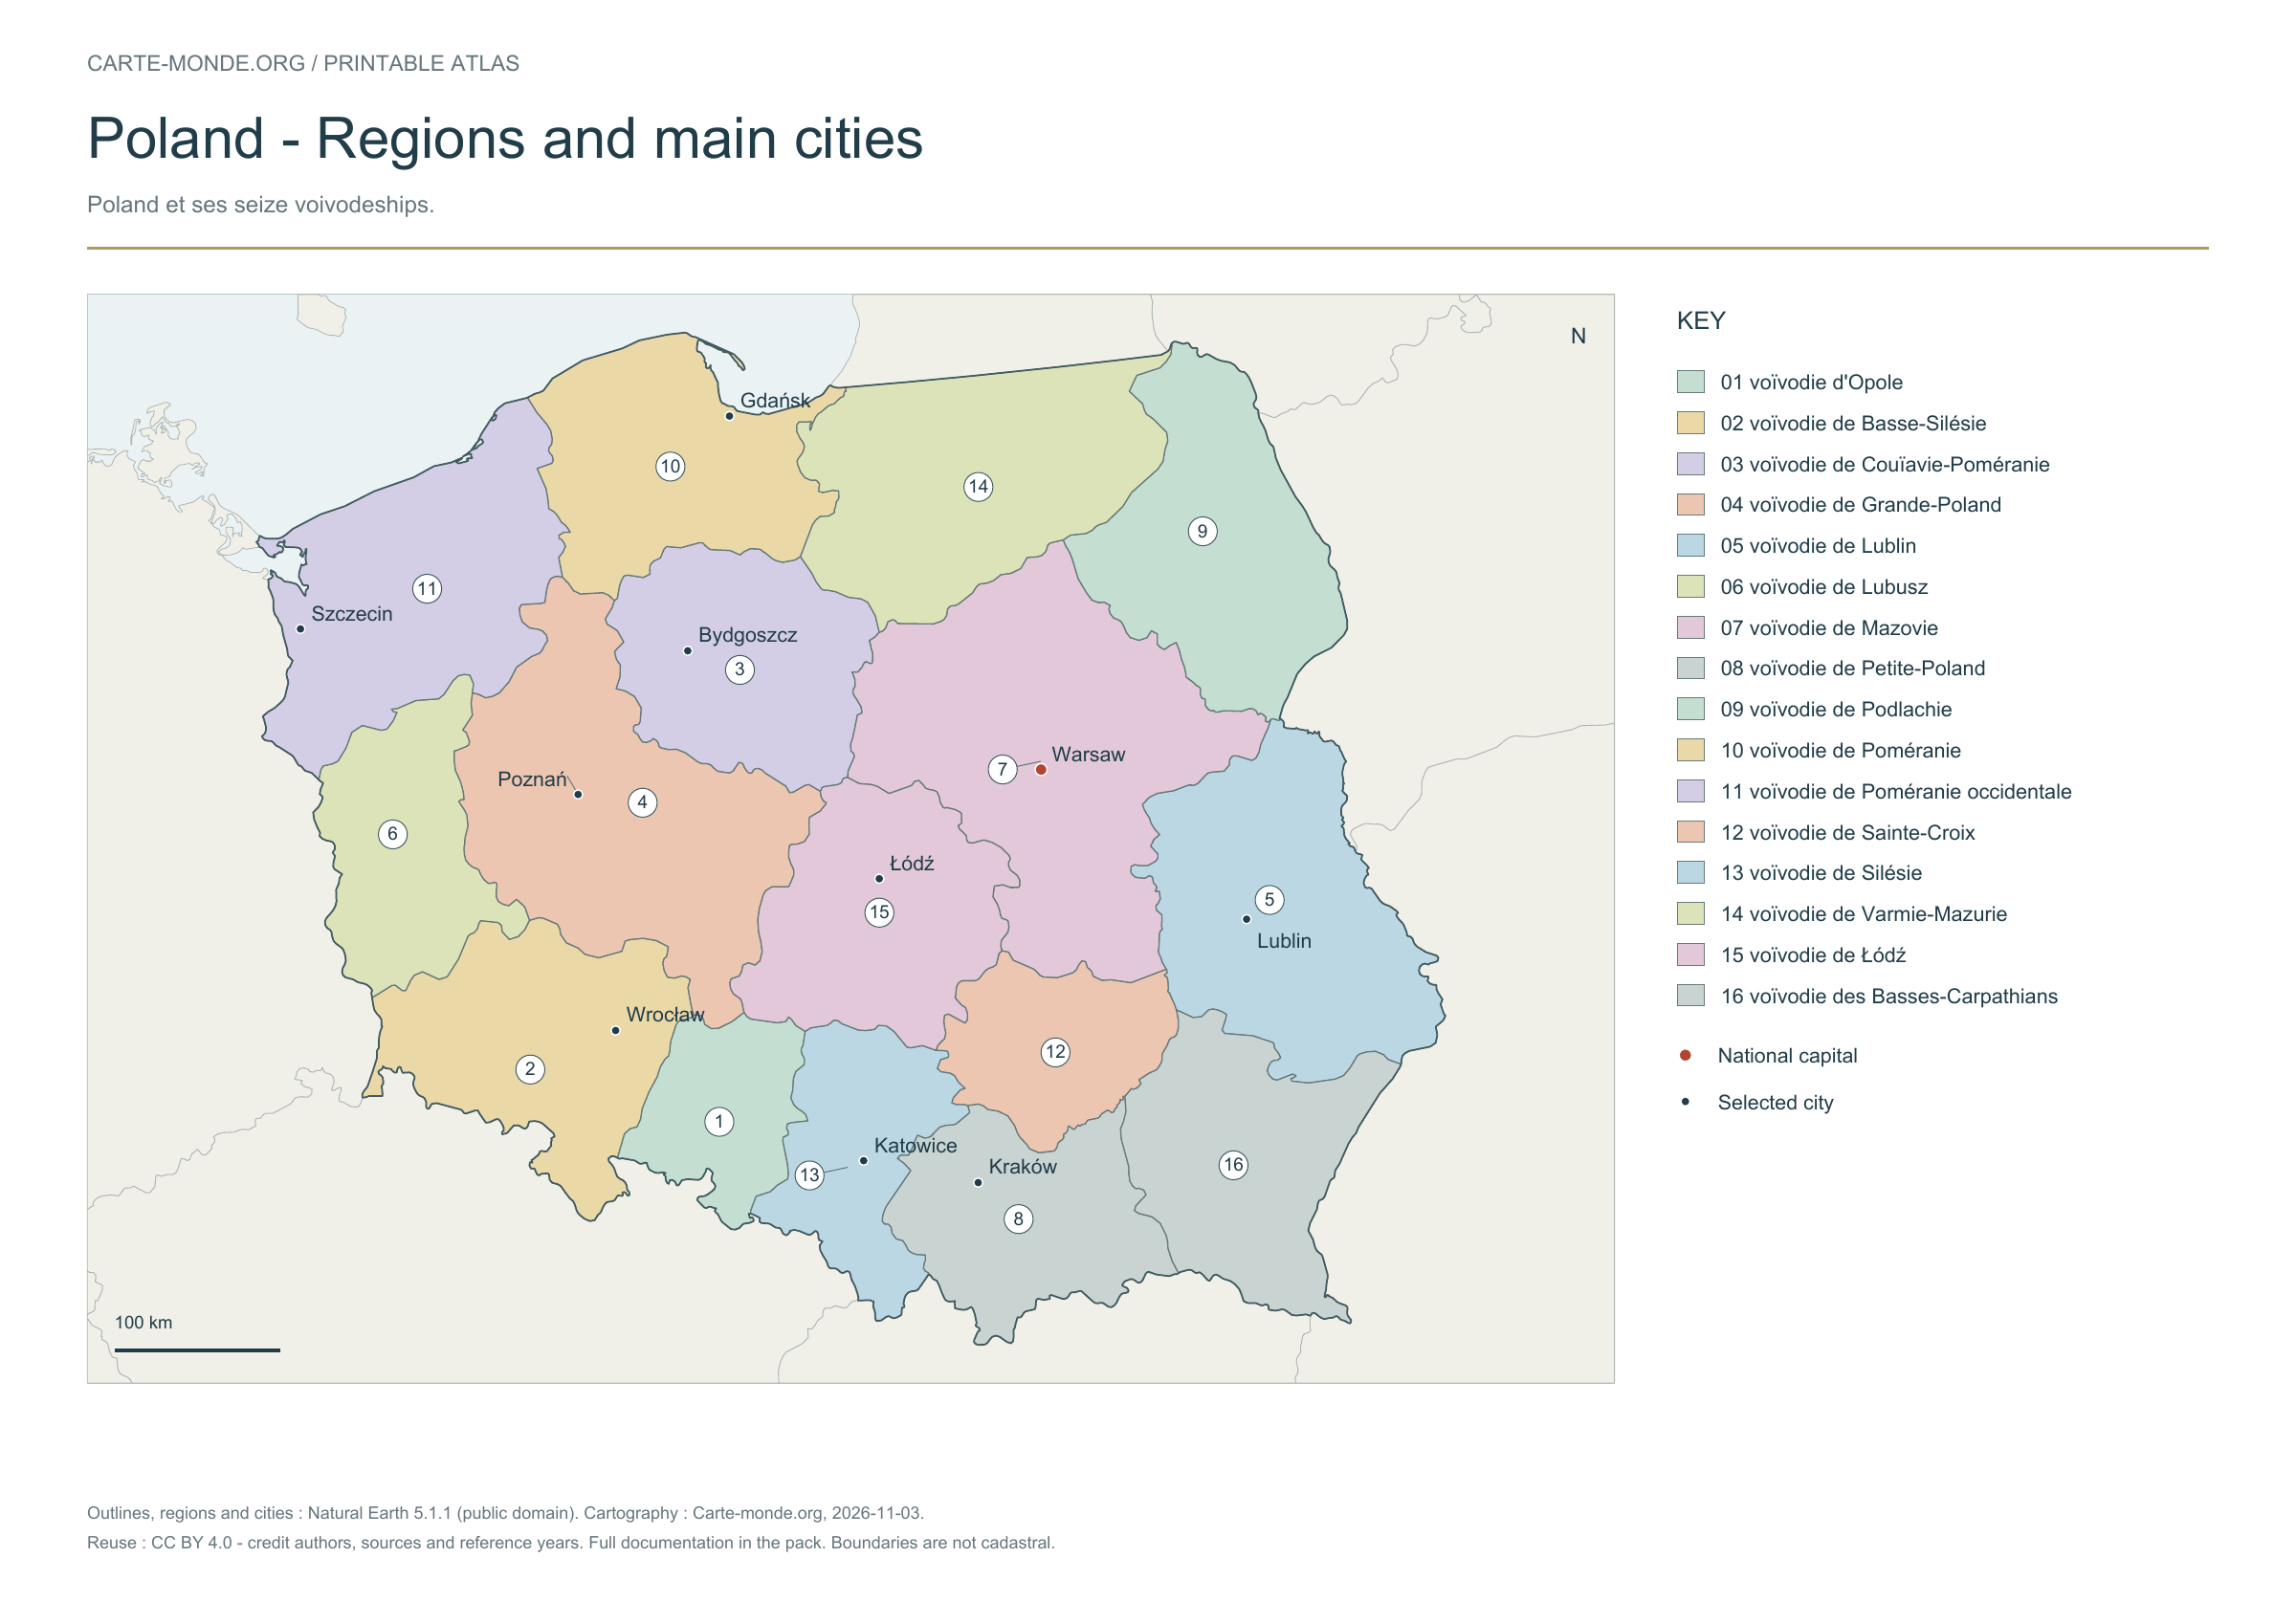
Regions and main cities — Poland

Carte-monde.org · November 2026

Regions and main cities

The 16 voivodeships are numbered and named in the legend, with a selection of cities and the capital.

A4 landscape PDF · PNG 2 400 px · CC BY 4.0

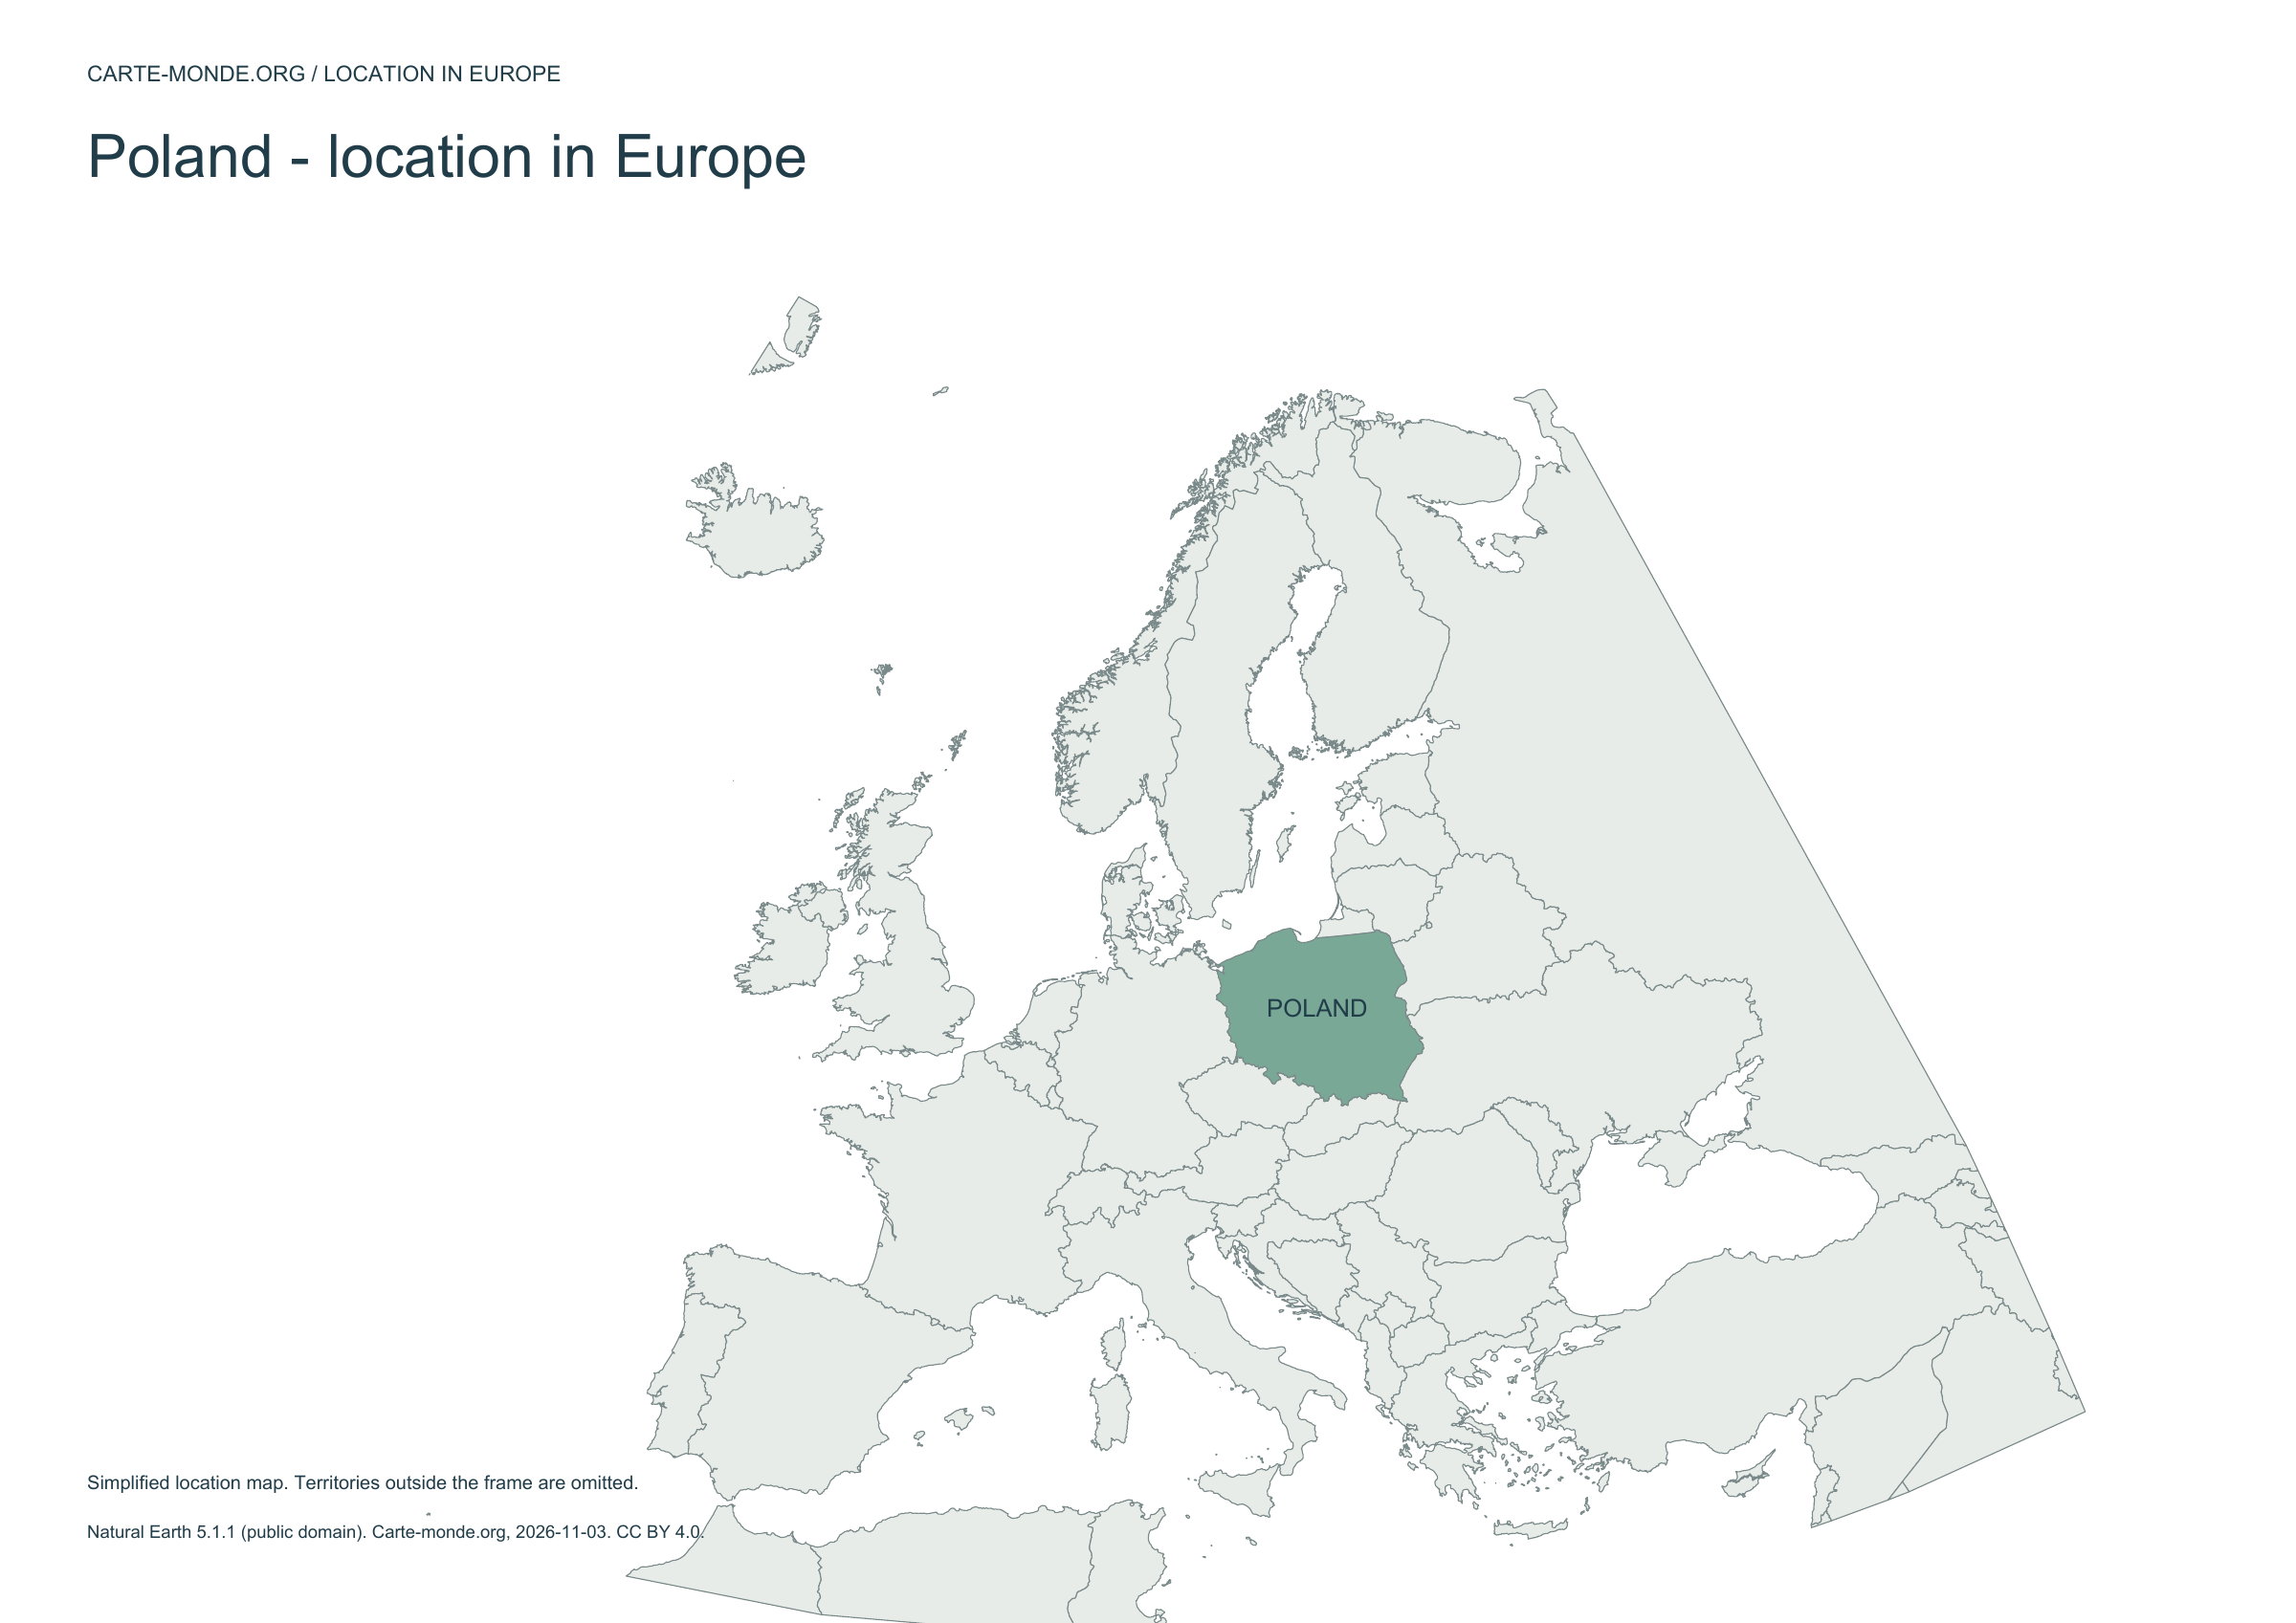
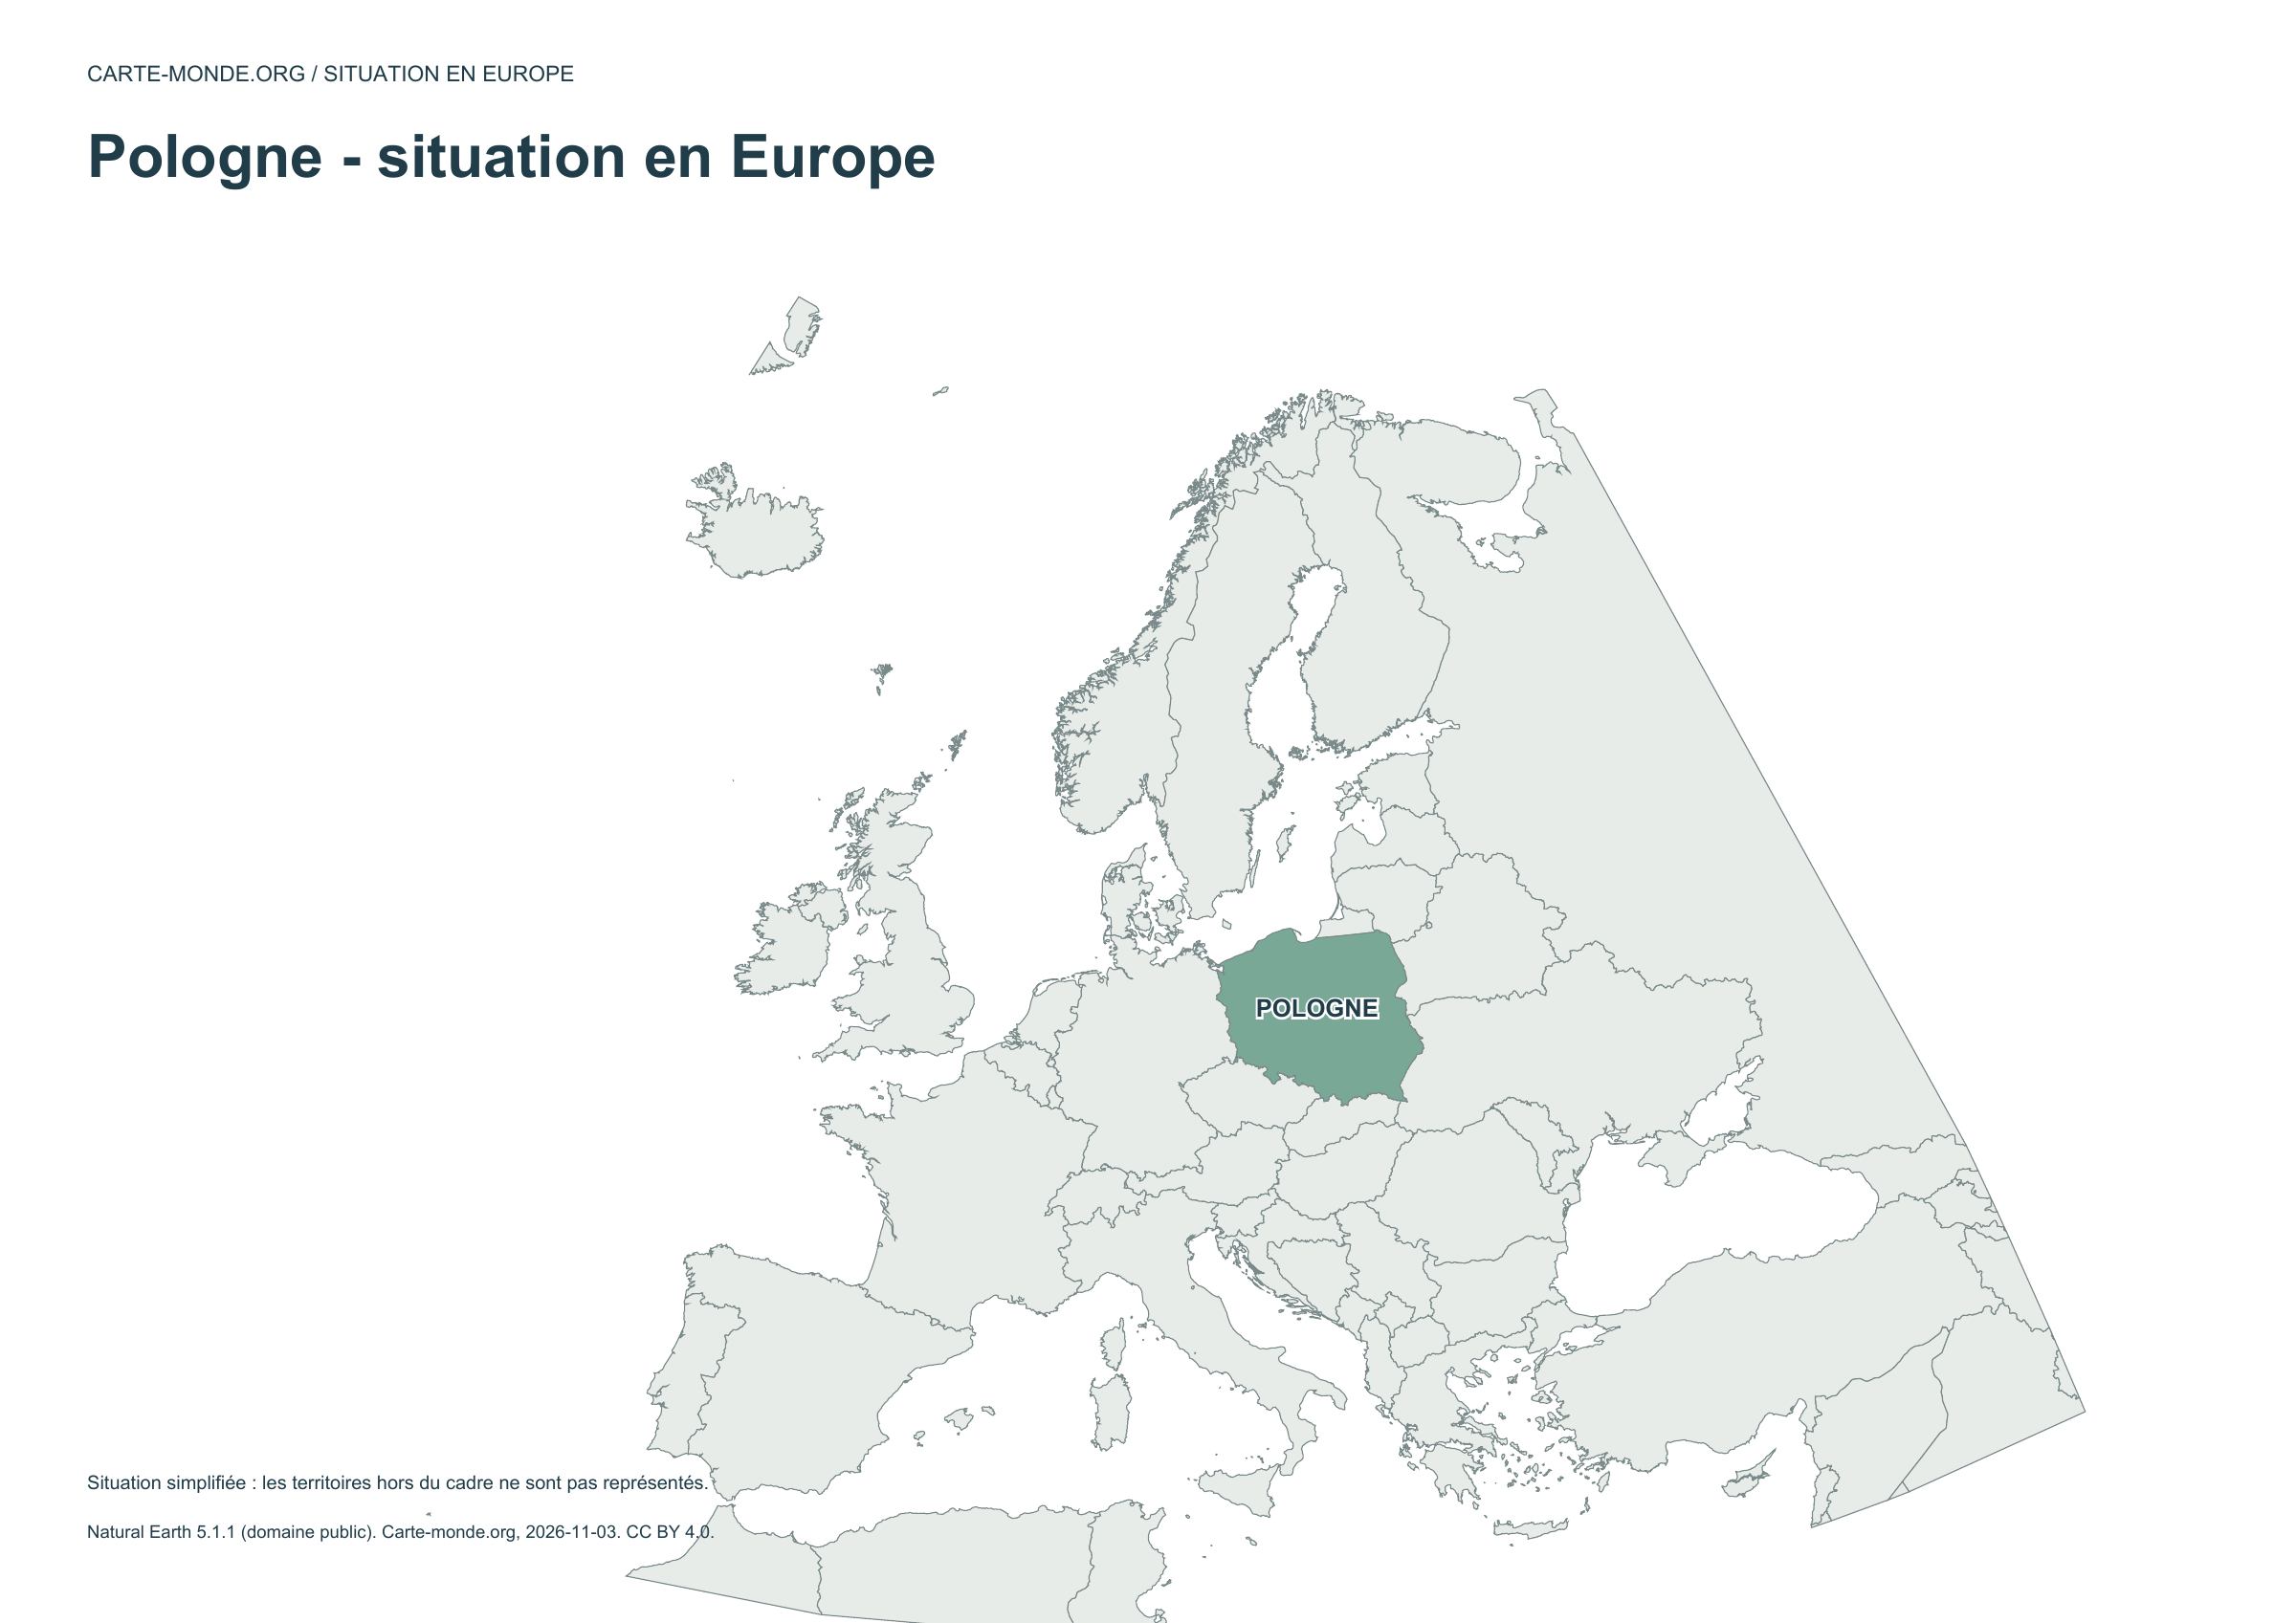
Location in Europe — Poland

Carte-monde.org · November 2026

Location in Europe

The country is highlighted within a simplified European frame; territories outside this frame are not shown.

A4 landscape PDF · PNG 2 400 px · CC BY 4.0

Two maps to understand the relief

Choose shaded relief for an overview, or elevation classes for school use.

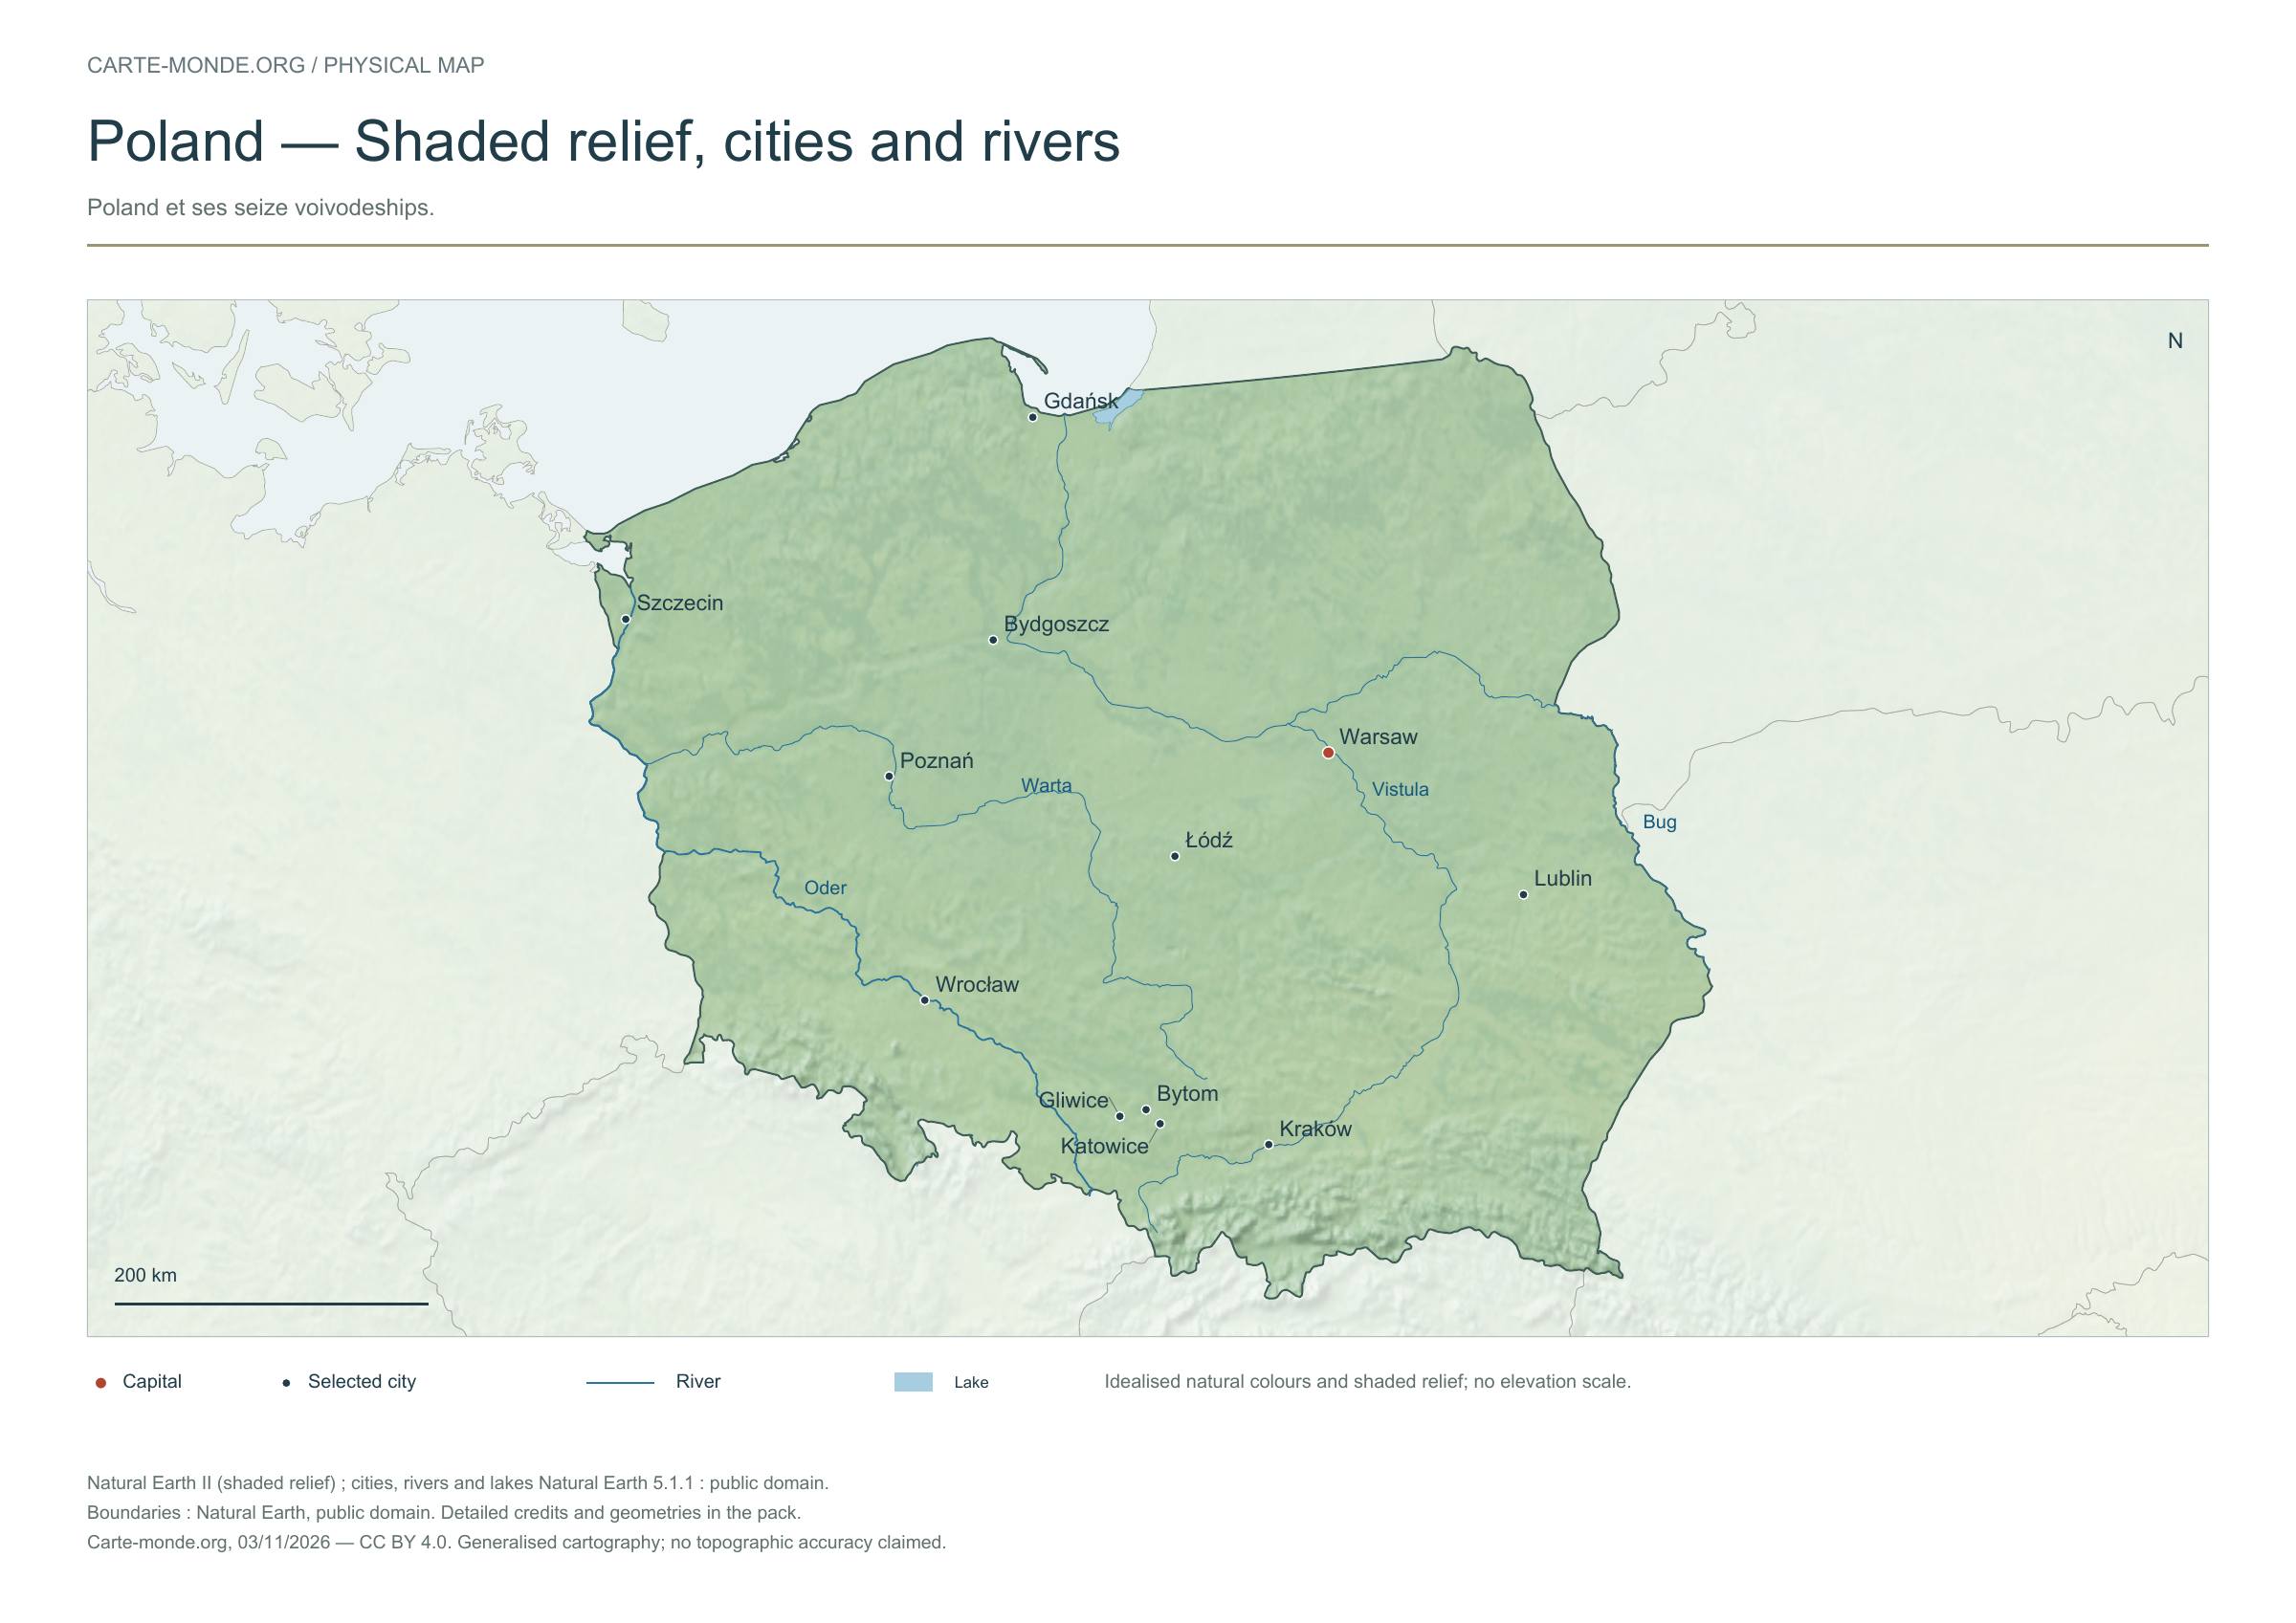
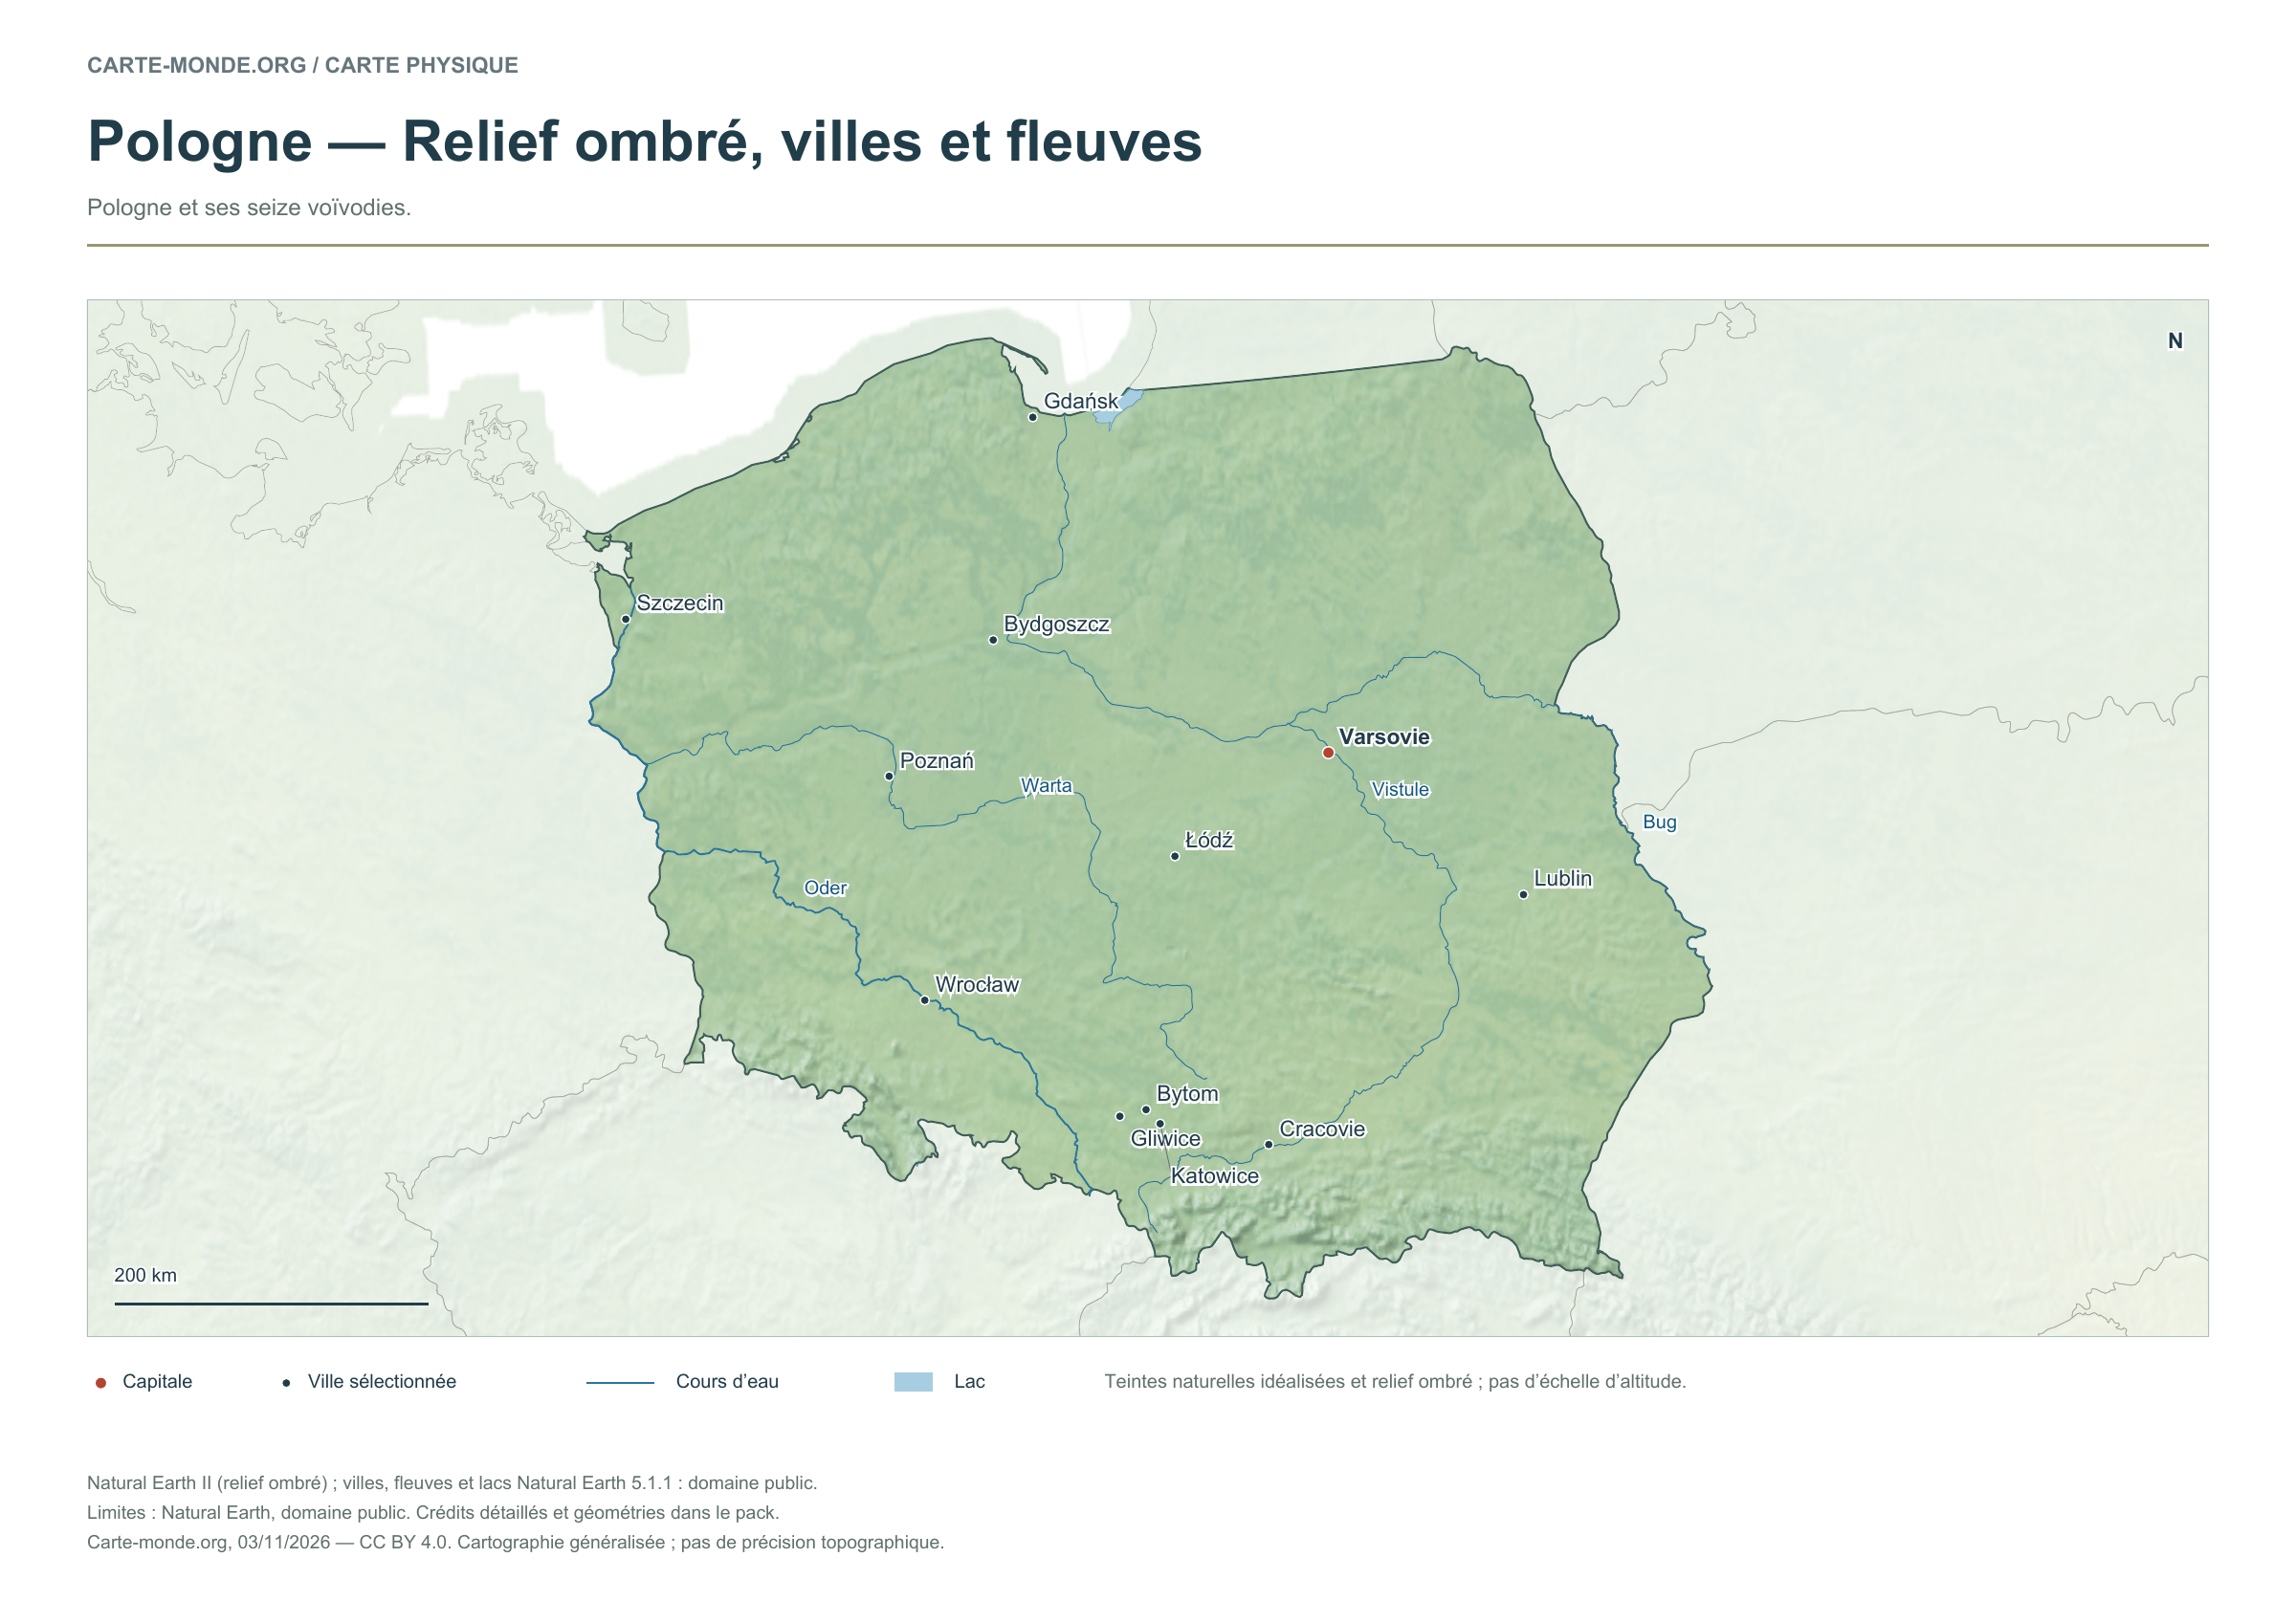
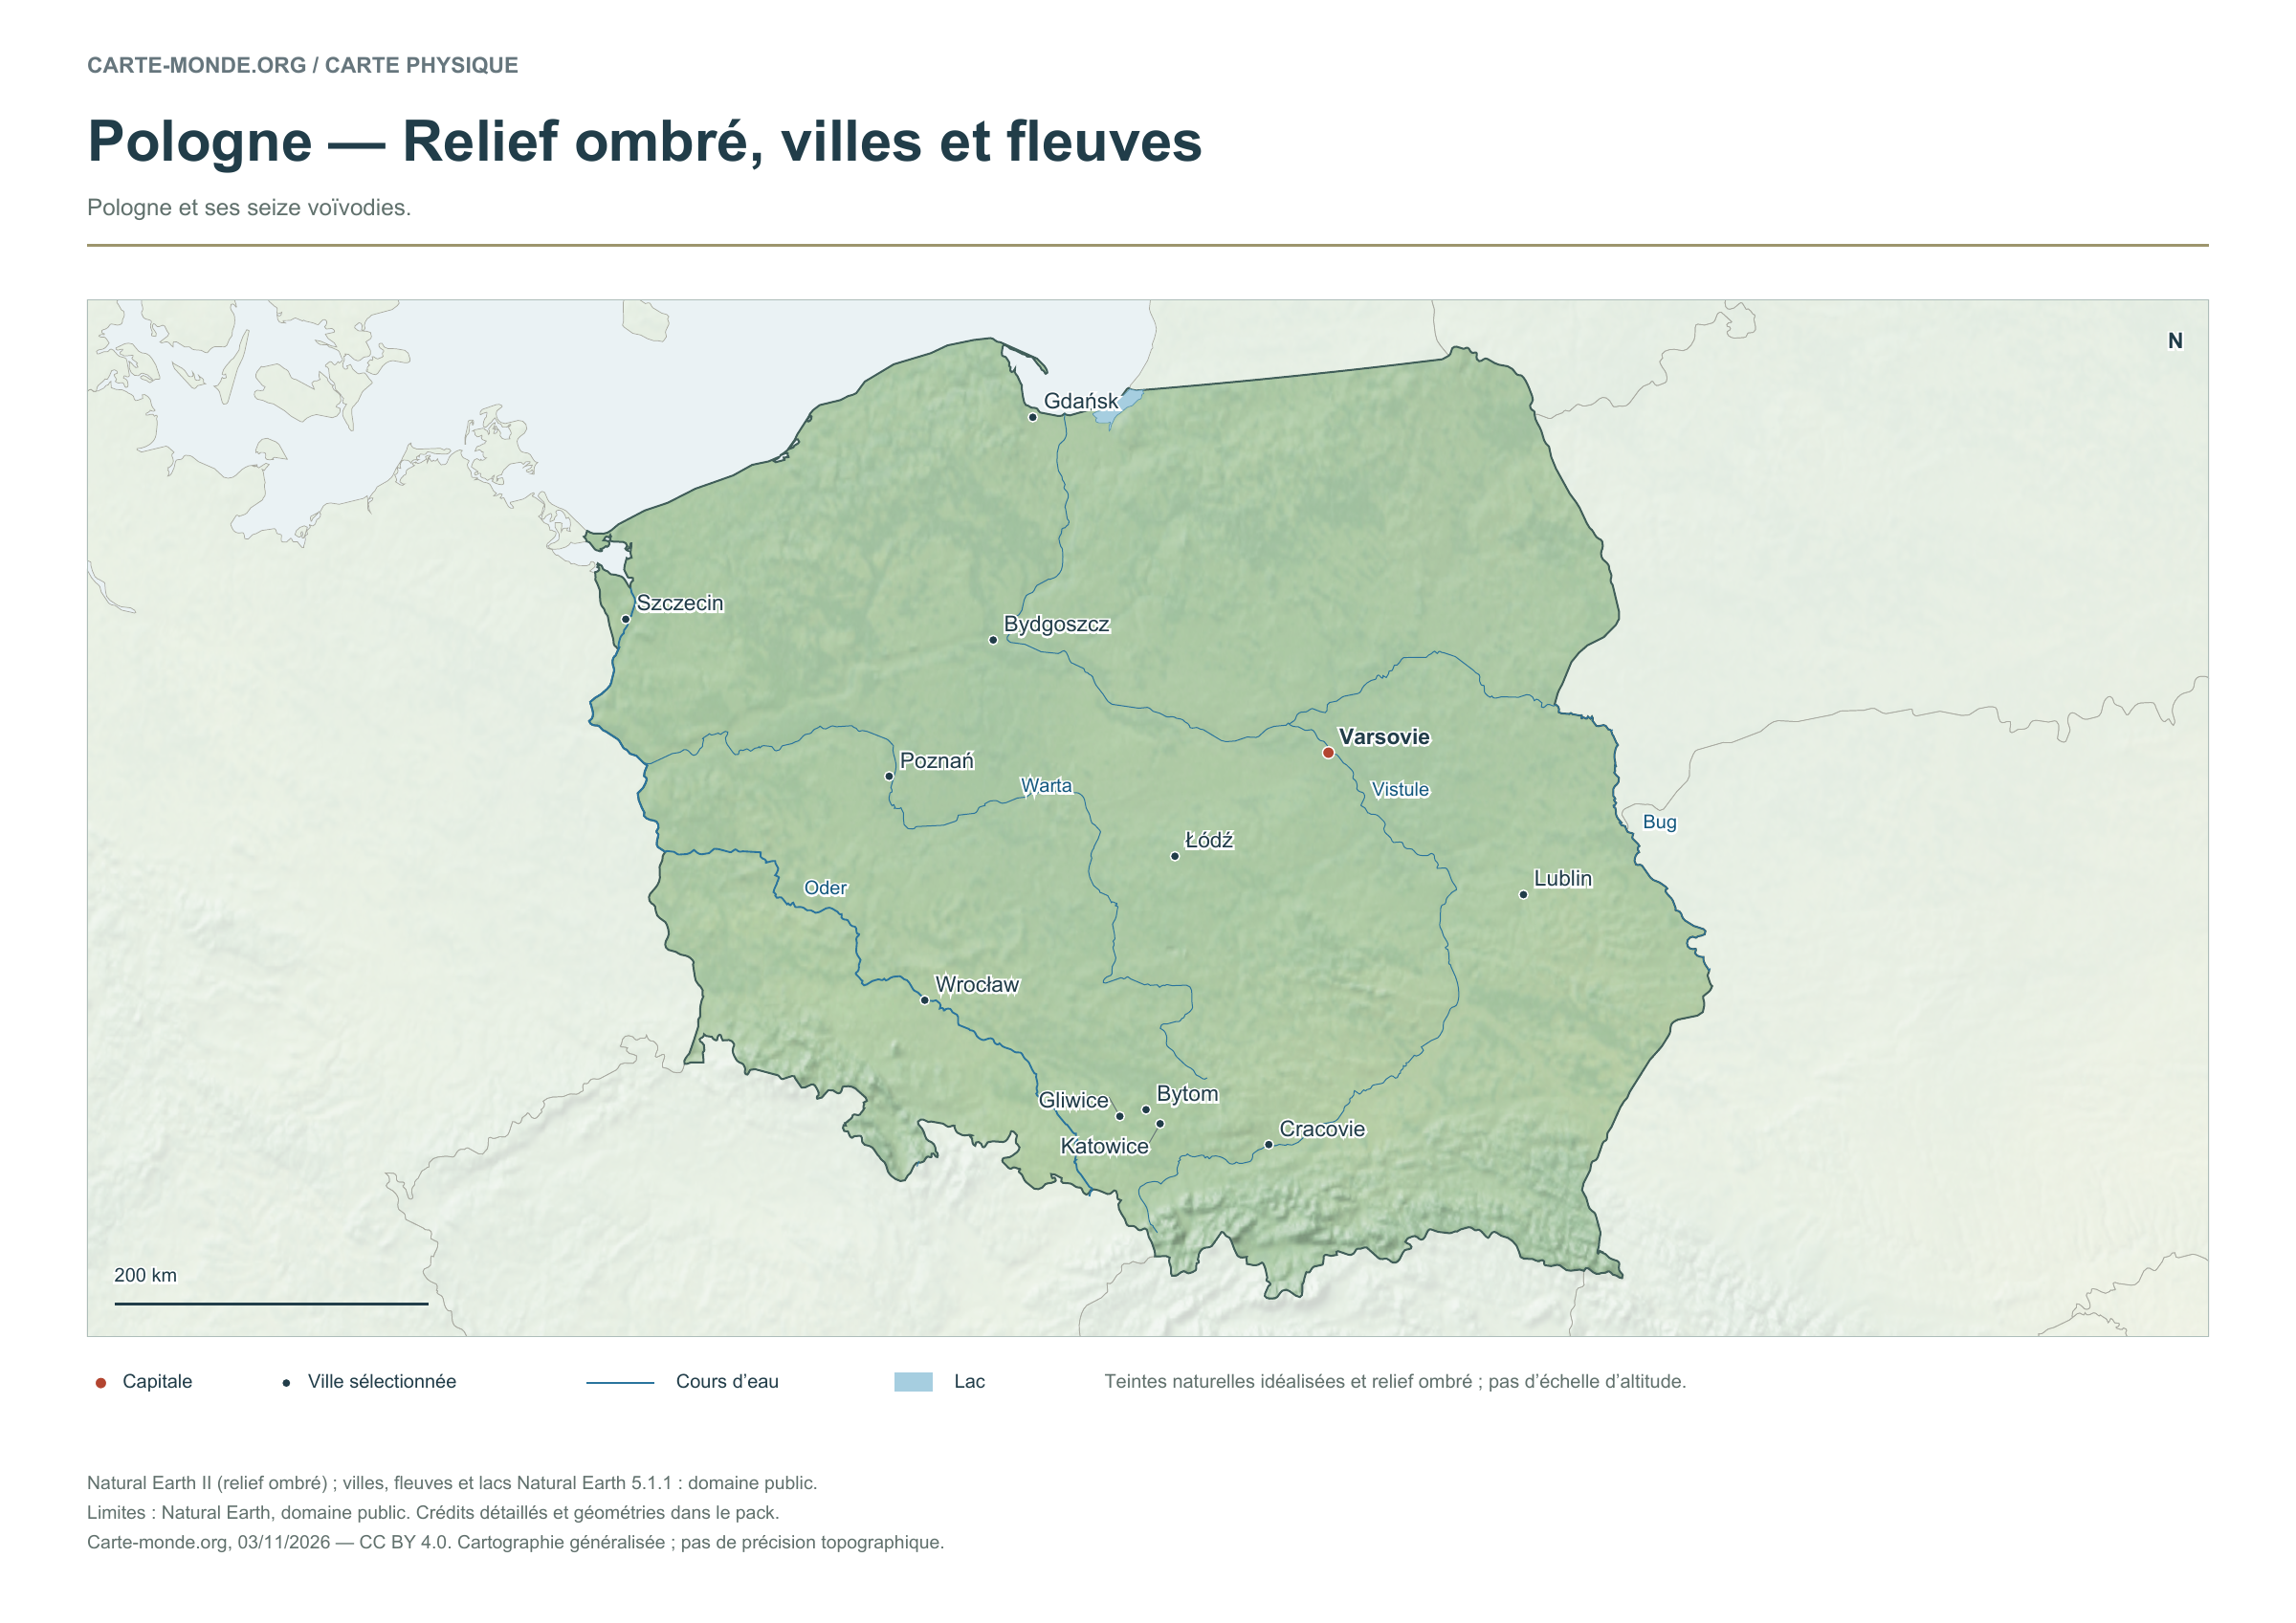
Poland — Shaded relief, cities and rivers

Carte-monde.org · November 2026

Shaded relief, cities and rivers

To identify major landforms, cities and the river network. The natural colours are not an elevation scale.

Raster base map, cities, rivers and lakes: Natural Earth, public domain. Other boundary credits and licences are retained in the pack. Cartographic work CC BY 4.0; ODbL-derived data retains its licence. No topographic accuracy is claimed.

Territory, data and selection of names

Poland and its sixteen voivodeships.

Natural Earth II shaded relief background, 12 selected cities. Named waterways: Bug, Oder, Vistule, Warta.

The colours represent idealised natural cover; they do not correspond to elevation classes. This global background remains generalised, particularly for small states.

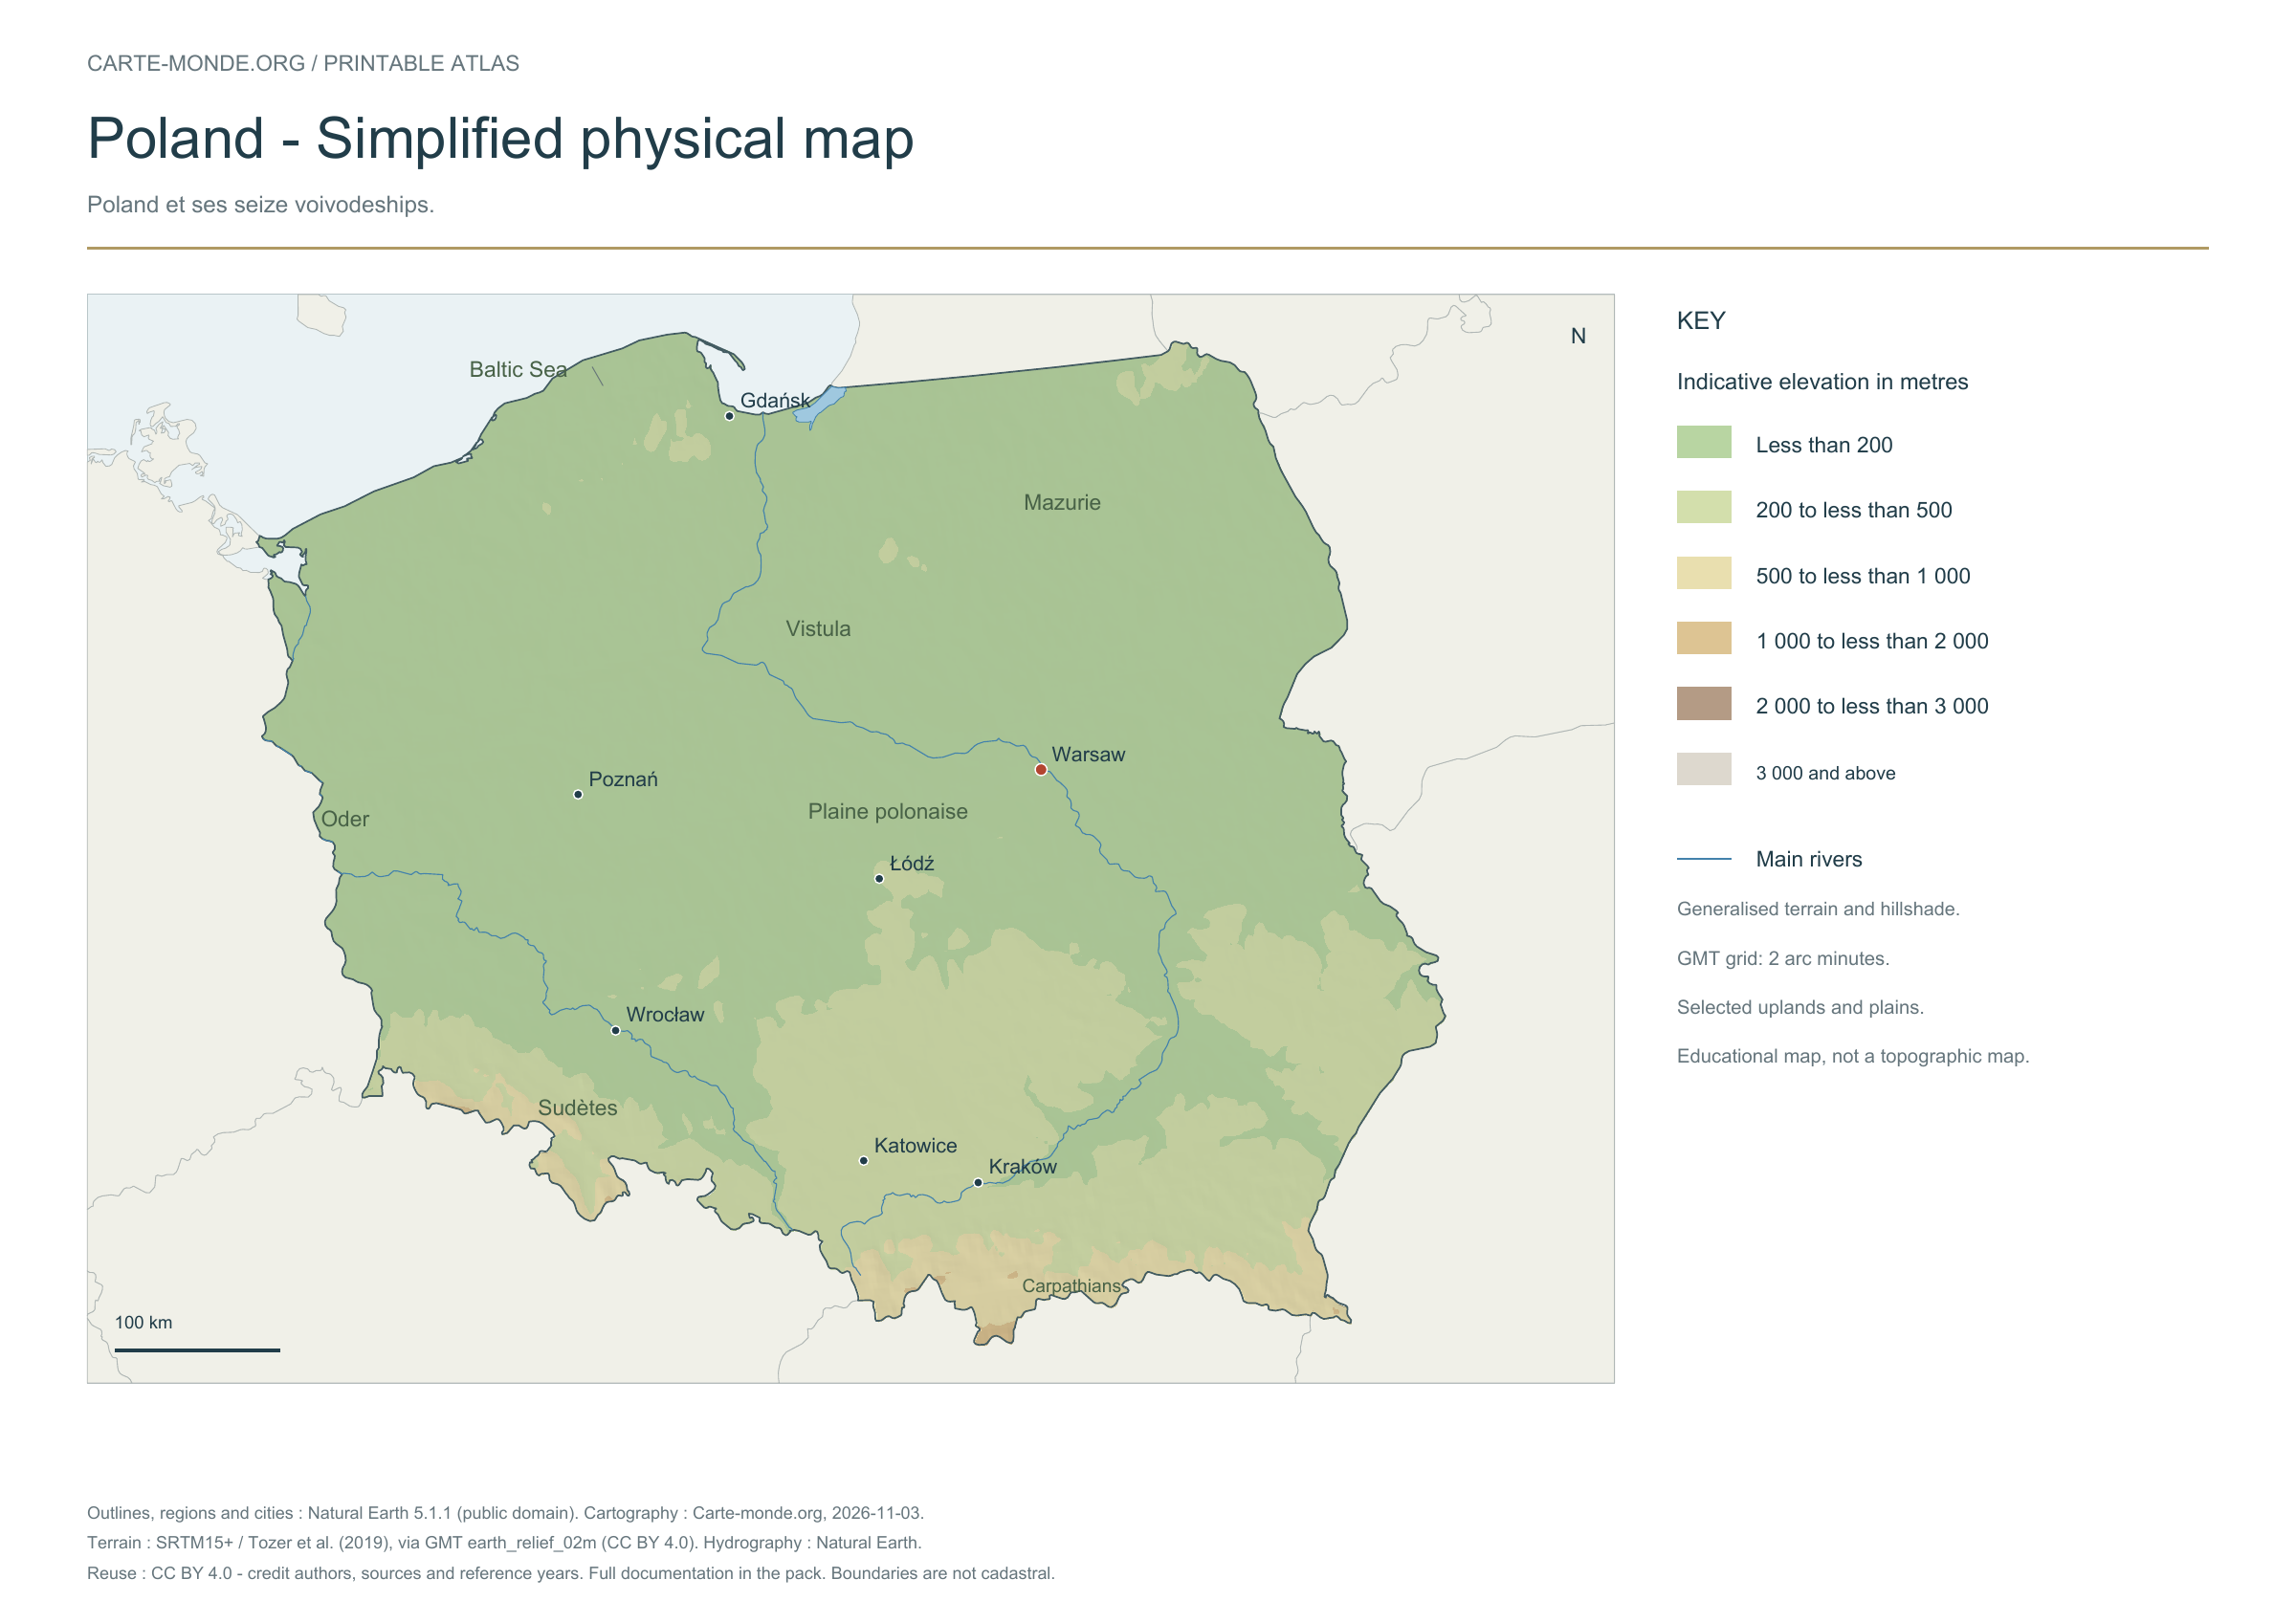
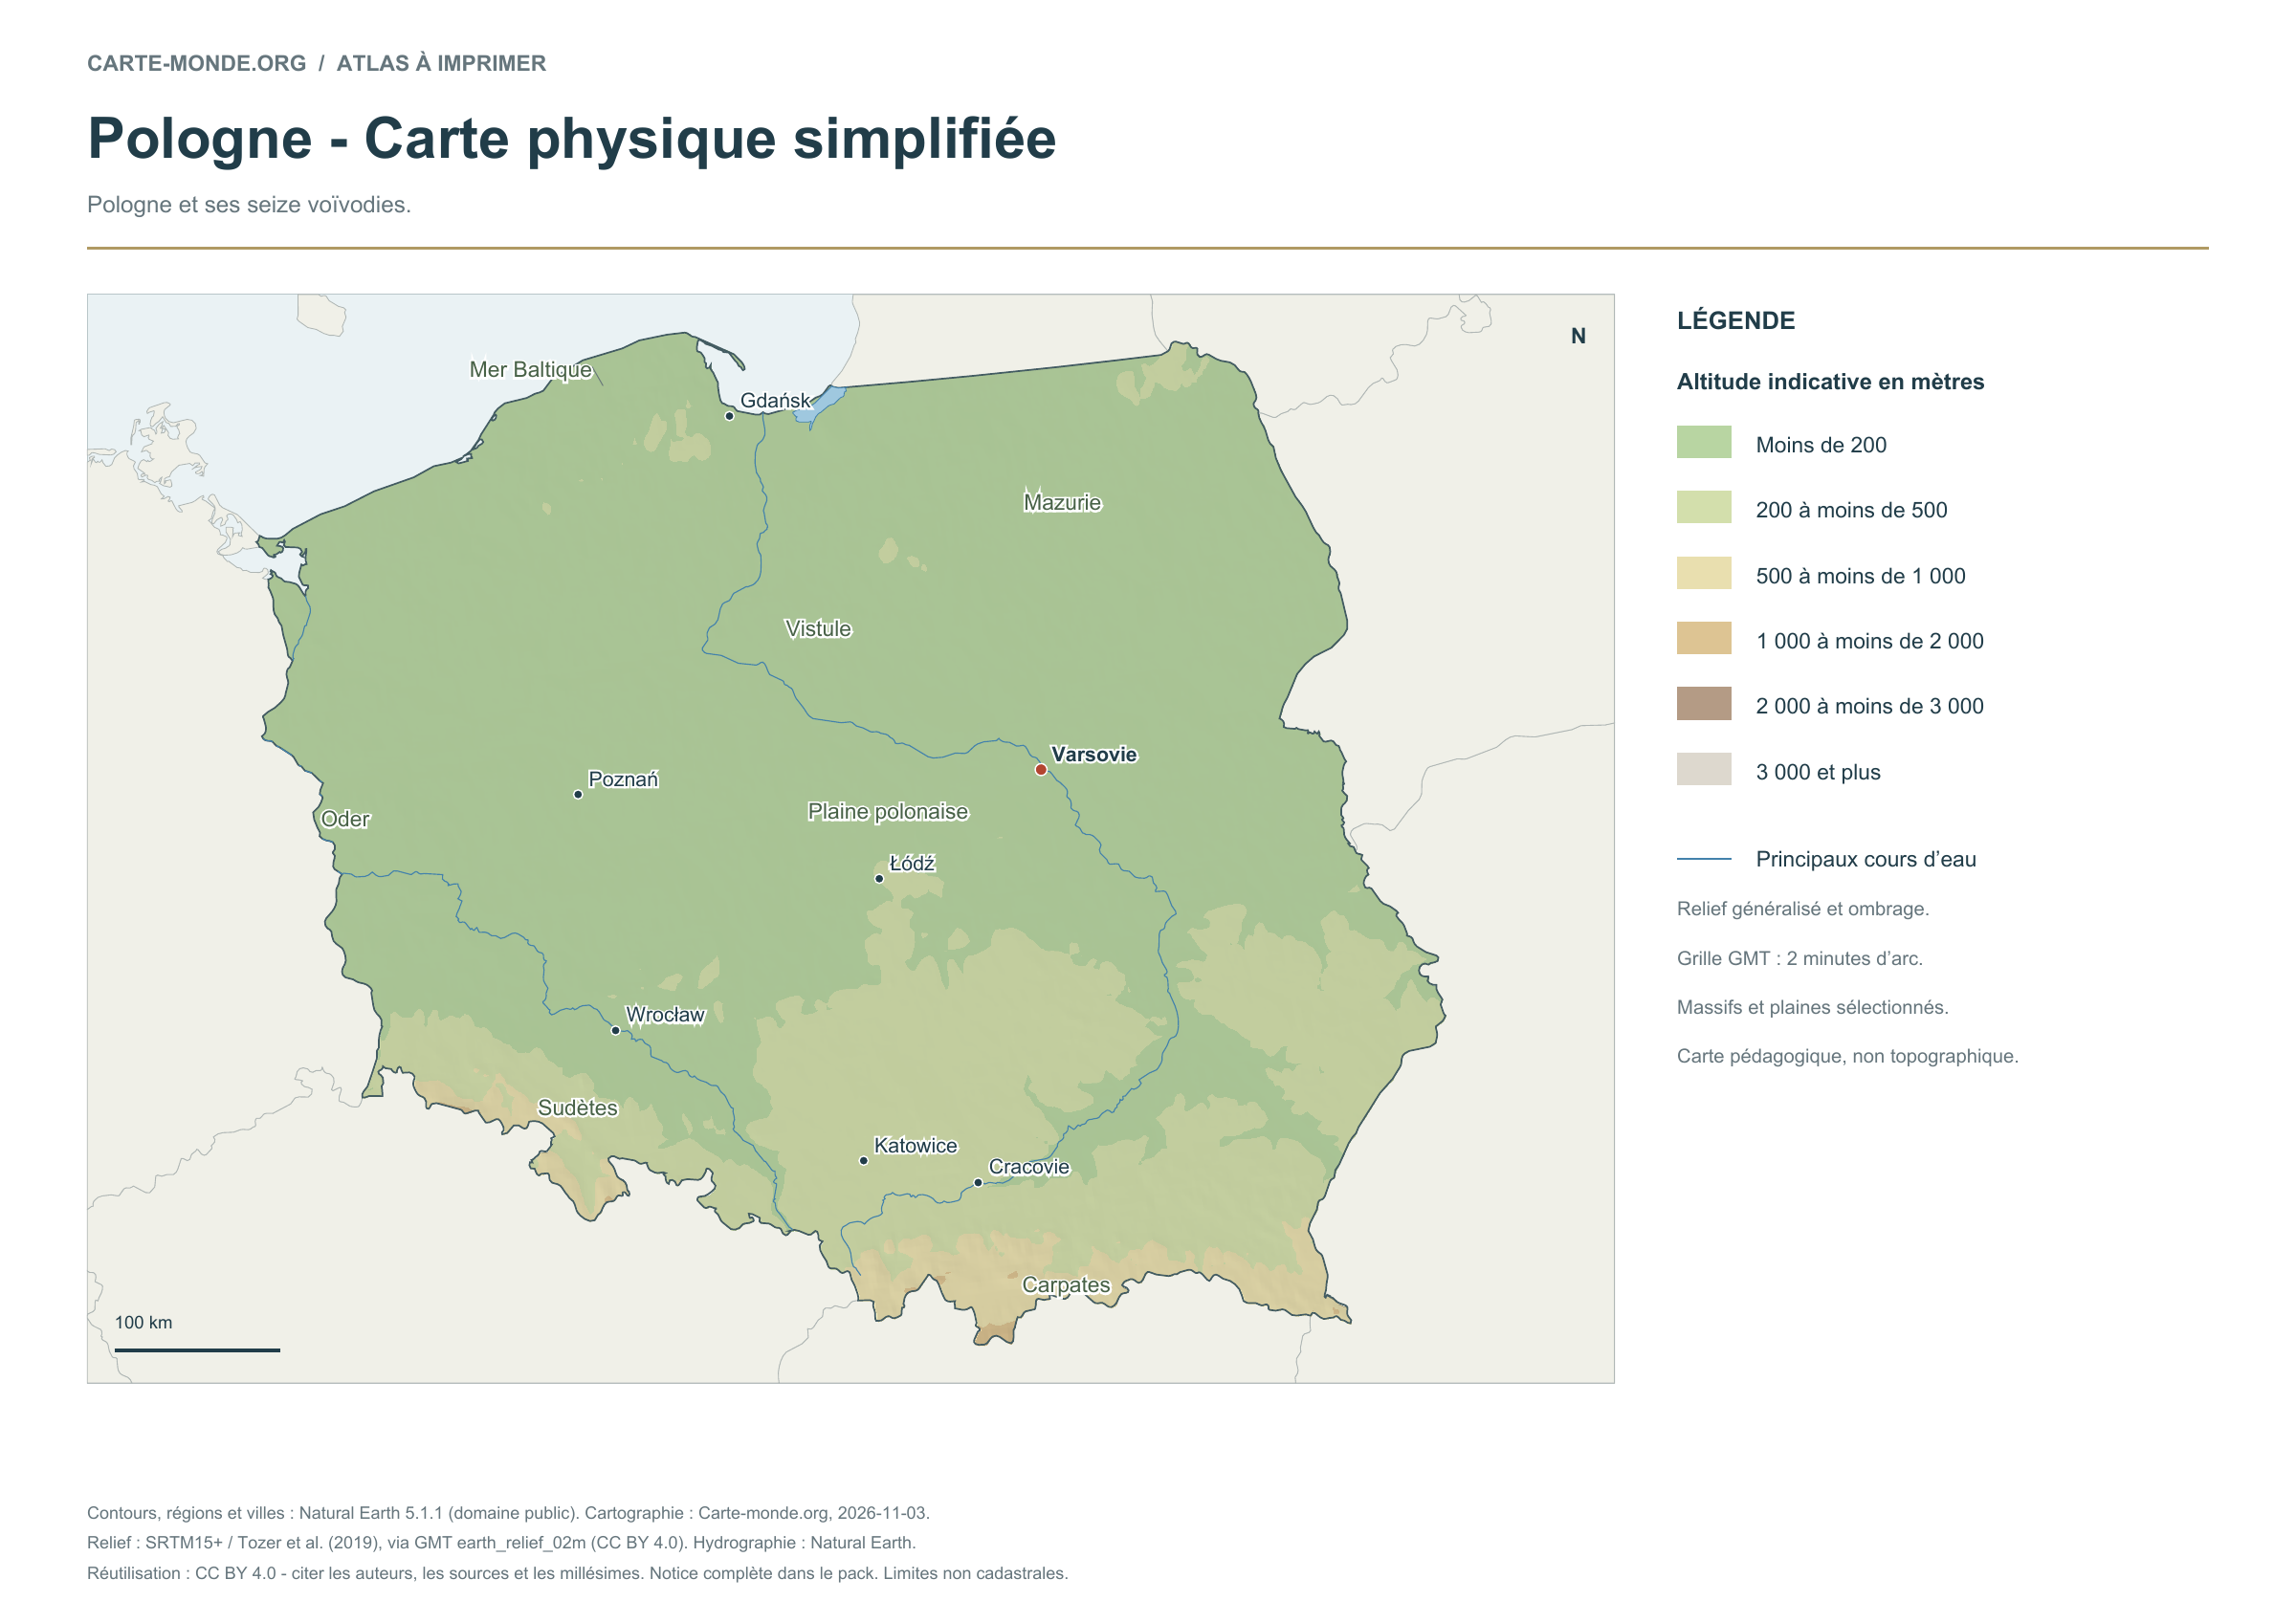
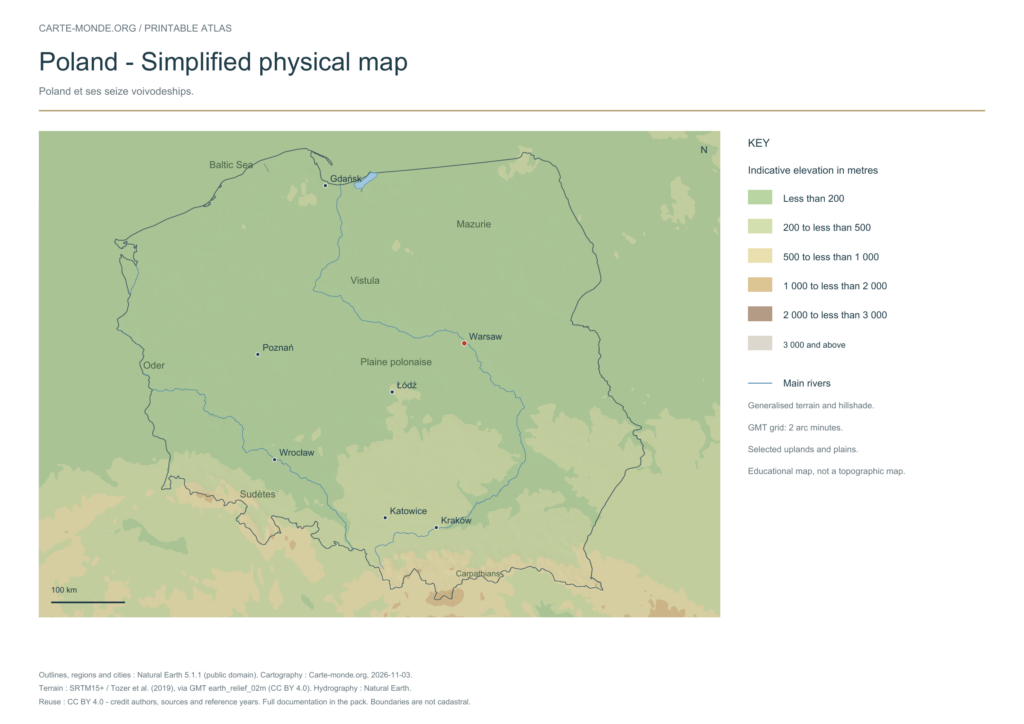
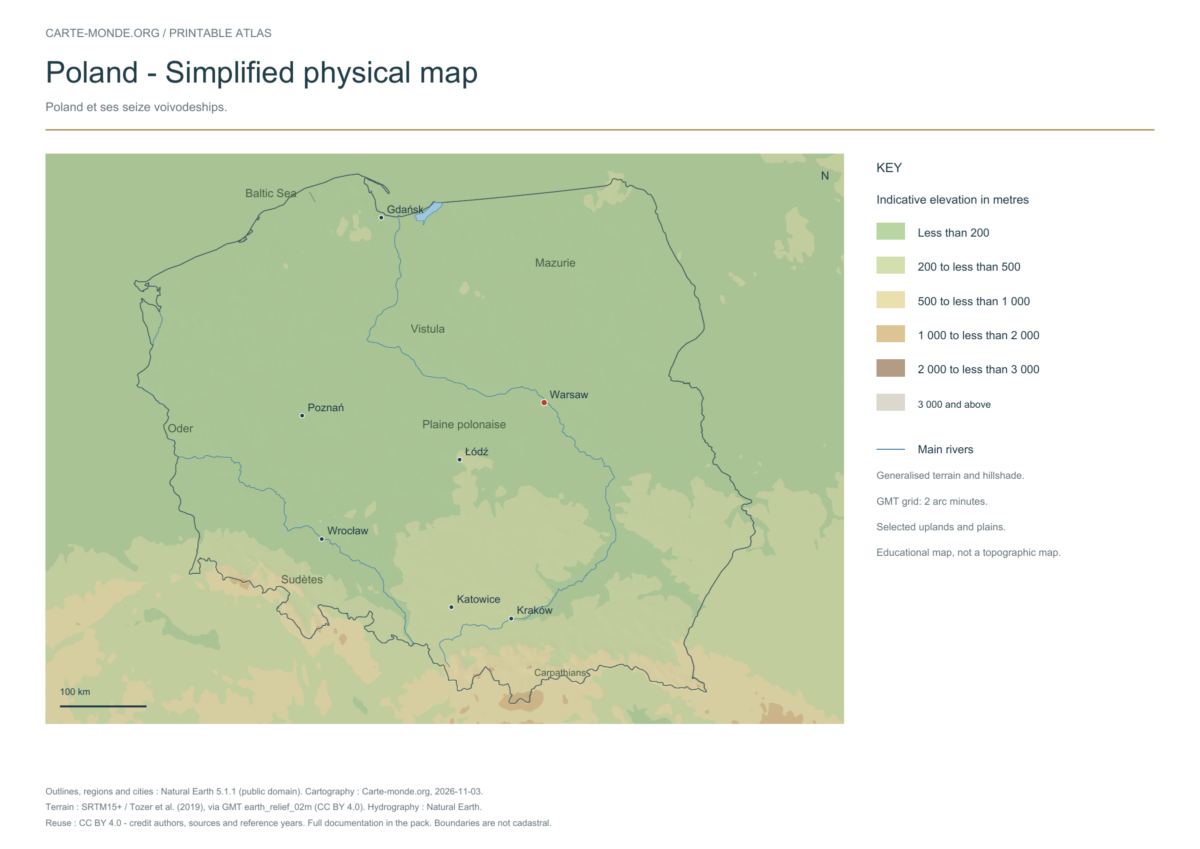
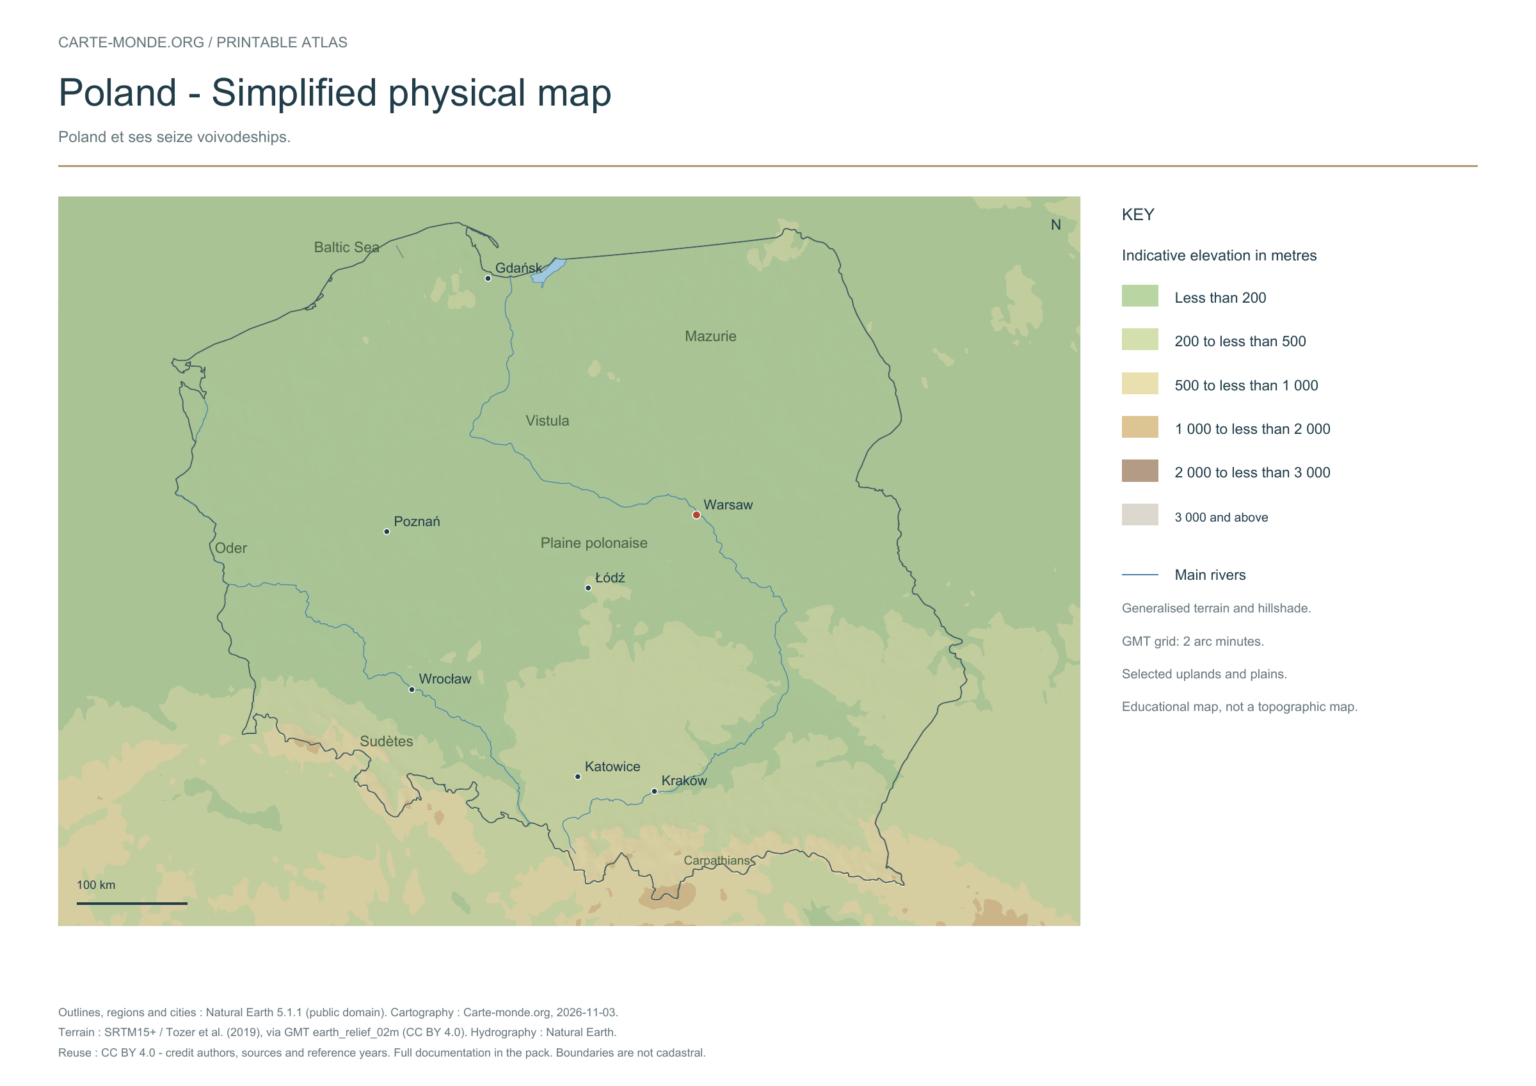
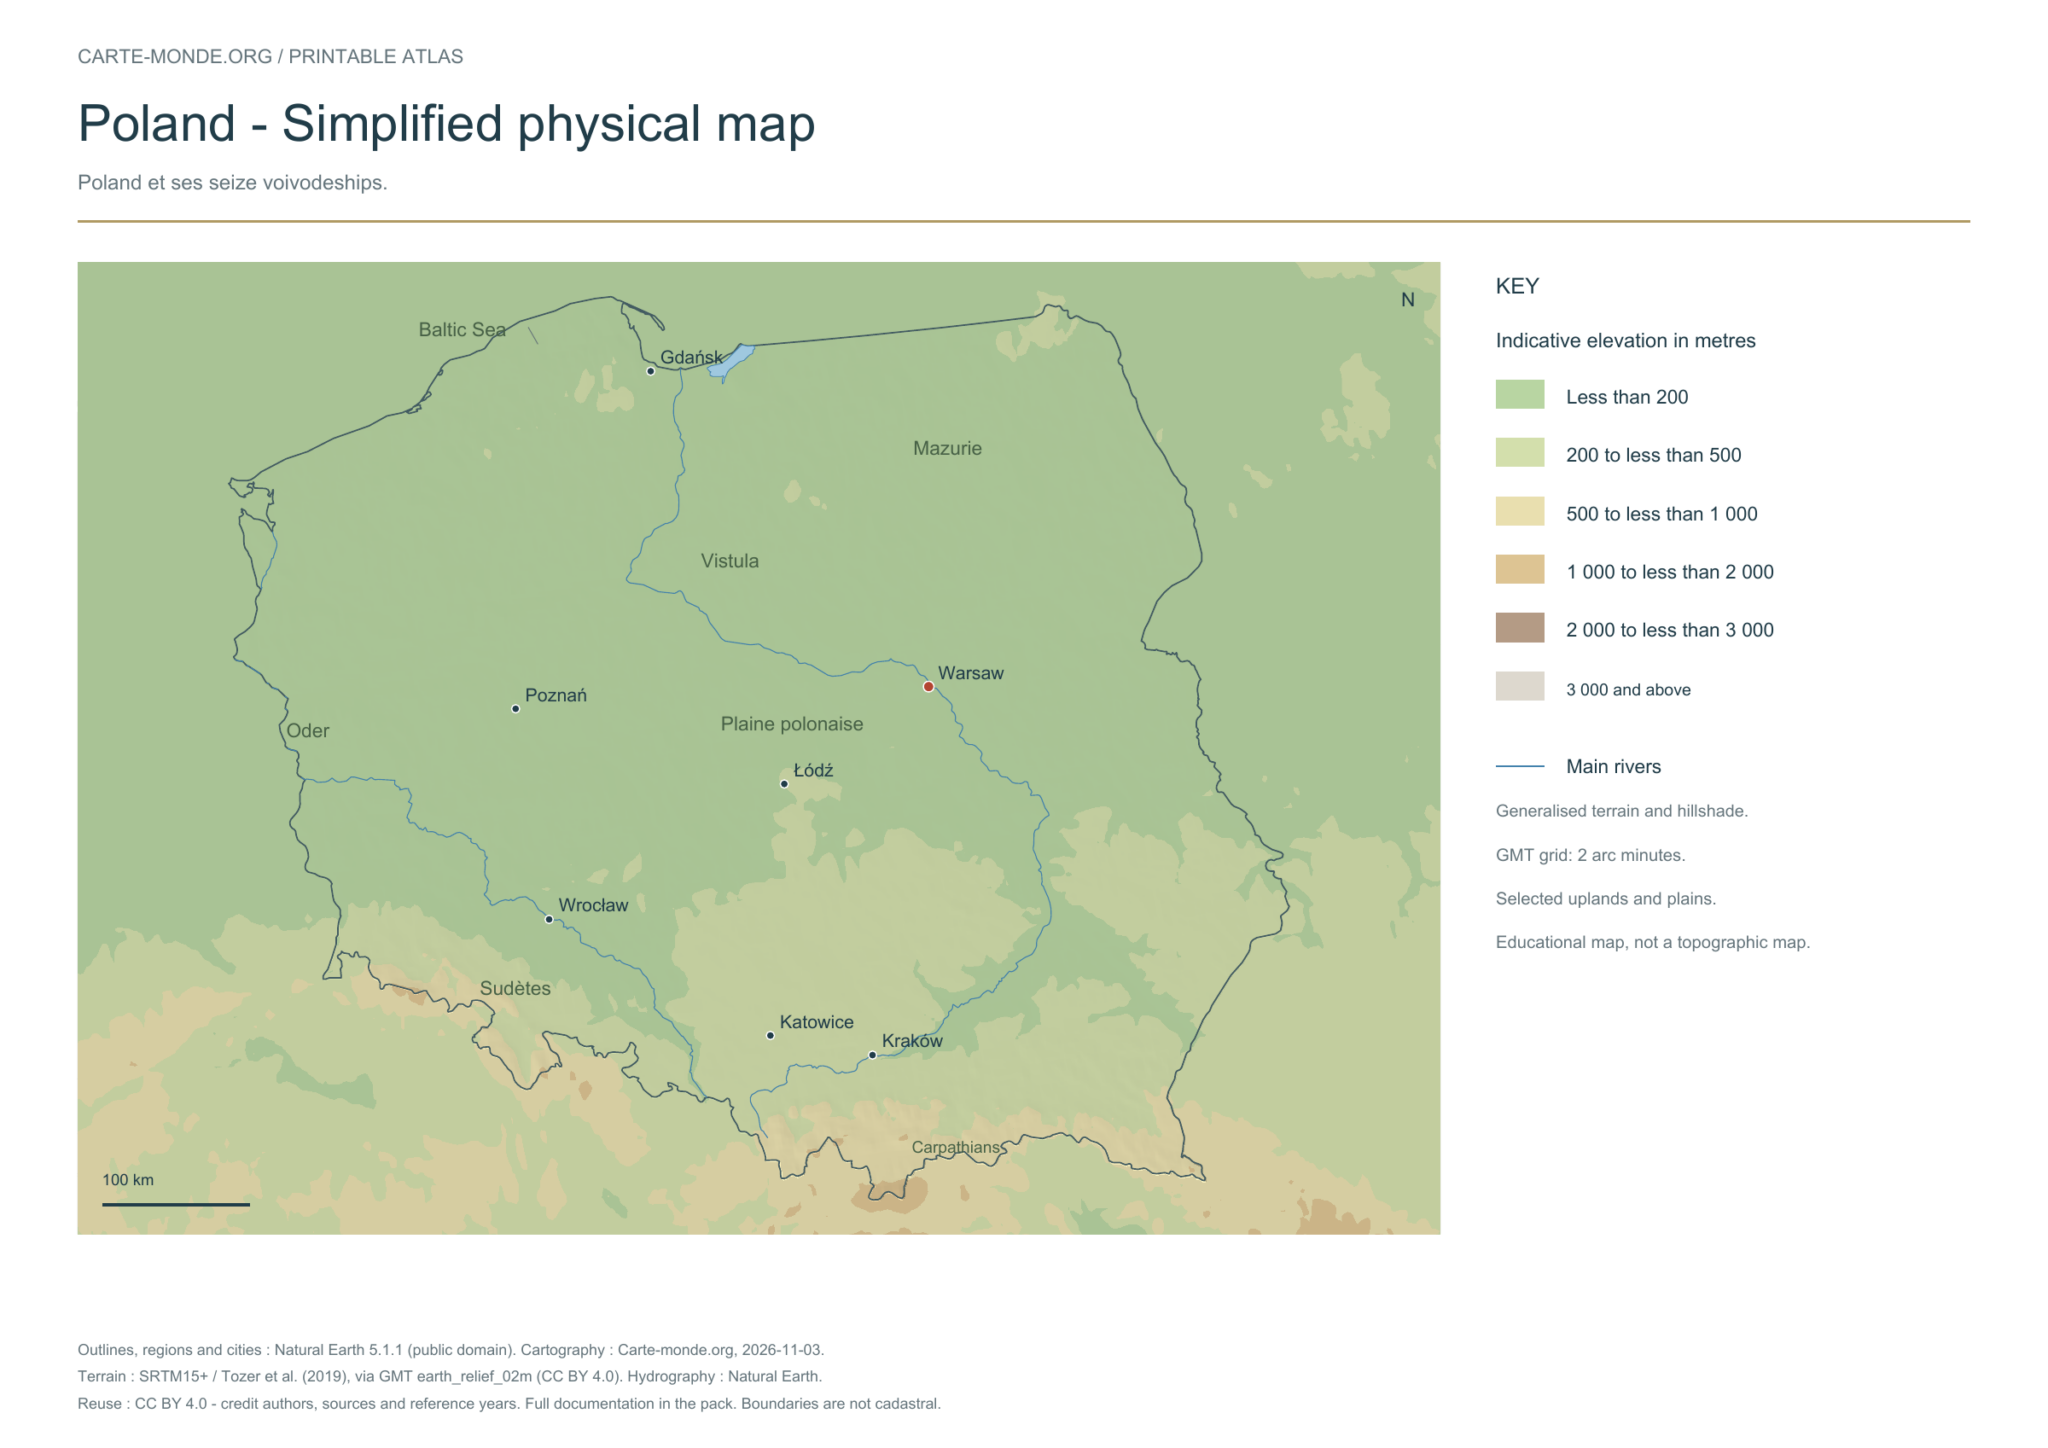
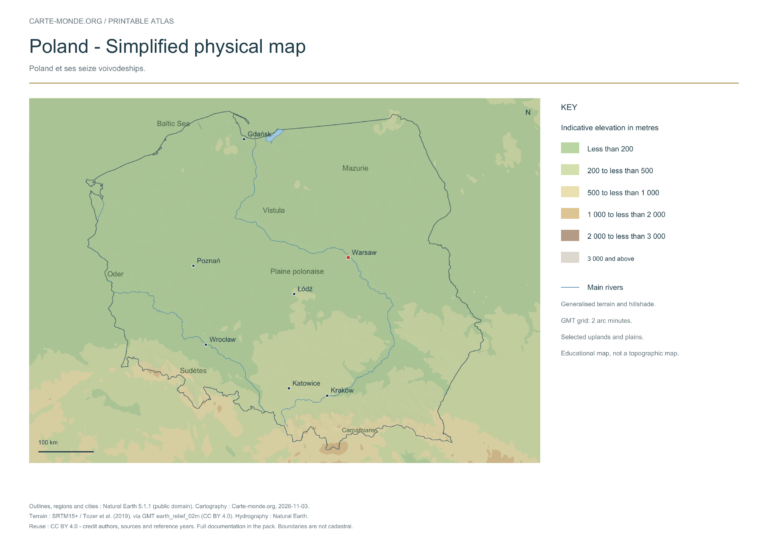
Simplified physical map — Poland

Carte-monde.org · November 2026

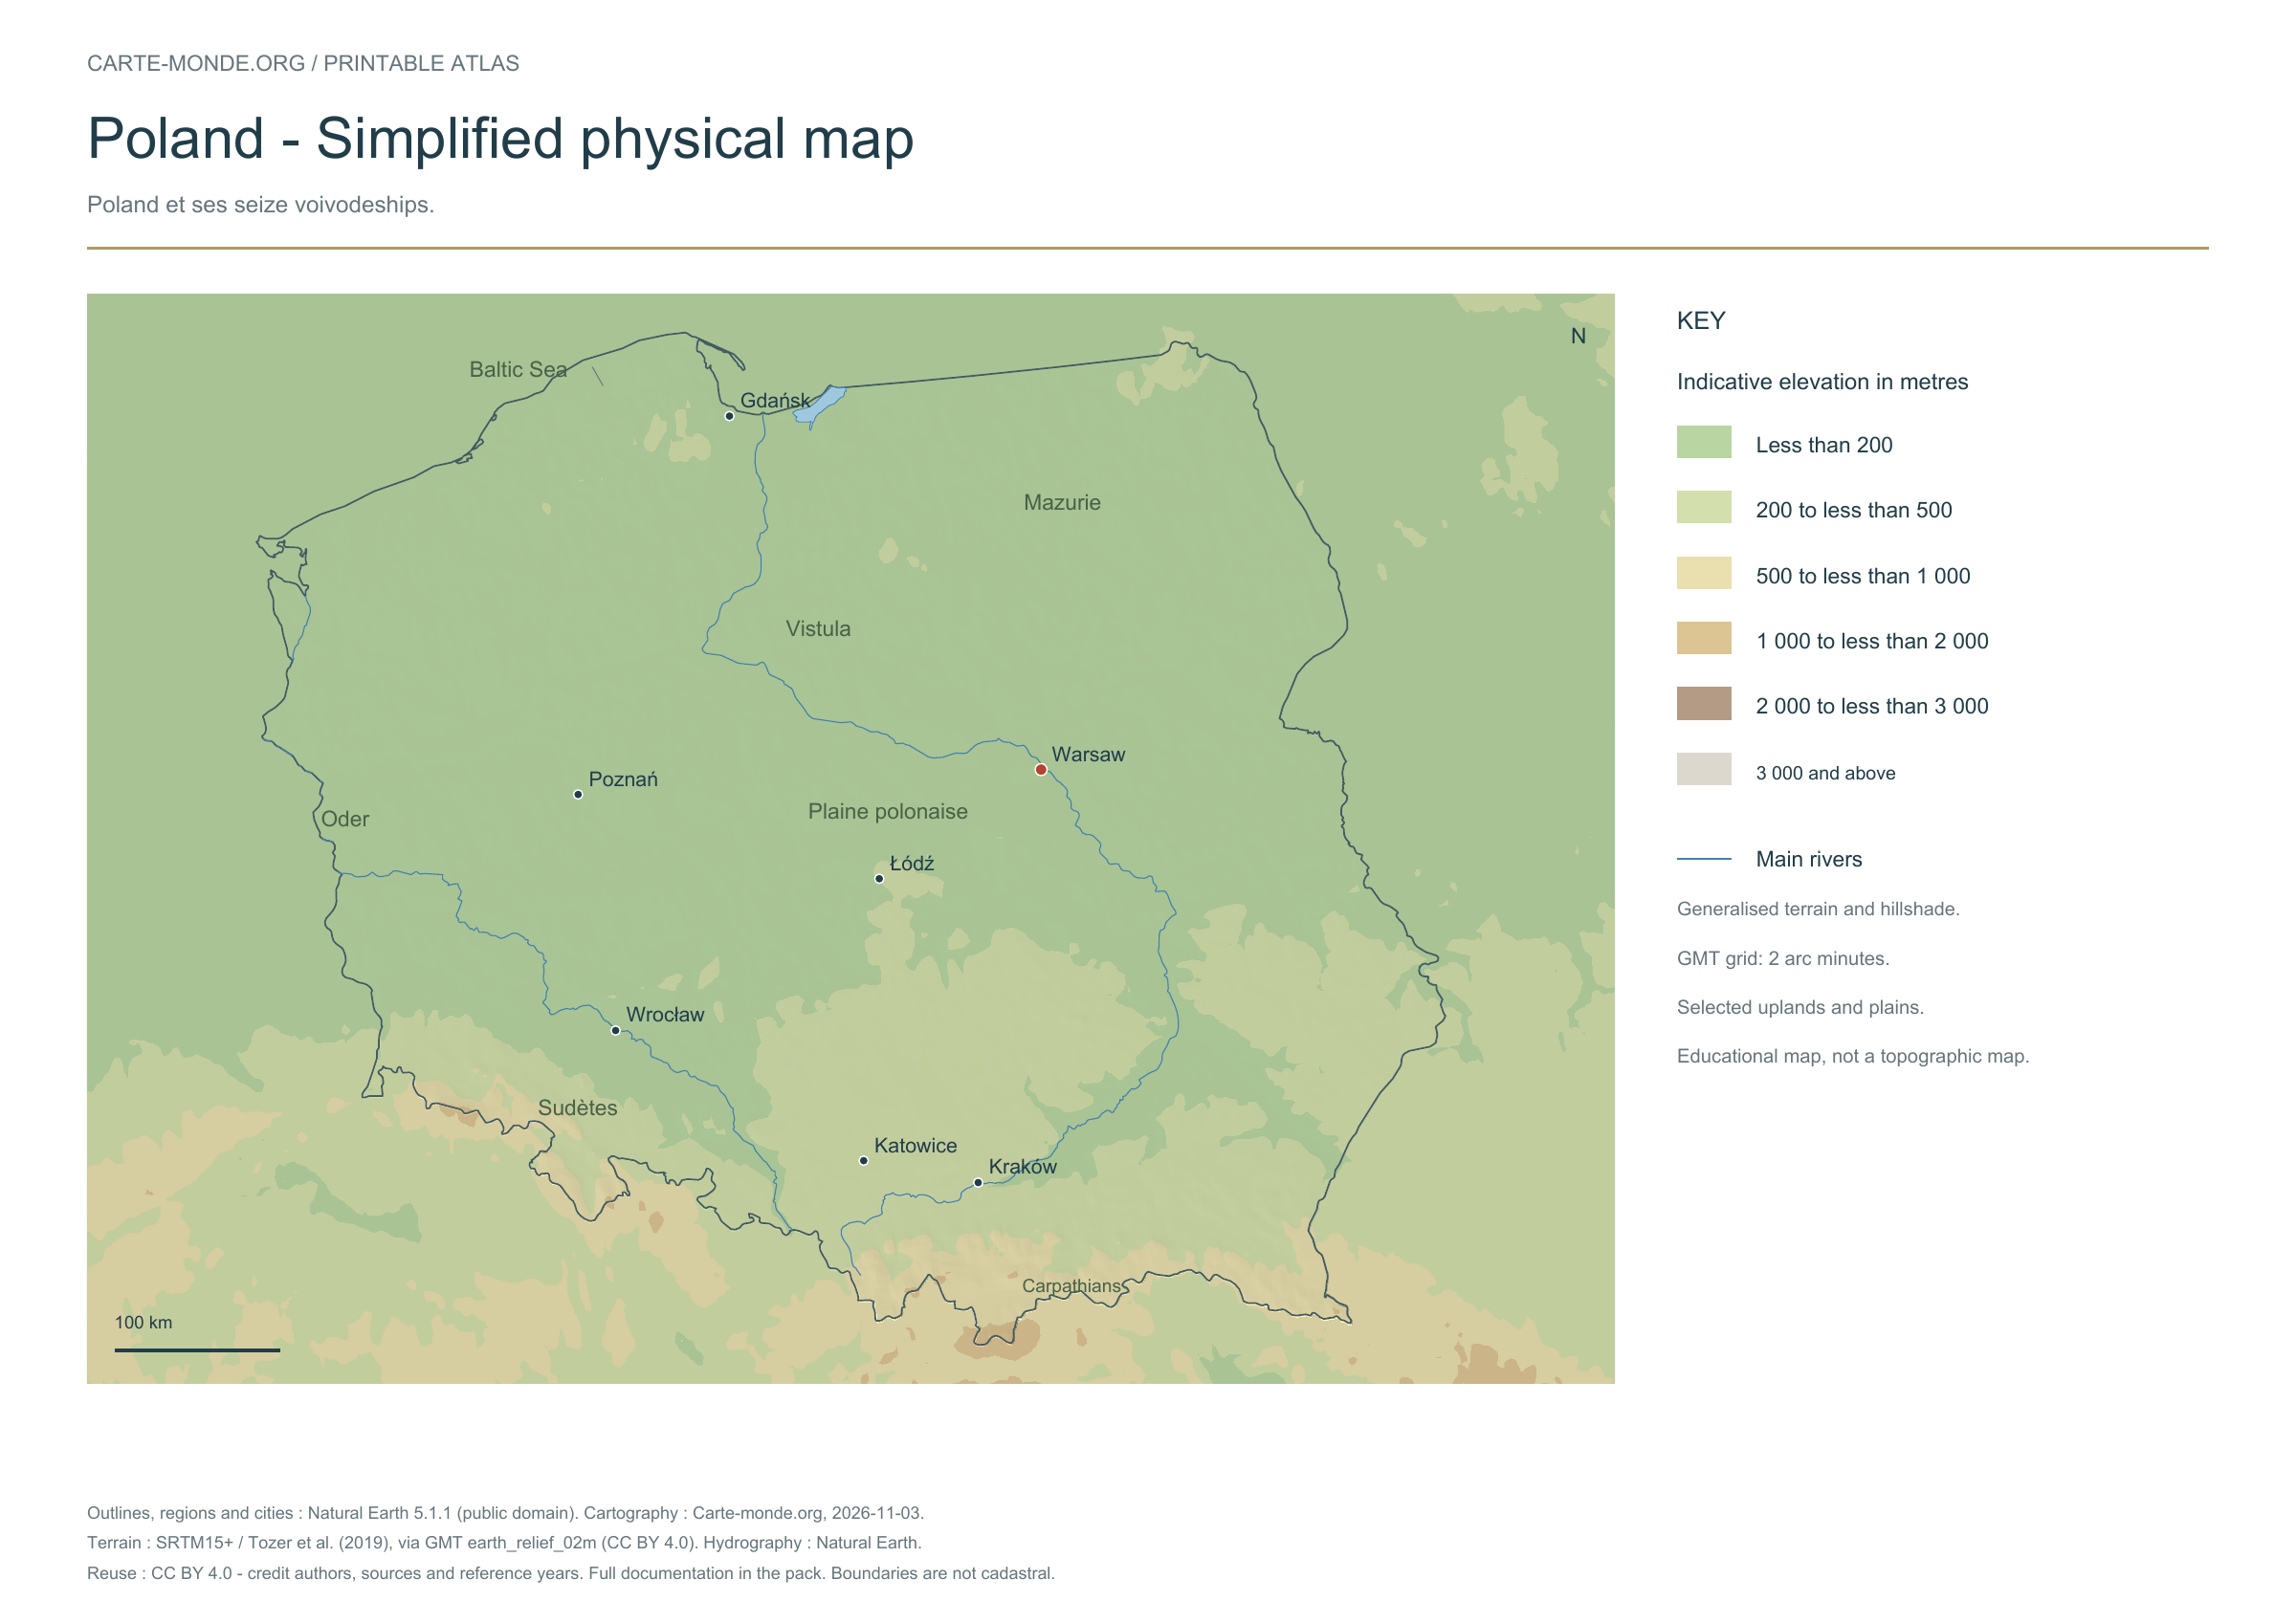
Simplified elevations

Smoothed relief, elevation colours, main mountain ranges, plains and watercourses. Educational map at national scale.

A4 landscape PDF · PNG 2 400 px · CC BY 4.0

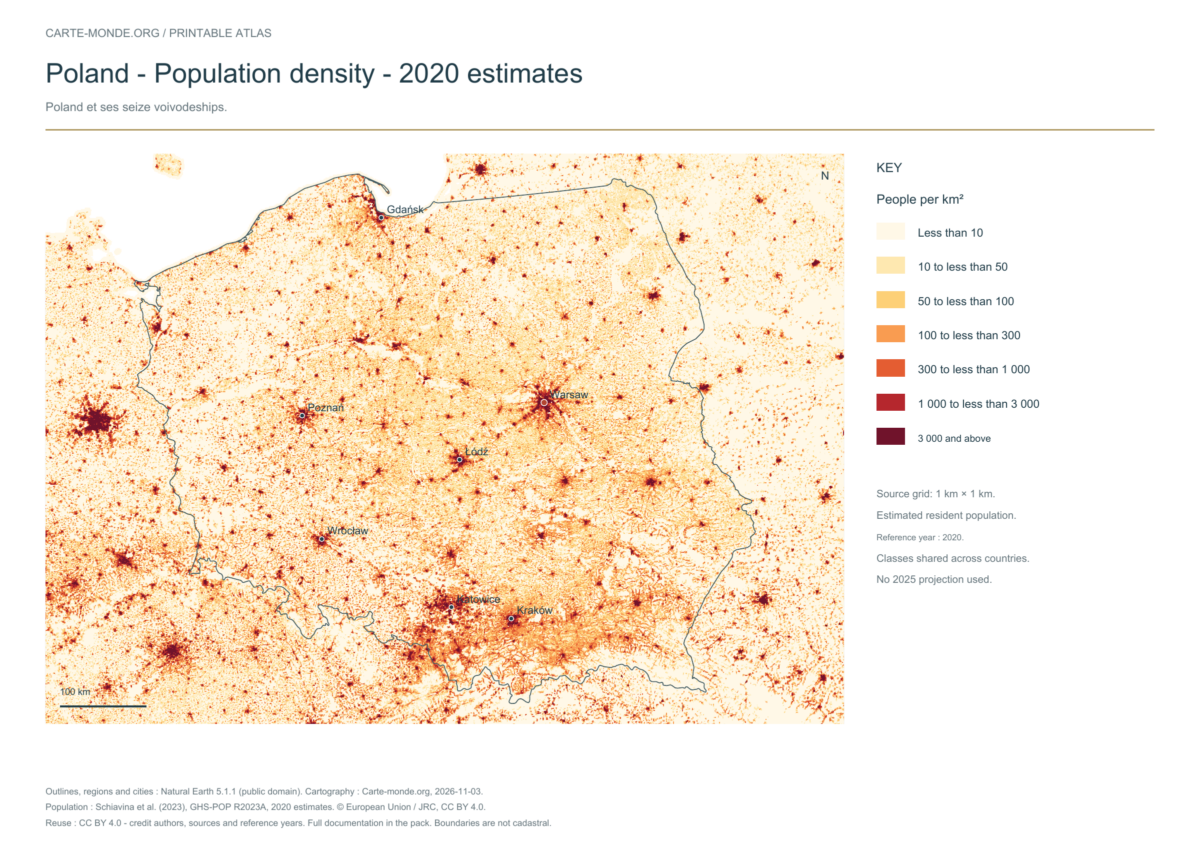
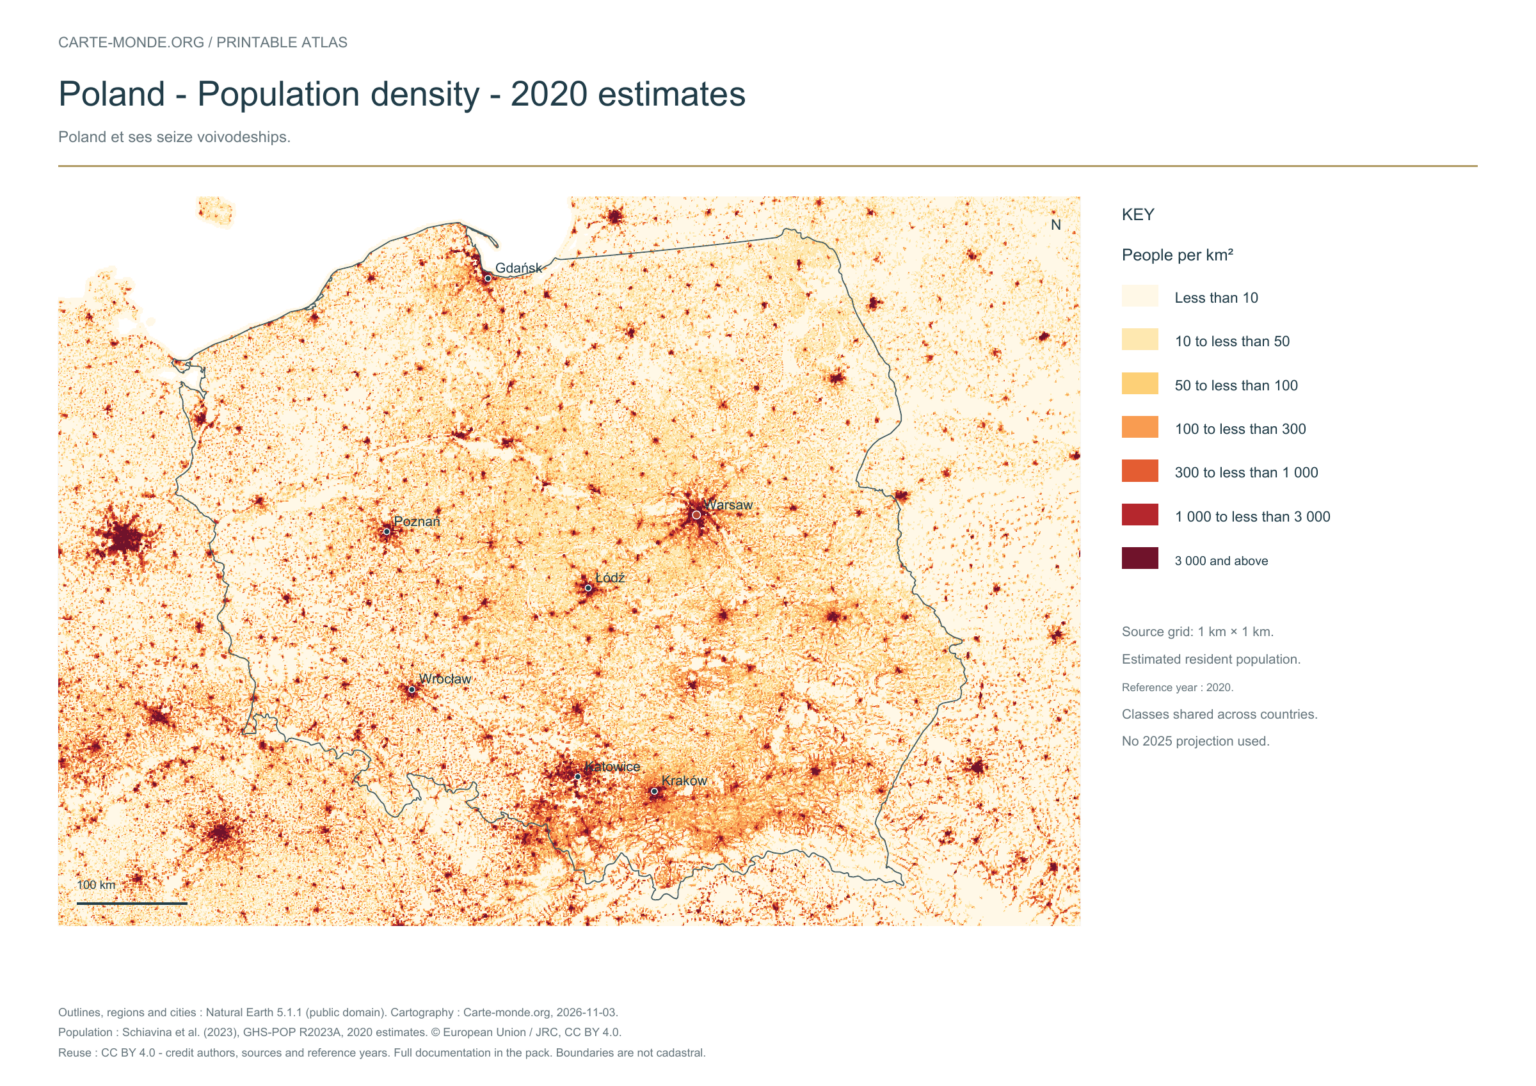
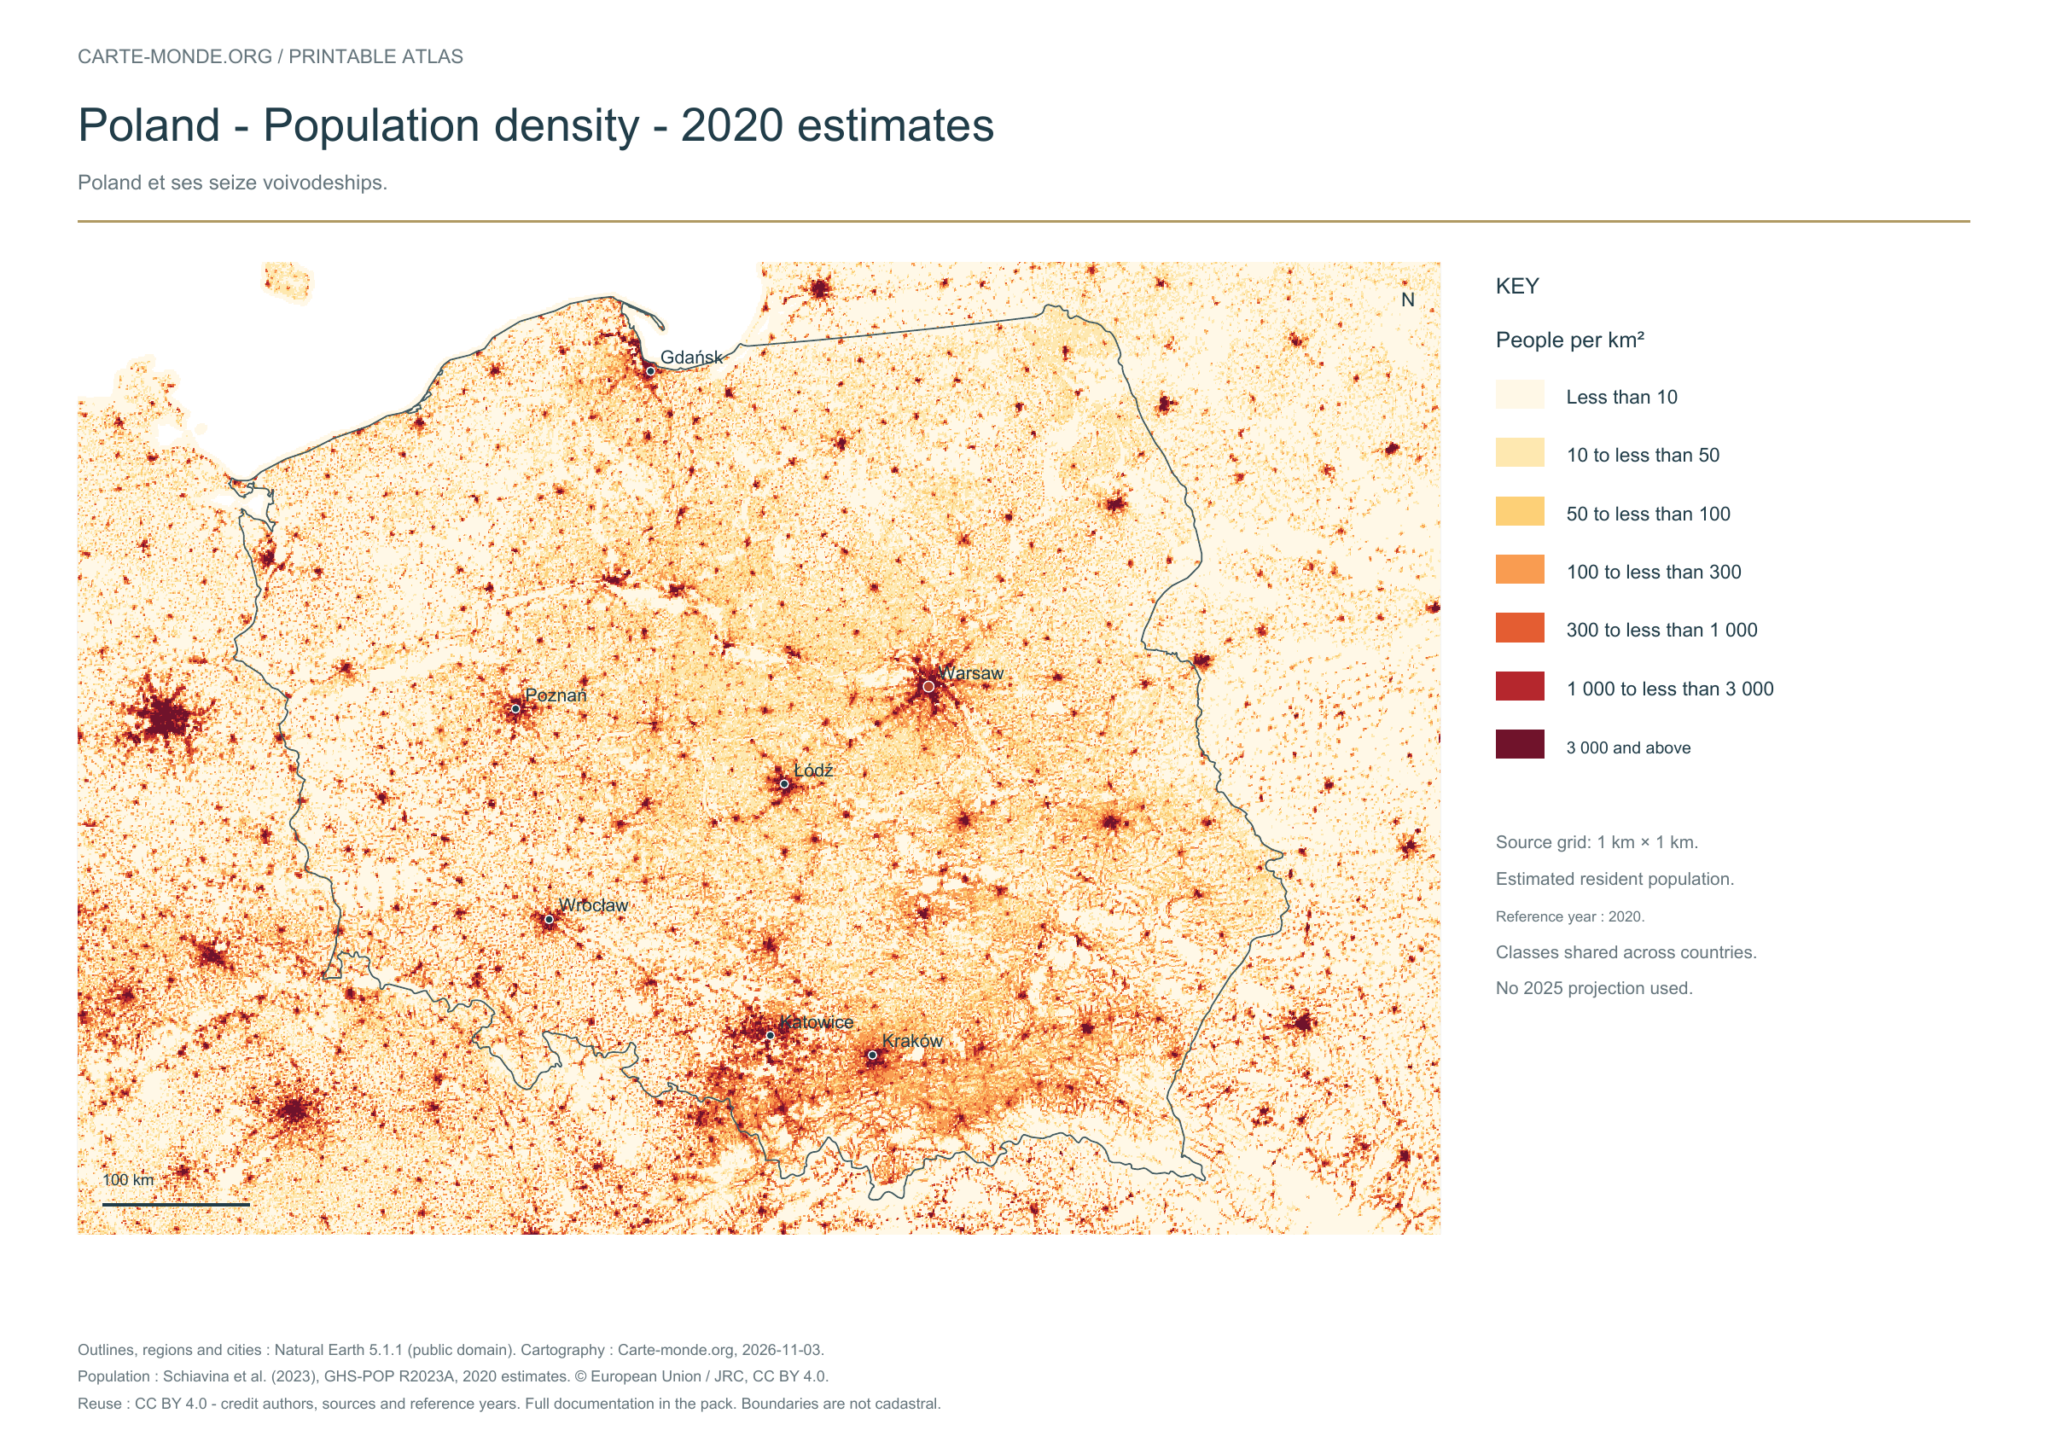
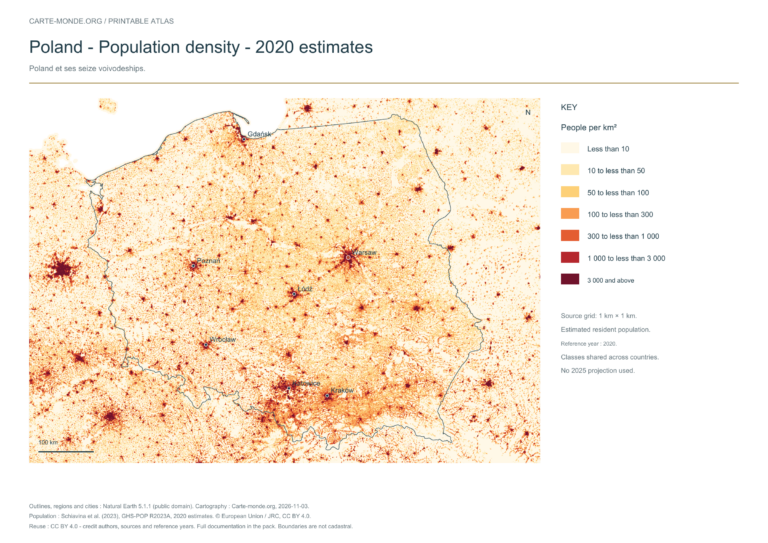
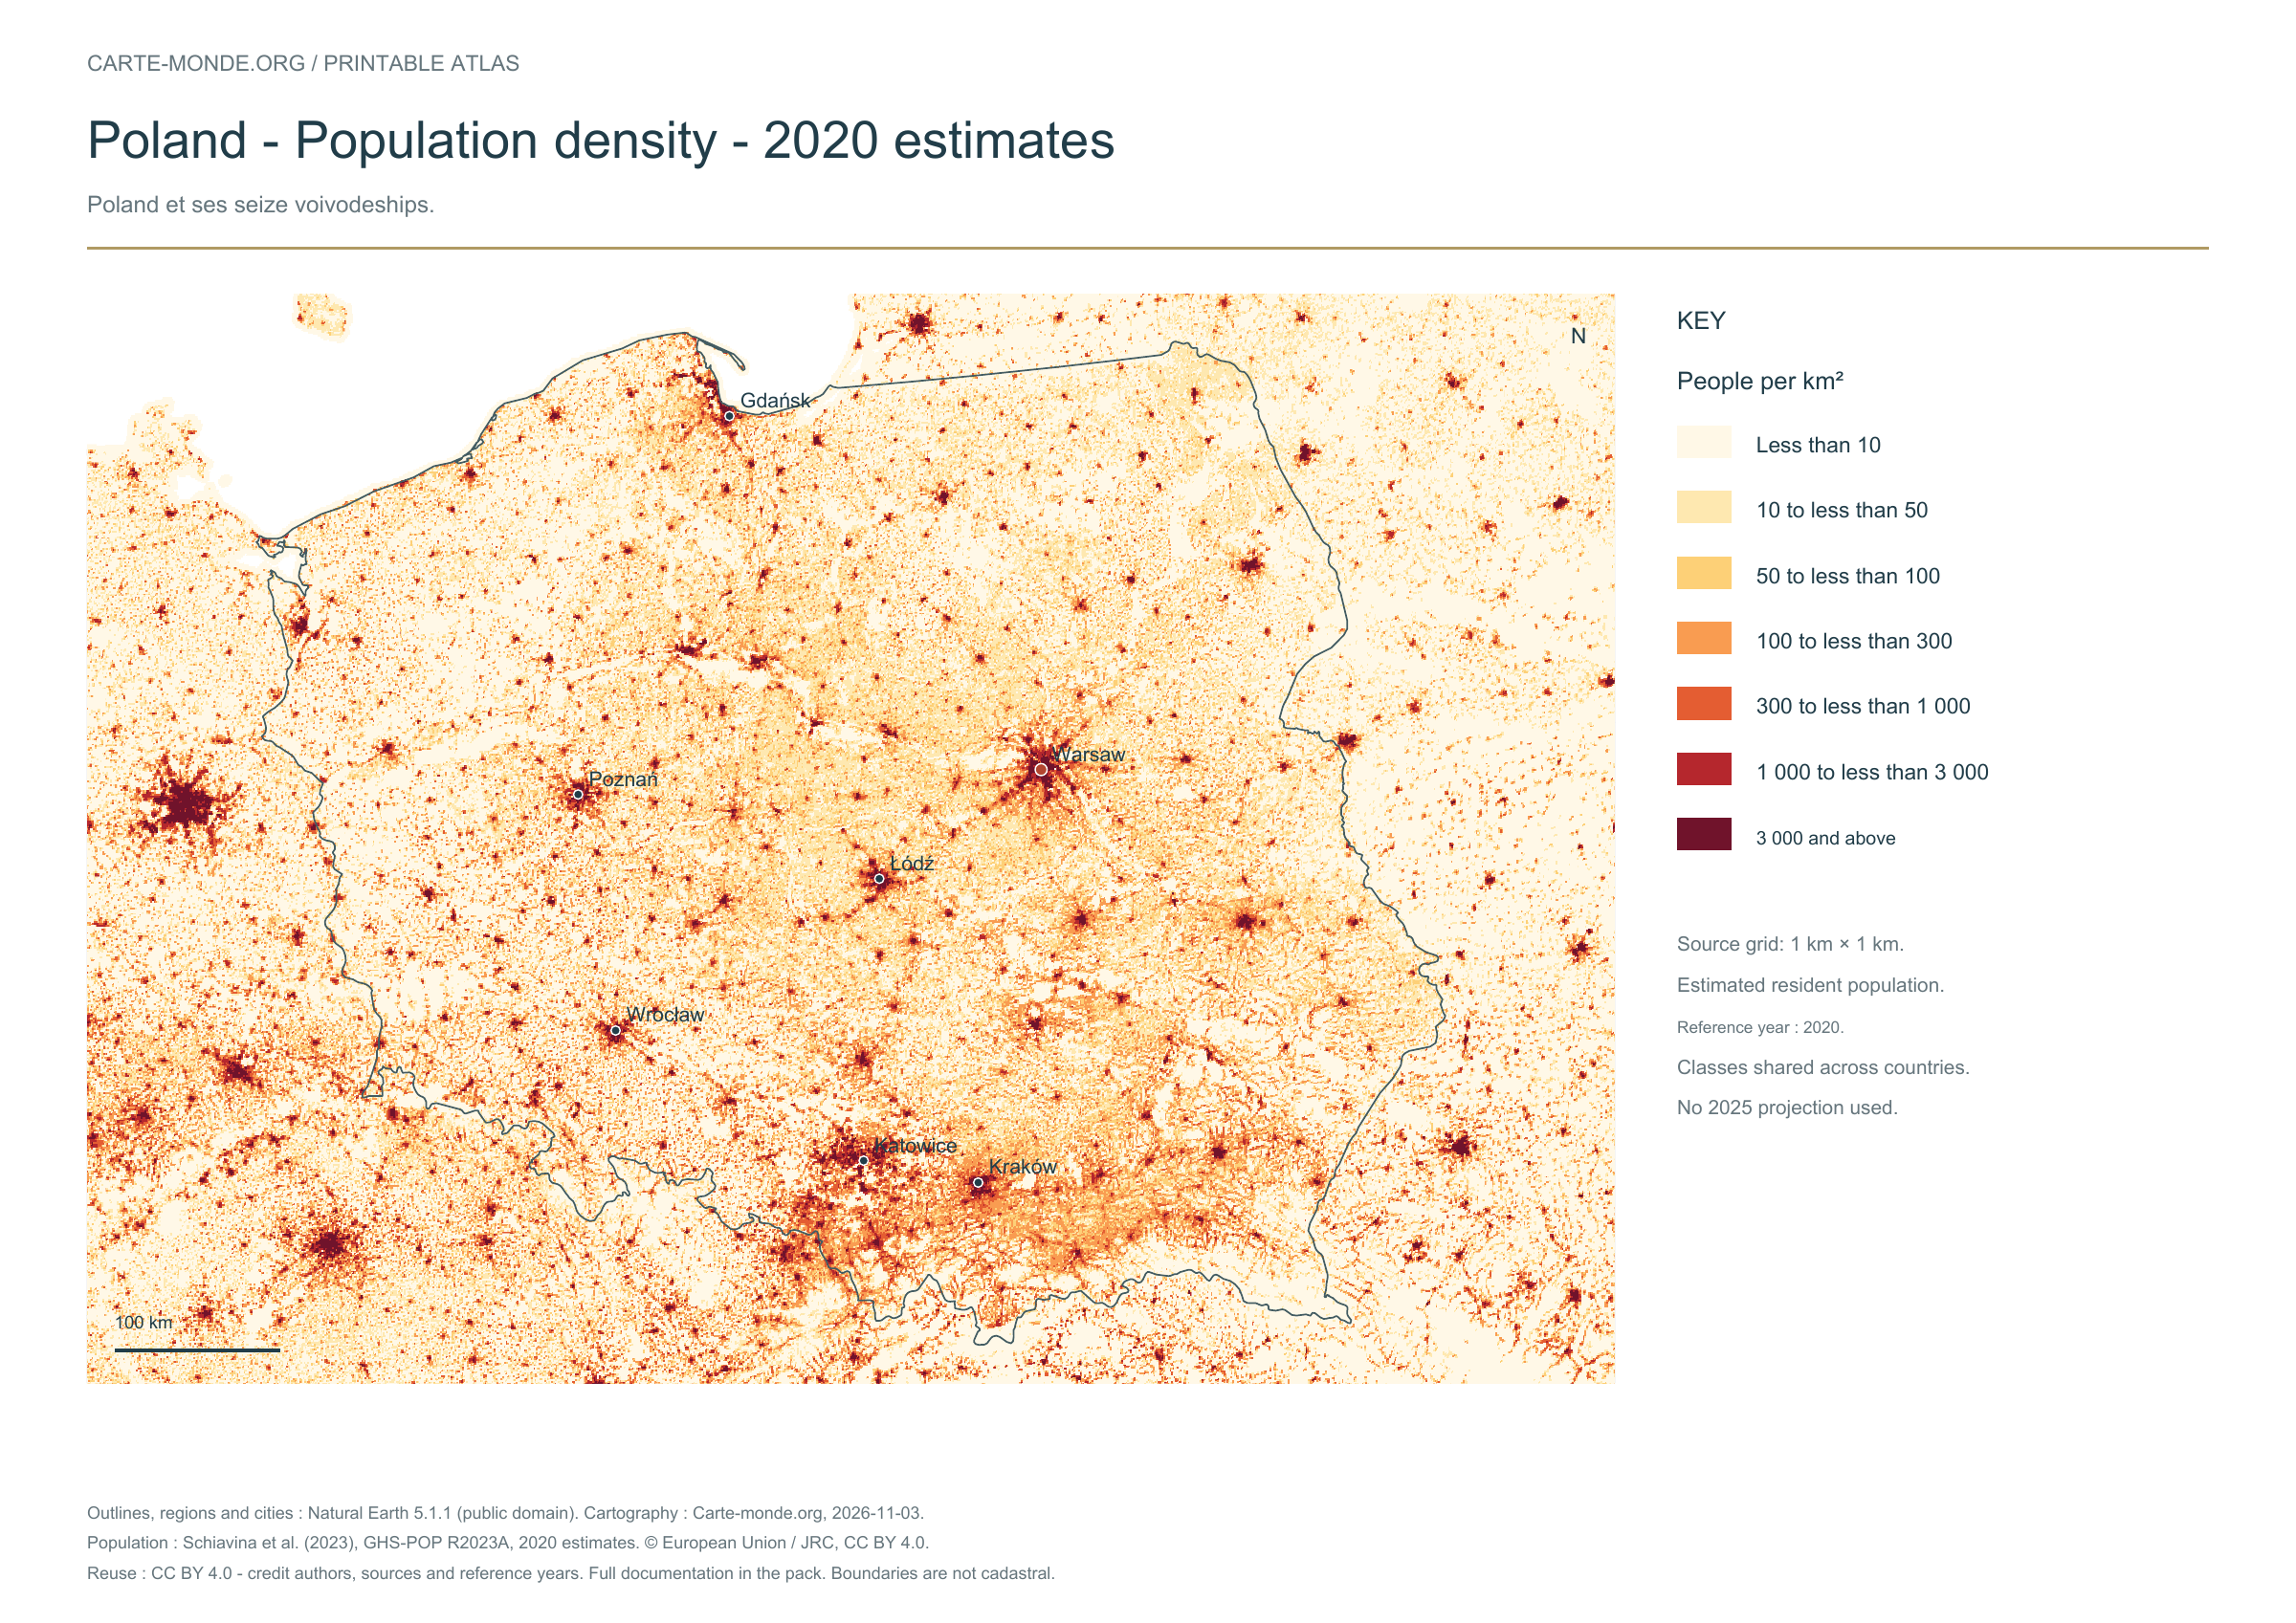
Population density: 2020 estimates

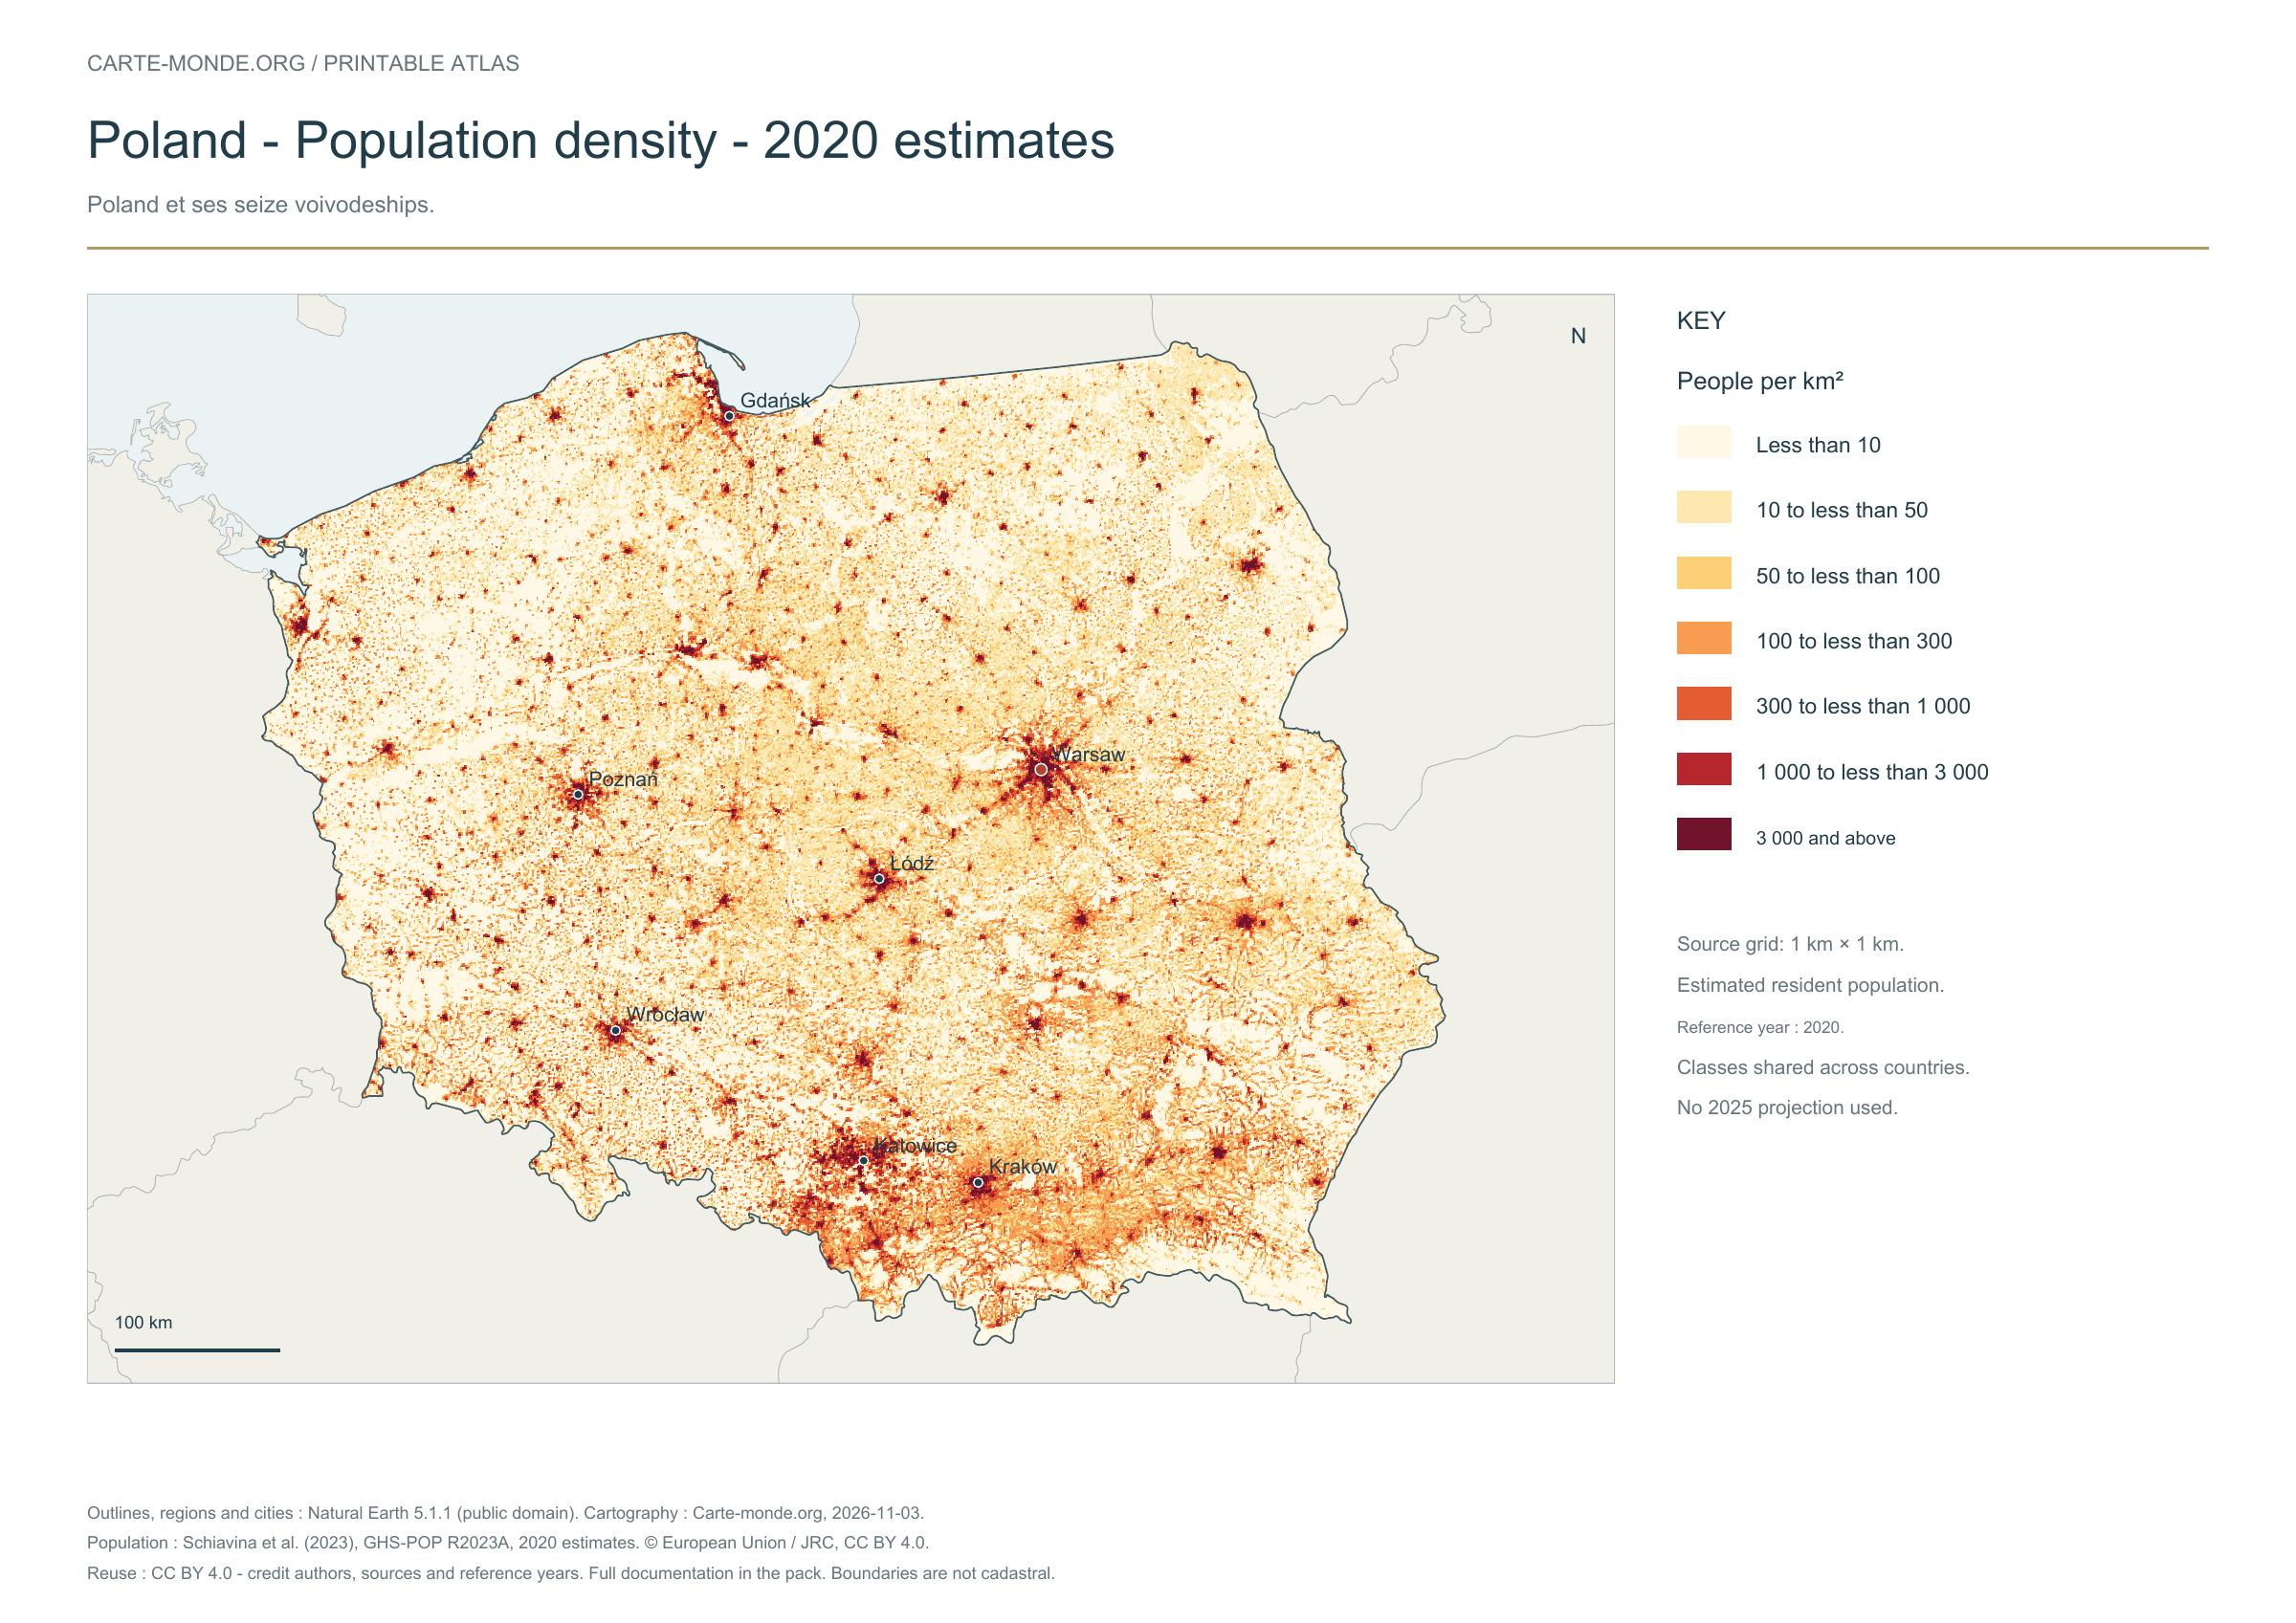
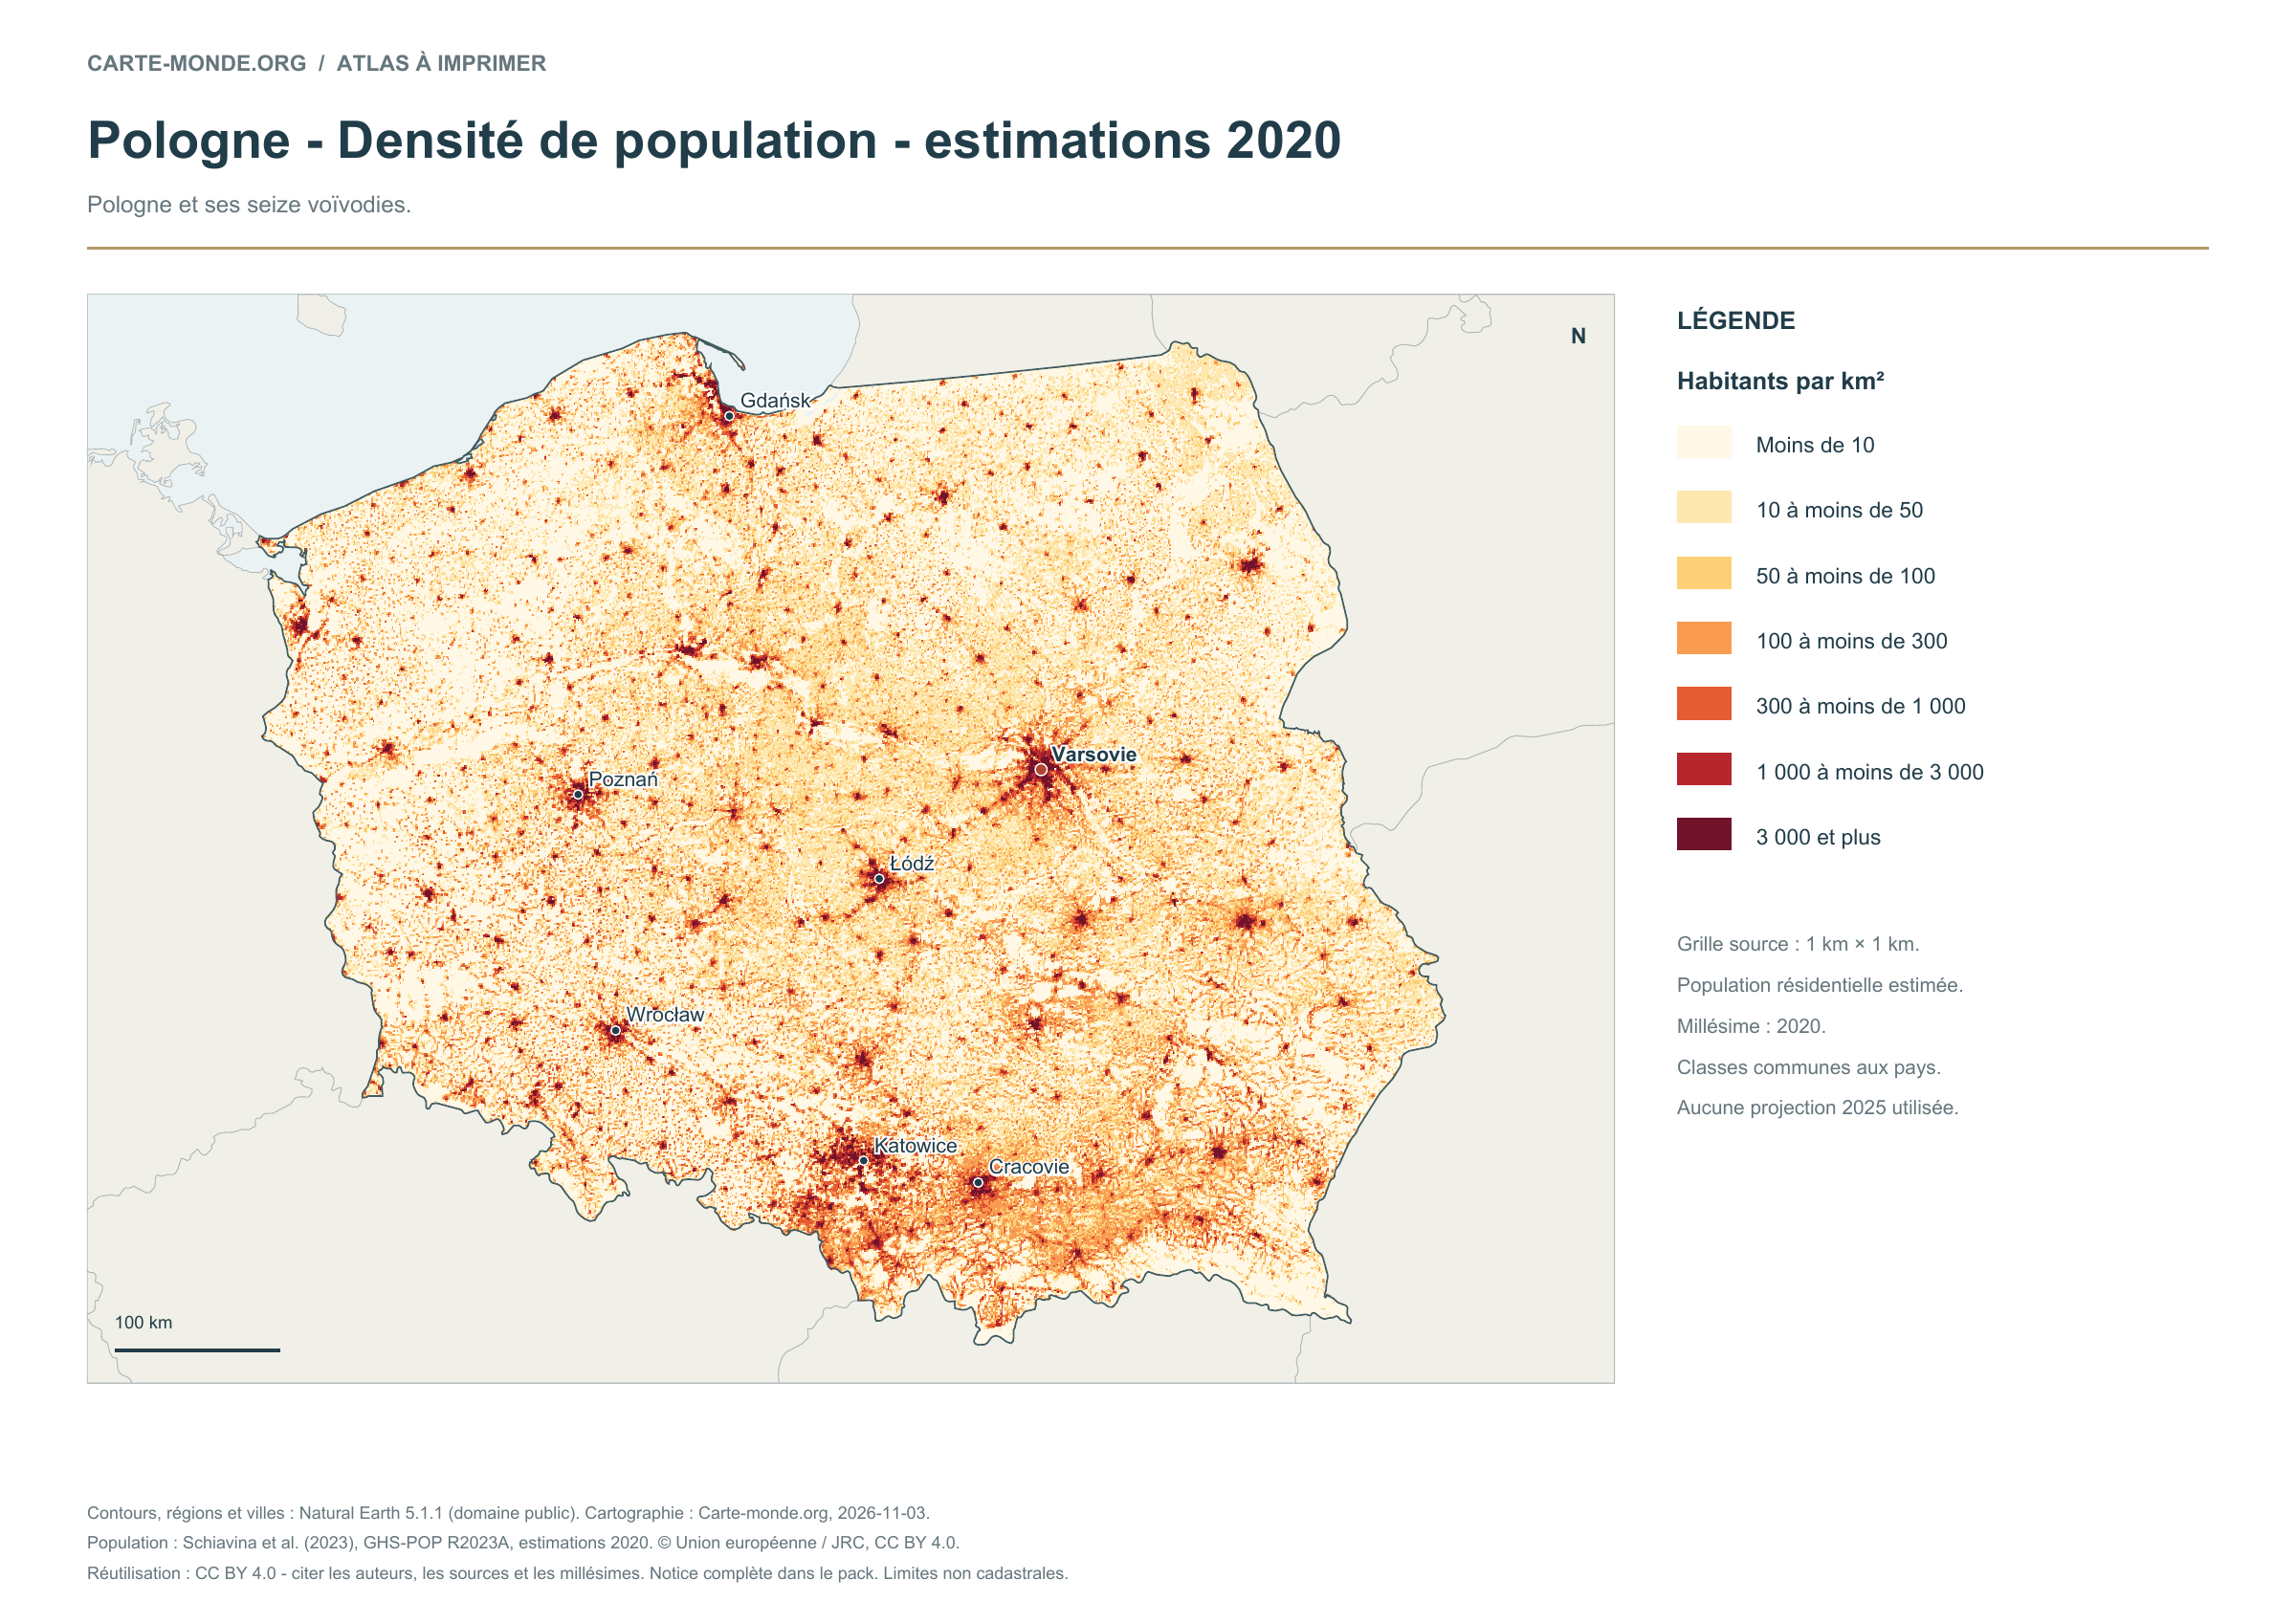
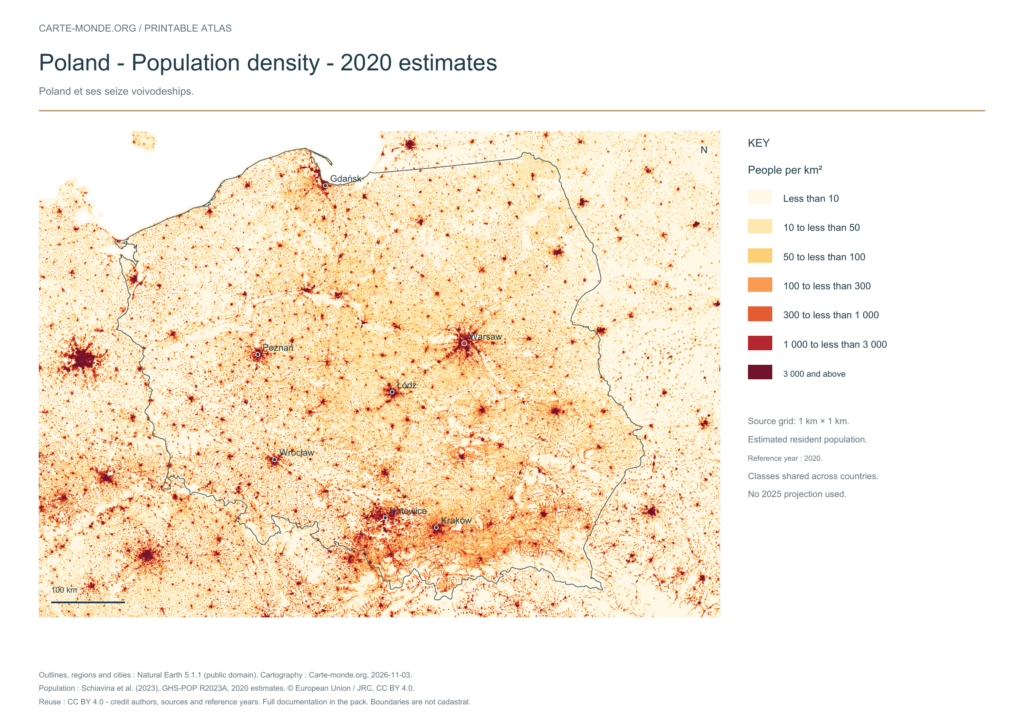
Population density — 2020 estimates — Poland

Carte-monde.org · November 2026

Population density — 2020 estimates

Estimated residential population in 2020, on a source grid of 1 km². Inhabitants/km² classes shared across countries; no projection for 2025. A few pixels without data (less than 0,1% of the displayed area) remain transparent and do not indicate zero population.

A4 landscape PDF · PNG 2 400 px · CC BY 4.0

The data represents estimated residential population in 2020, on a 1 km² source grid. The document’s creation date does not change this reference year.

The five in-house maps in one pack

Regions and cities, location in Europe, simplified elevations, 2020 population density and shaded relief: five A4 PDFs, their PNGs and SVGs, with sources and licences.

Download the five maps — ZIP
Previous edition packs

The four maps in one pack

Four A4 PDFs, their PNGs and SVGs, with full notes. Terrain and density use an embedded image background; text and linework remain vector-based.

Download the Poland pack — ZIP

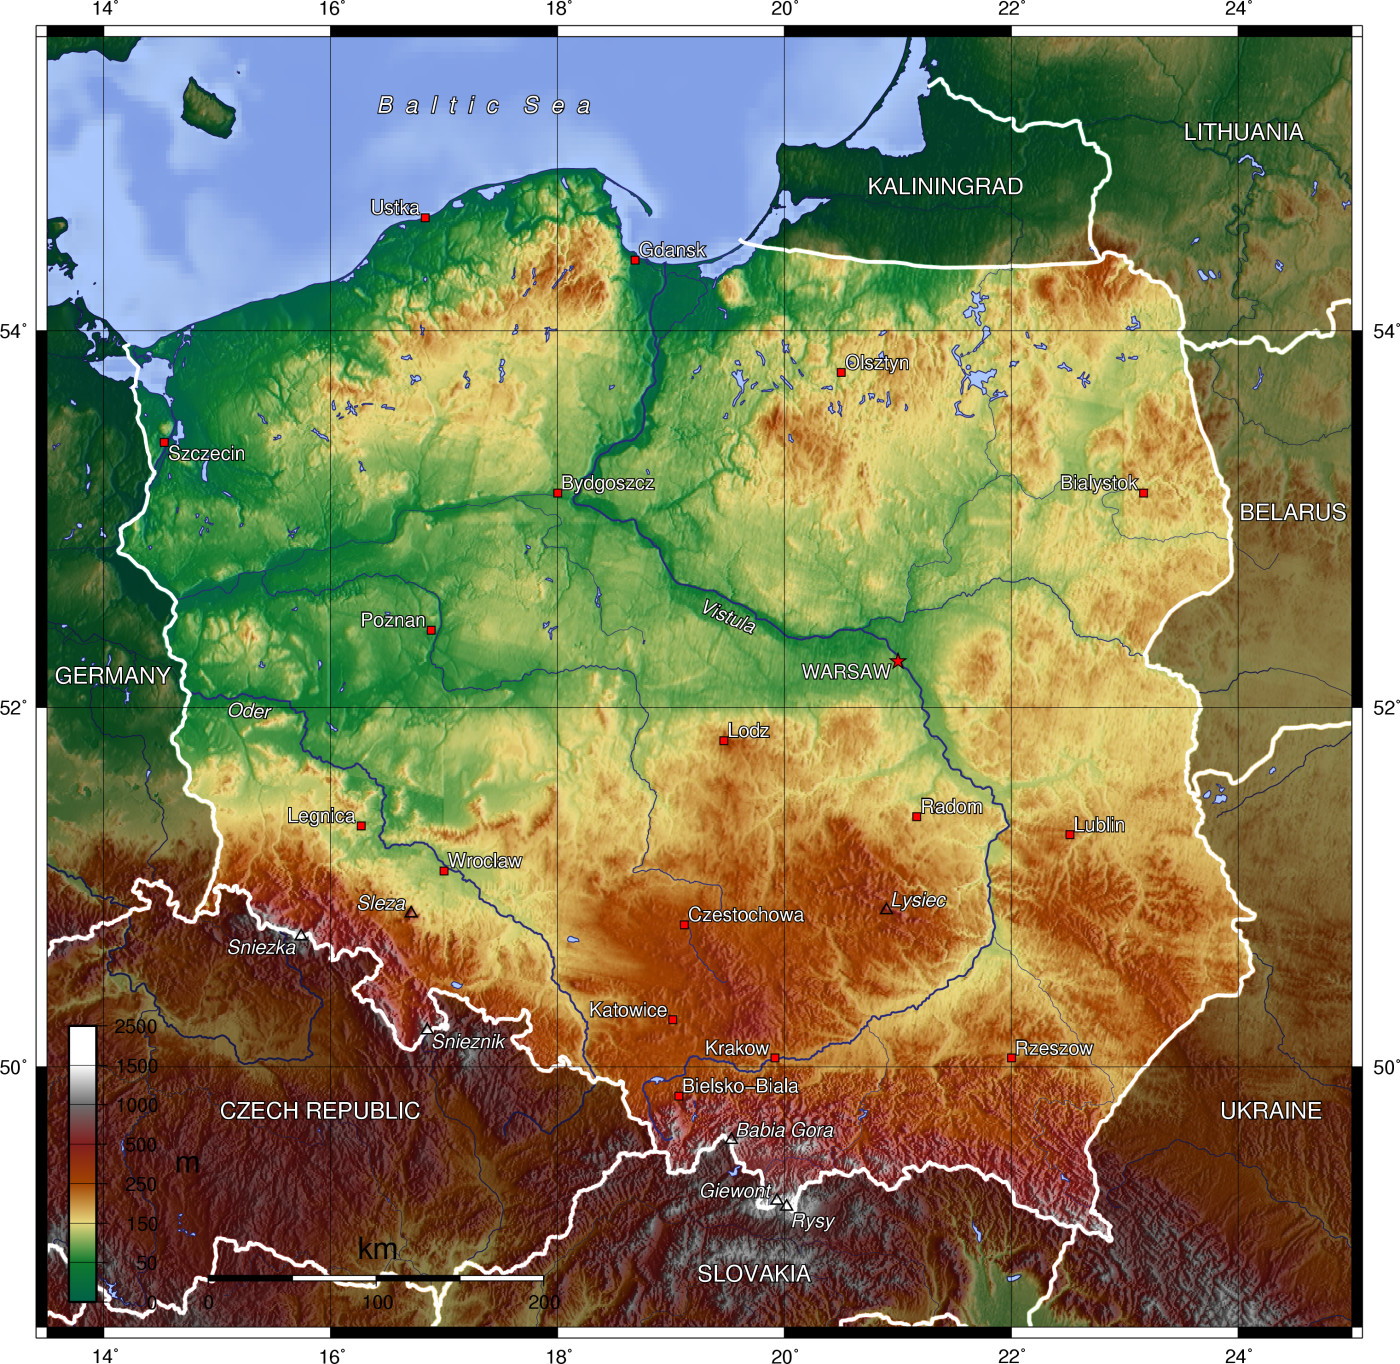
An additional reference map

Existing document, preserved in its original language and with its creation date. This map is not presented as a current administrative edition.

Poland topo.jpg — reference 2005

Created: 2005-12-23

Poland topo.jpg

Captain Blood at english Wikipedia · CC BY-SA 3.0 · Original file page and source

Download the original and its credits — ZIP

Retain the stated authors and conditions; adaptations of CC BY-SA maps must keep an identical or compatible licence.

Find the old maps of Poland

Previously published maps remain accessible at their original URLs, with the collection’s text and credits.

Open the old maps of Poland

Choose and print a map

Regions and cities show how the territory is organized; the location map places the country; terrain shows the main natural regions; density shows population distribution. Print the in-house PDFs in A4 landscape with “Fit to page”. Insets have their own scales.

For exercises: six blank base maps of Poland.

Sources, reference years and reuse

Outlines, regions, cities and hydrography: Natural Earth 5.1.1, public domain. Generalized boundaries at 1:10 million, not cadastral; edition year 2026 does not mean that all geometries have been updated.

Relief: SRTM15+ / Tozer et al. (2019), reference publication, via GMT earth_relief_02m derived from SRTM15+V2.7. Grid smoothed to two arc minutes, suitable for a national overview, without topographic precision.

Population: Schiavina et al. (2023), GHS-POP R2023A, 2020 residential estimates, © European Union / JRC, CC BY 4.0. The 1 km² Mollweide cells are expressed in inhabitants/km². Methodology: Pesaresi et al. (2024).

The four new maps: created by Carte-monde.org, November 2026, under CC BY 4.0. Cite authors, sources and reference years, and indicate adaptations. Additional and older maps retain their own rights.

Country maps · Other maps and archives

Previous versions: maps and files preserved

These files remain available at their original URLs. For corrected maps, use the main links above. Each edition retains its credits and date.

Raster base map, cities, rivers and lakes: Natural Earth, public domain. Other boundary credits and licences are retained in the pack. Cartographic work CC BY 4.0; ODbL-derived data retains its licence. No topographic accuracy is claimed.

Other maps: sources and reuse

Reference maps by external authors. Each document retains its licence, credits and date. “View map” links open the document on Commons; ZIP buttons provide access to the files kept in this collection.

Population density in Poland.png

Author: nerdy.maps · CC BY-SA 4.0 · Original file page, sources and licence

Date stated by the source: 2020-04-09. The data reference year may differ from the document’s; consult its legend.

View the map on Commons

Relief Map of Poland.svg

Author: TUBS · CC BY-SA 3.0 · Original file page, sources and licence

Date stated by the source: 2011-11-30. The data reference year may differ from the document’s; consult its legend.

View the map on Commons

To reuse a CC BY map, cite its authors, source and licence and indicate any changes. Adaptations of a CC BY-SA map retain the same or a compatible licence. CC0 documents may be reused freely; retaining the source makes them easier to identify. These rights do not make all administrative boundaries current.

Previous collection — original files preserved
Flag of Poland
Flag of Poland
Online Maps of Poland
General Map of Poland
Poland's political map
Poland’s political map
Map of Poland, Relief and regions
Original French files
Previous language edition