

TANZANIA · PRINTABLE MAPS
Four maps of Tanzania: divisions and cities, location in Africa, elevation and population density. PDF, PNG and packs with sources. Earlier files retain their links.
Map labels and downloadable files remain in their original language, often French.
Explore the country with four maps of Tanzania
Tanzania: 31 regions. Generalised reference boundaries do not show current territorial control.
Carte-monde.org · November 2026
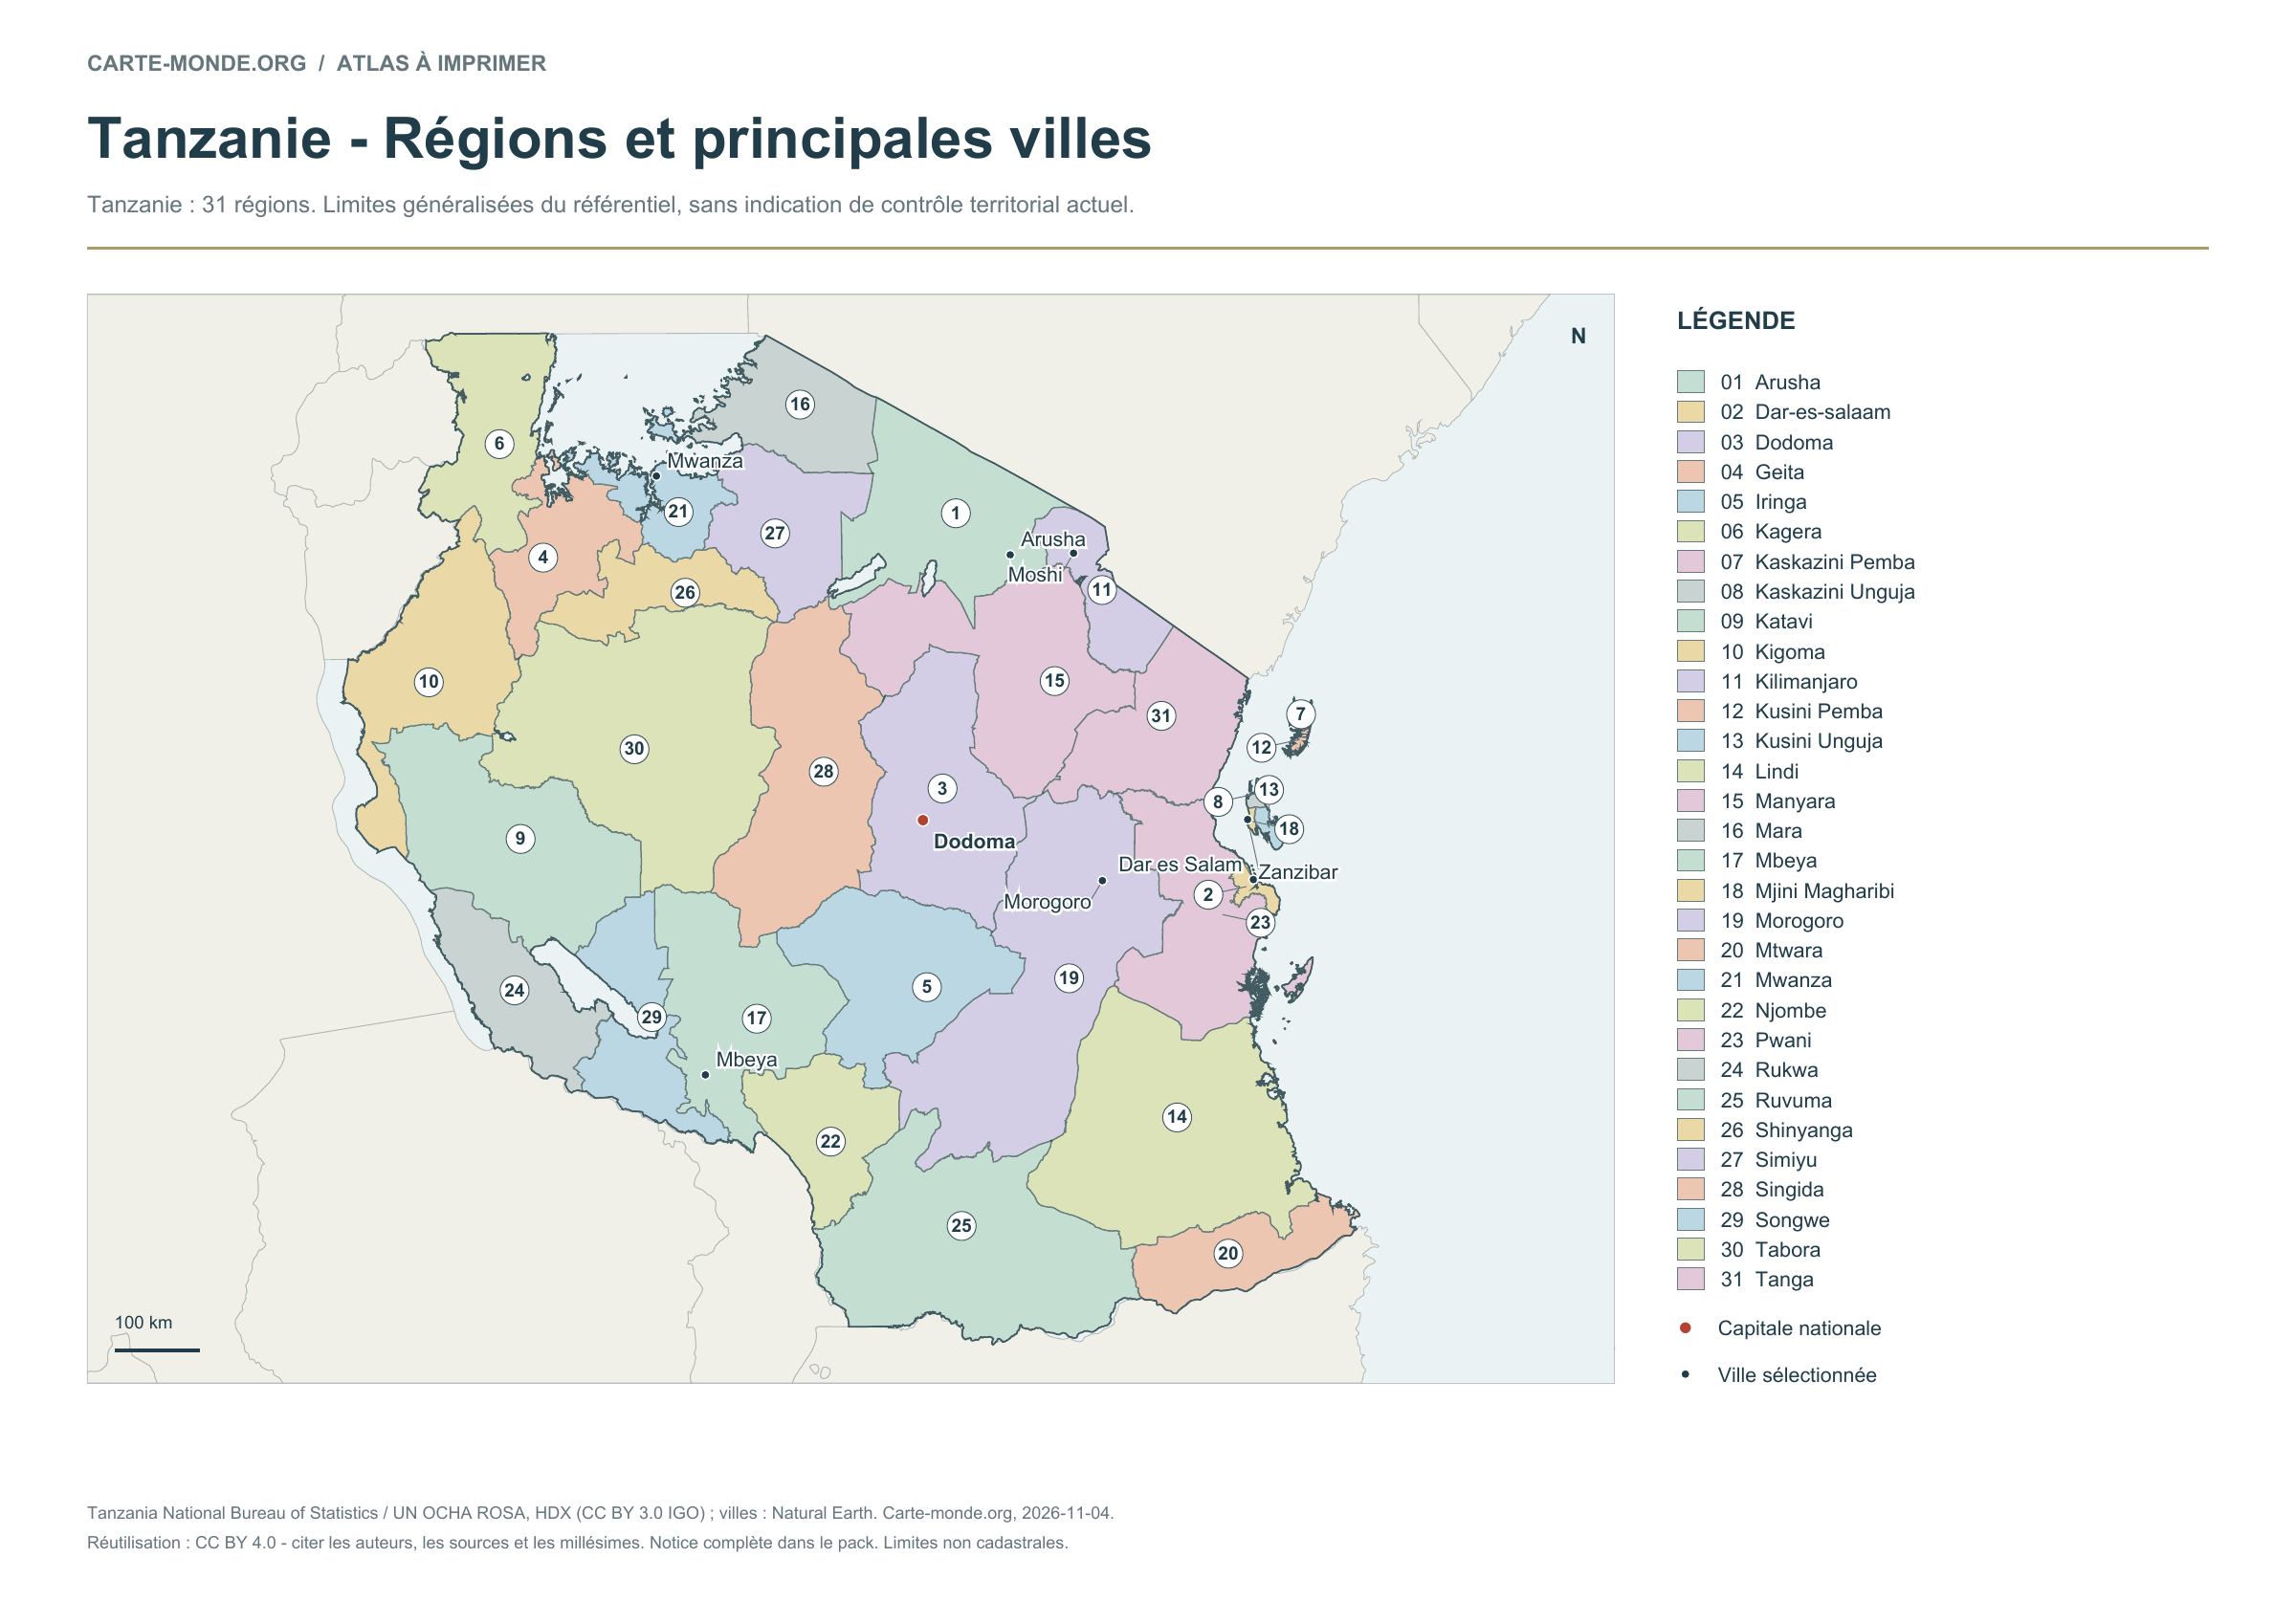
Administrative divisions and major cities
31 regions. Numbered and named in the key, with selected cities and capitals marked.
PDF A4 · PNG · CC BY 4.0
Carte-monde.org · November 2026
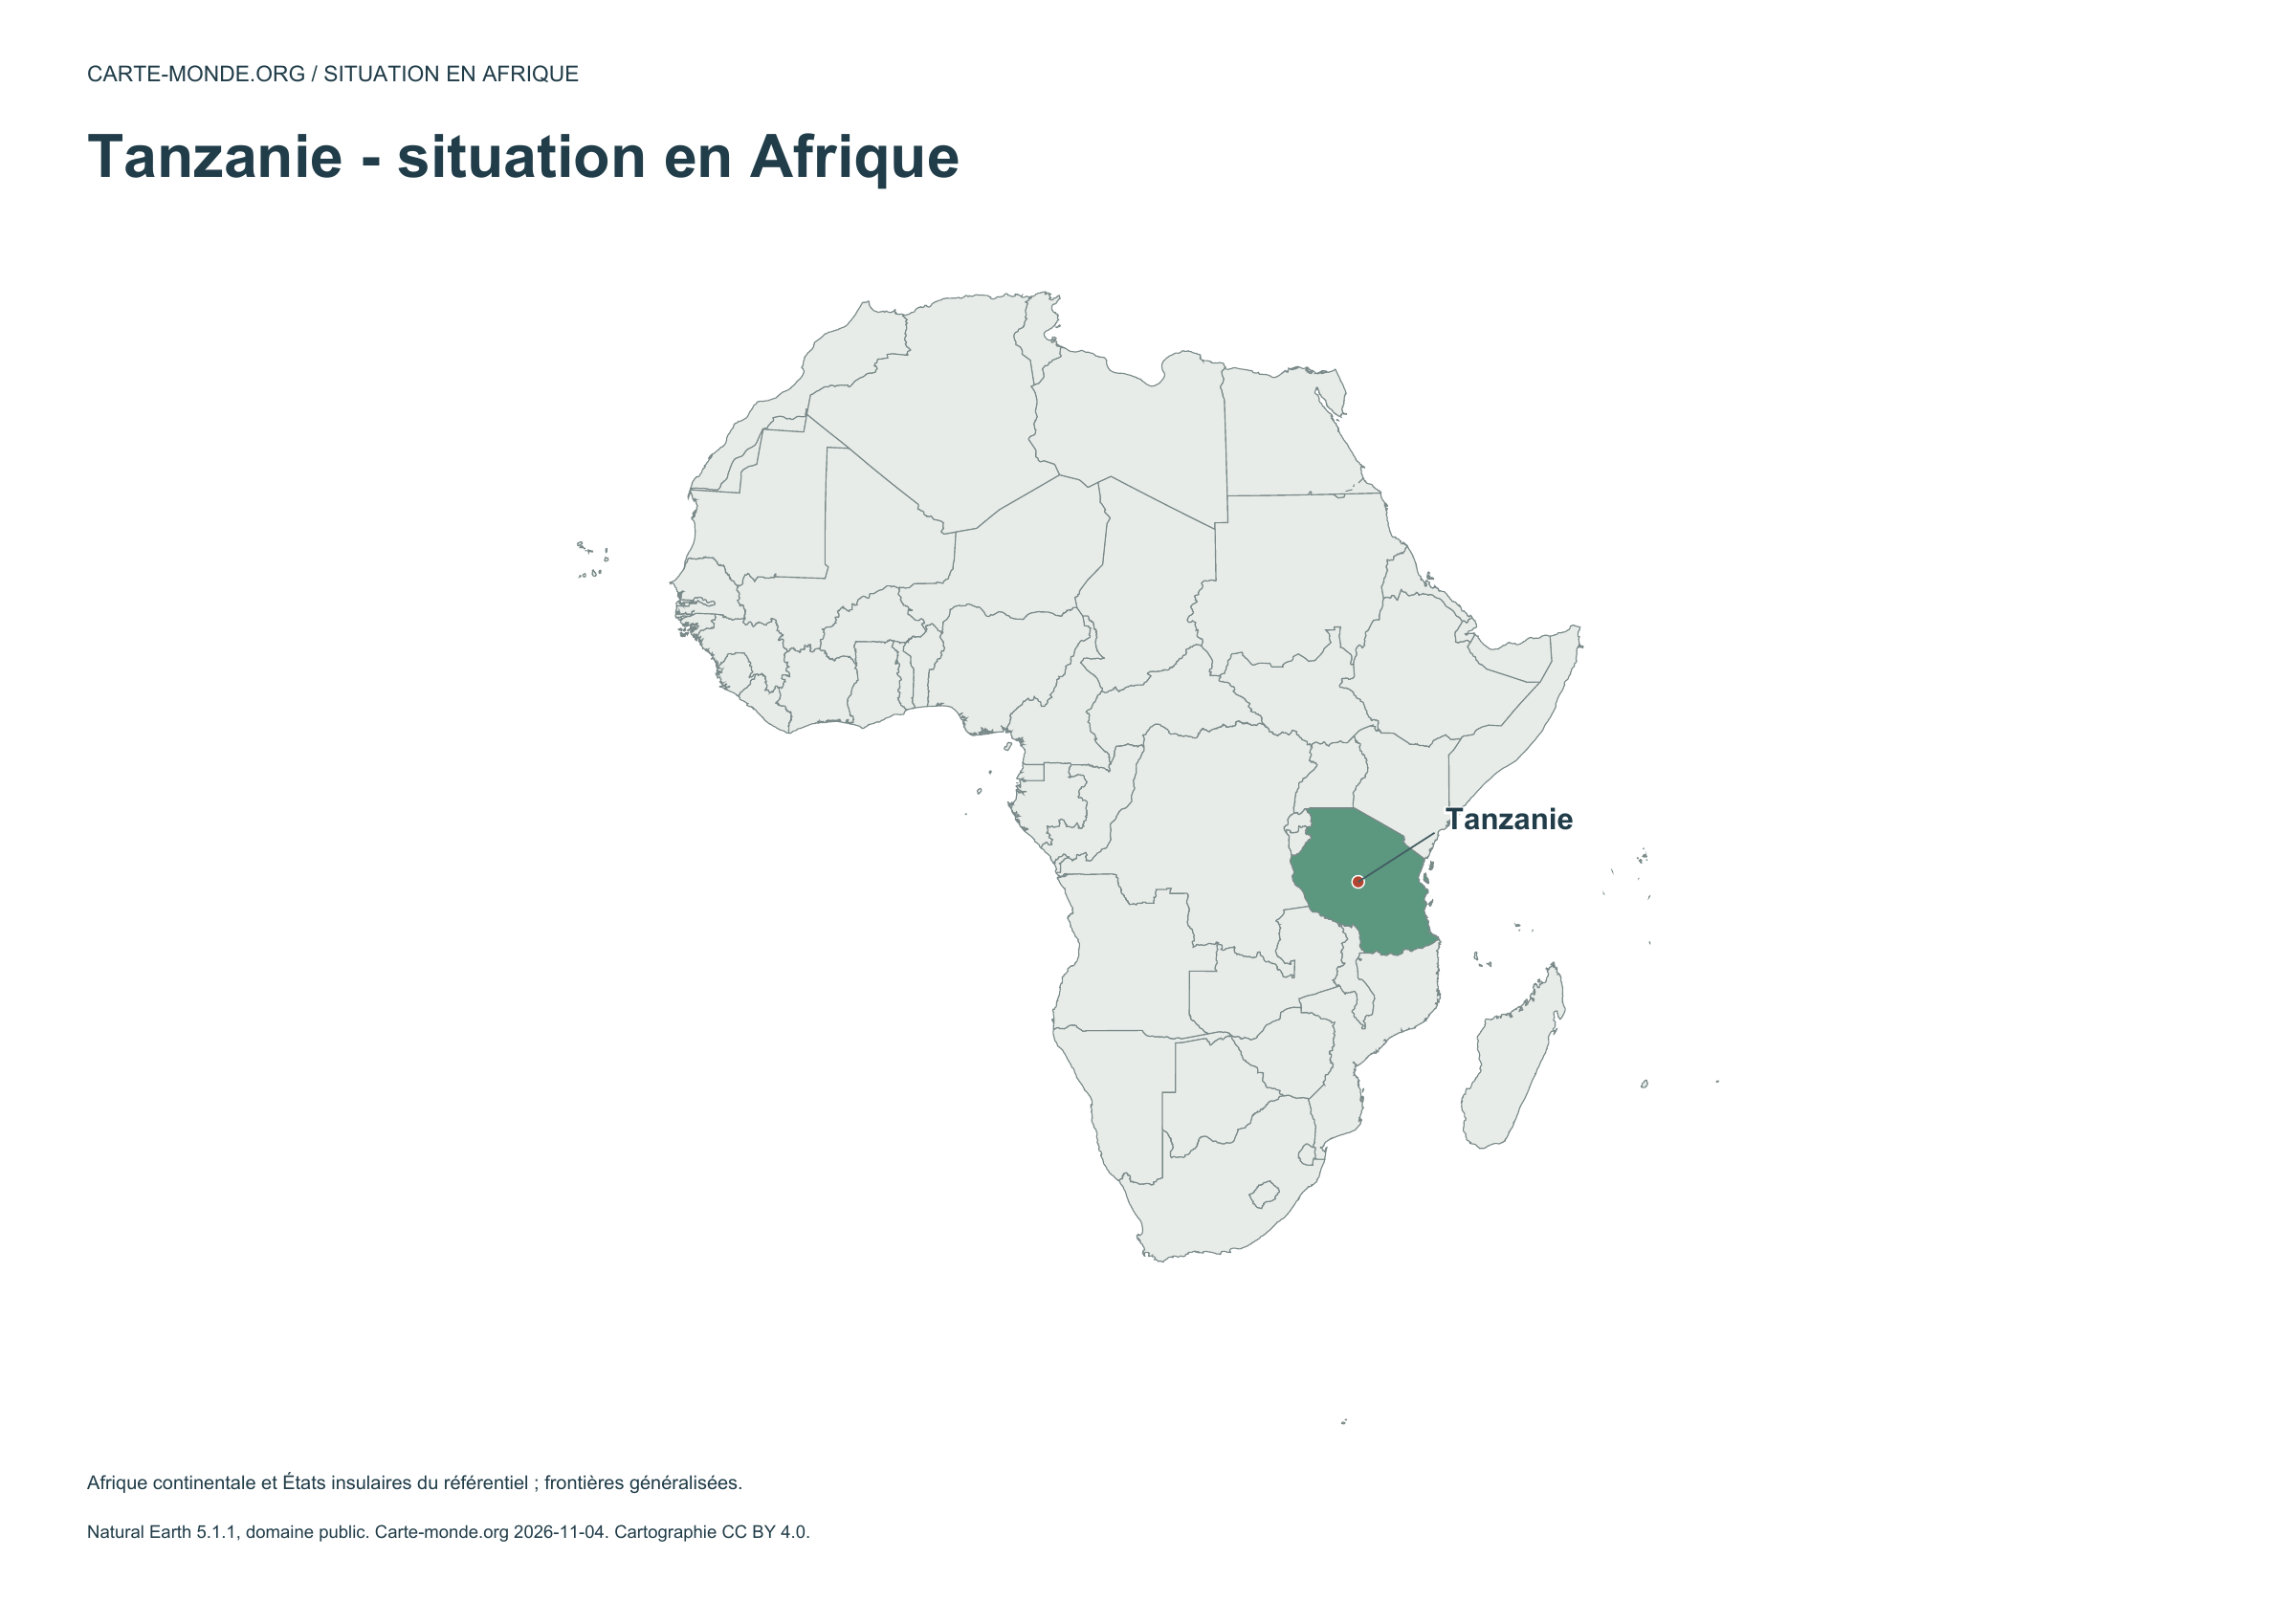
Location in Africa
The country is highlighted on a simplified map of Africa. This page explains the coverage and any disputed territories.
PDF A4 · PNG · CC BY 4.0
Carte-monde.org · November 2026
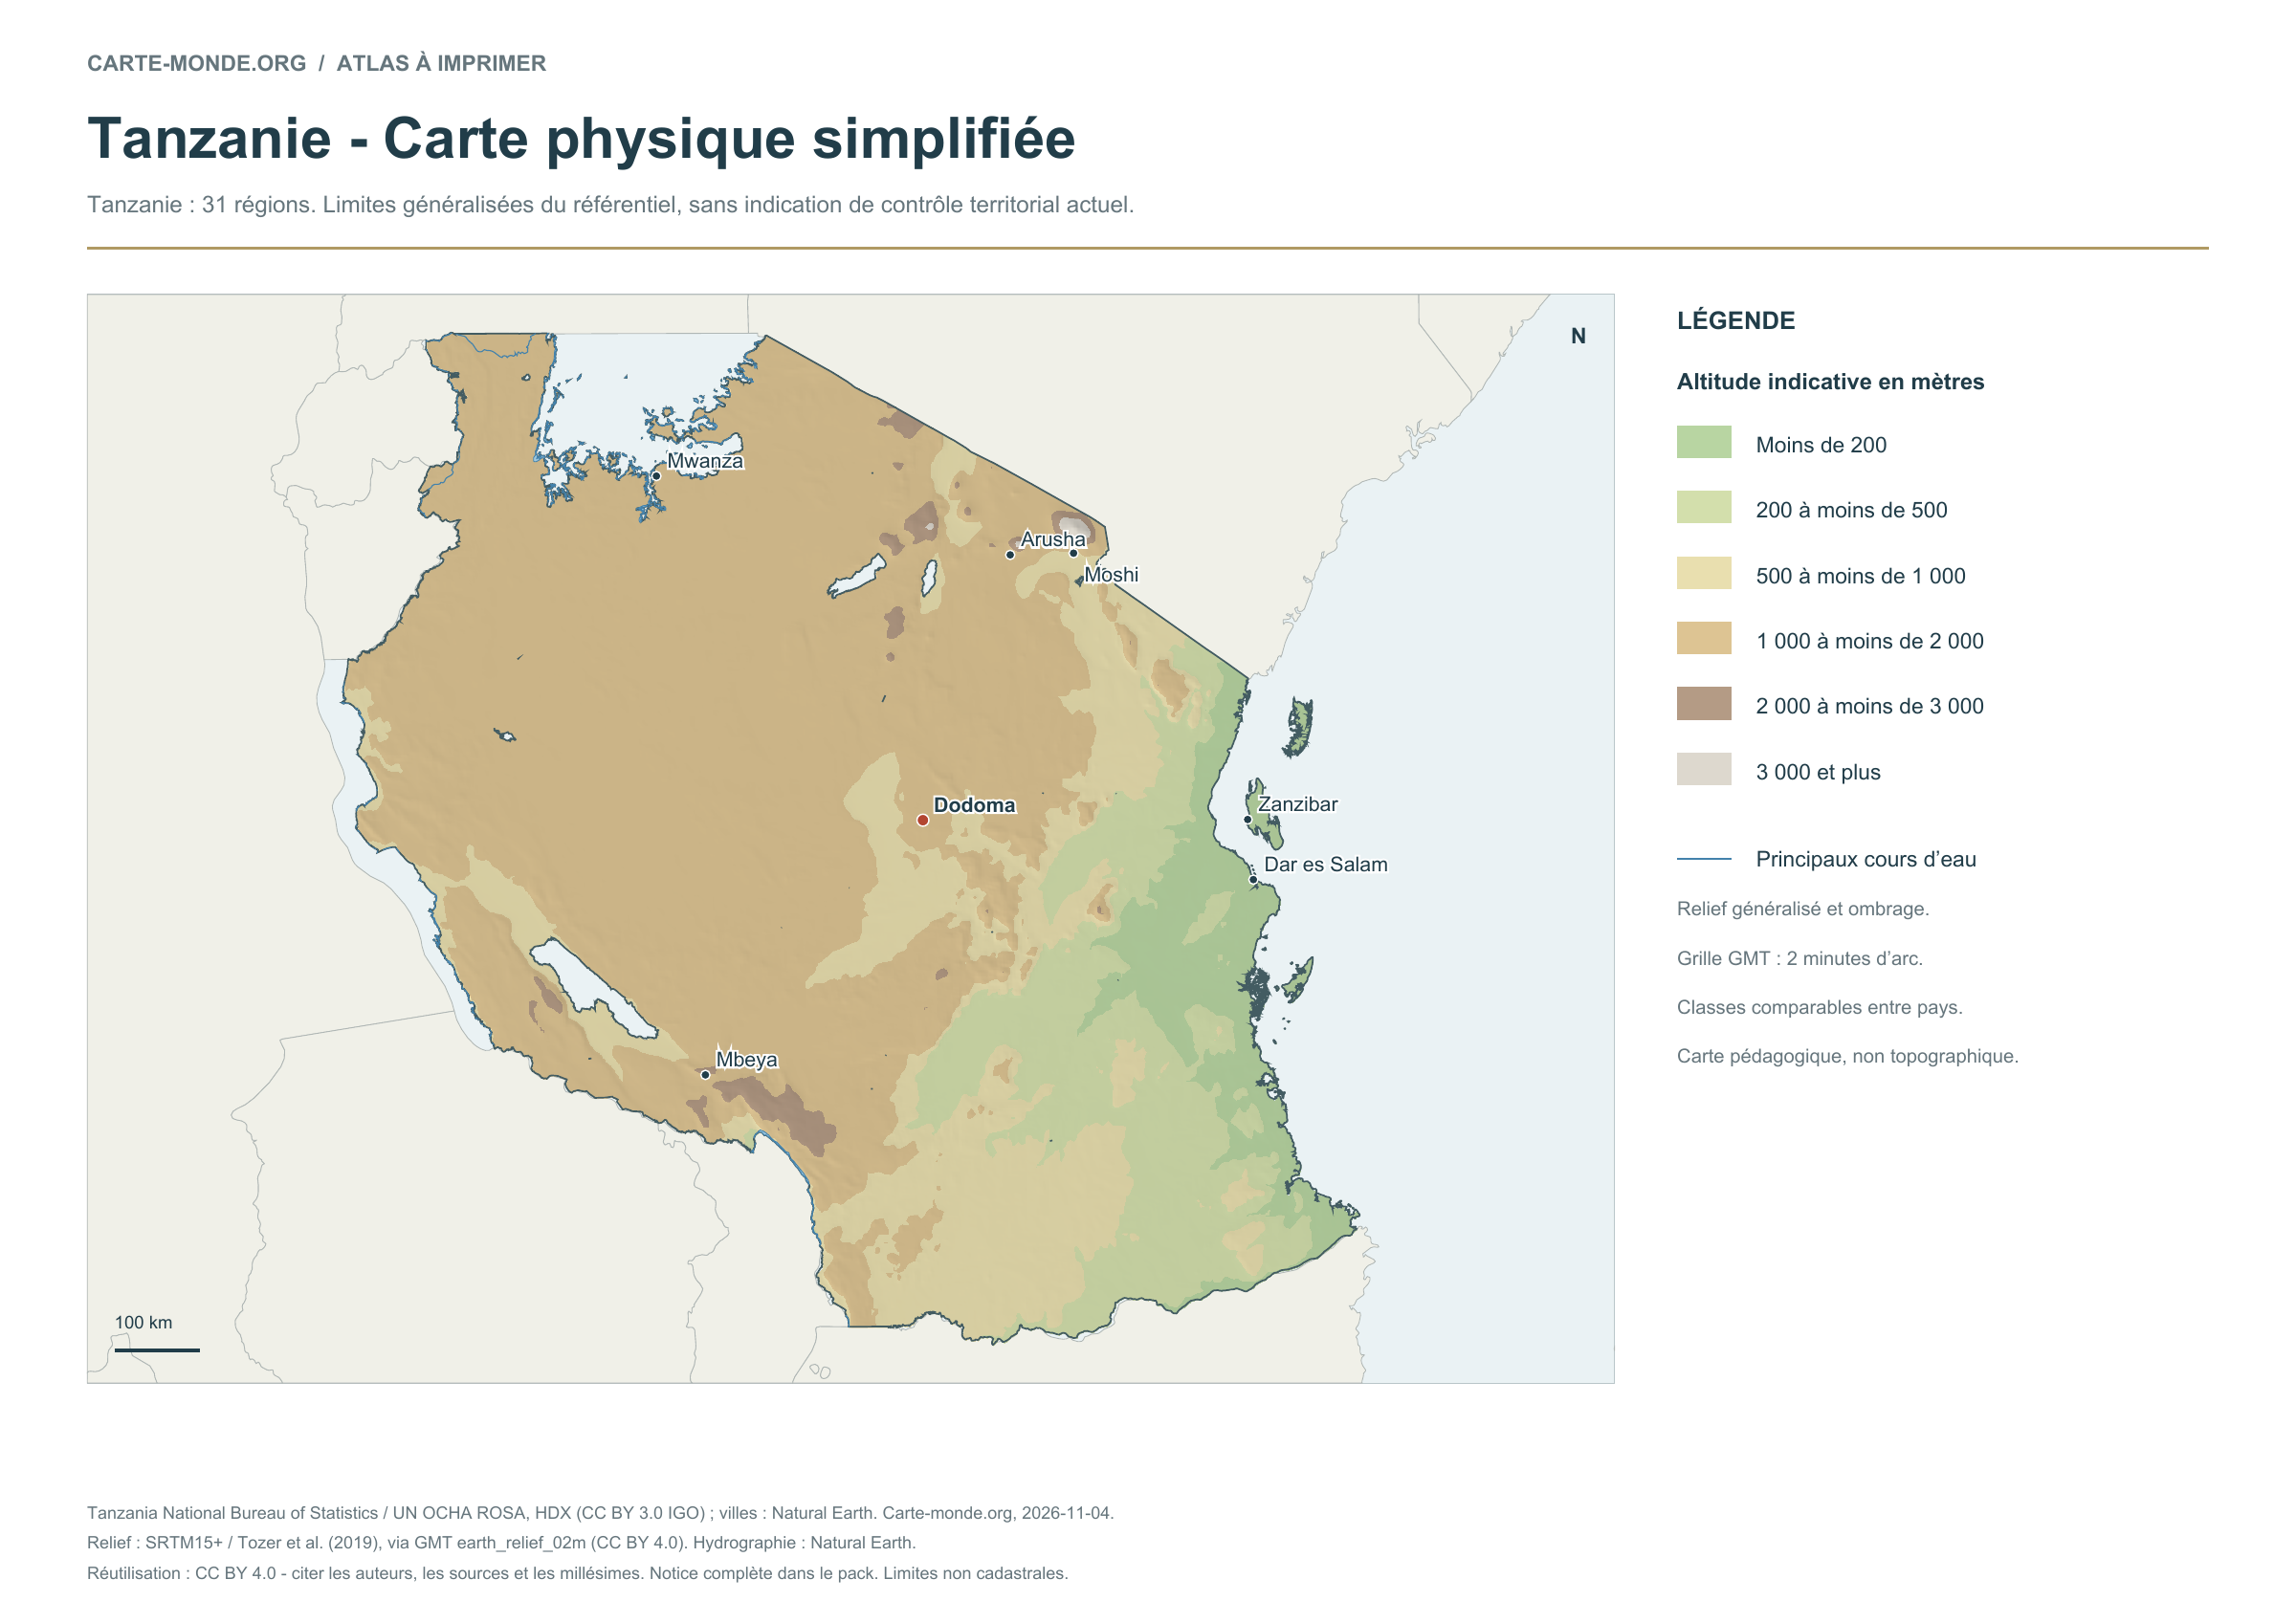
Simplified elevations
Colour bands show elevation in metres, with hill shading and simplified waterways. The map is a general overview.
PDF A4 · PNG · CC BY 4.0
Carte-monde.org · November 2026
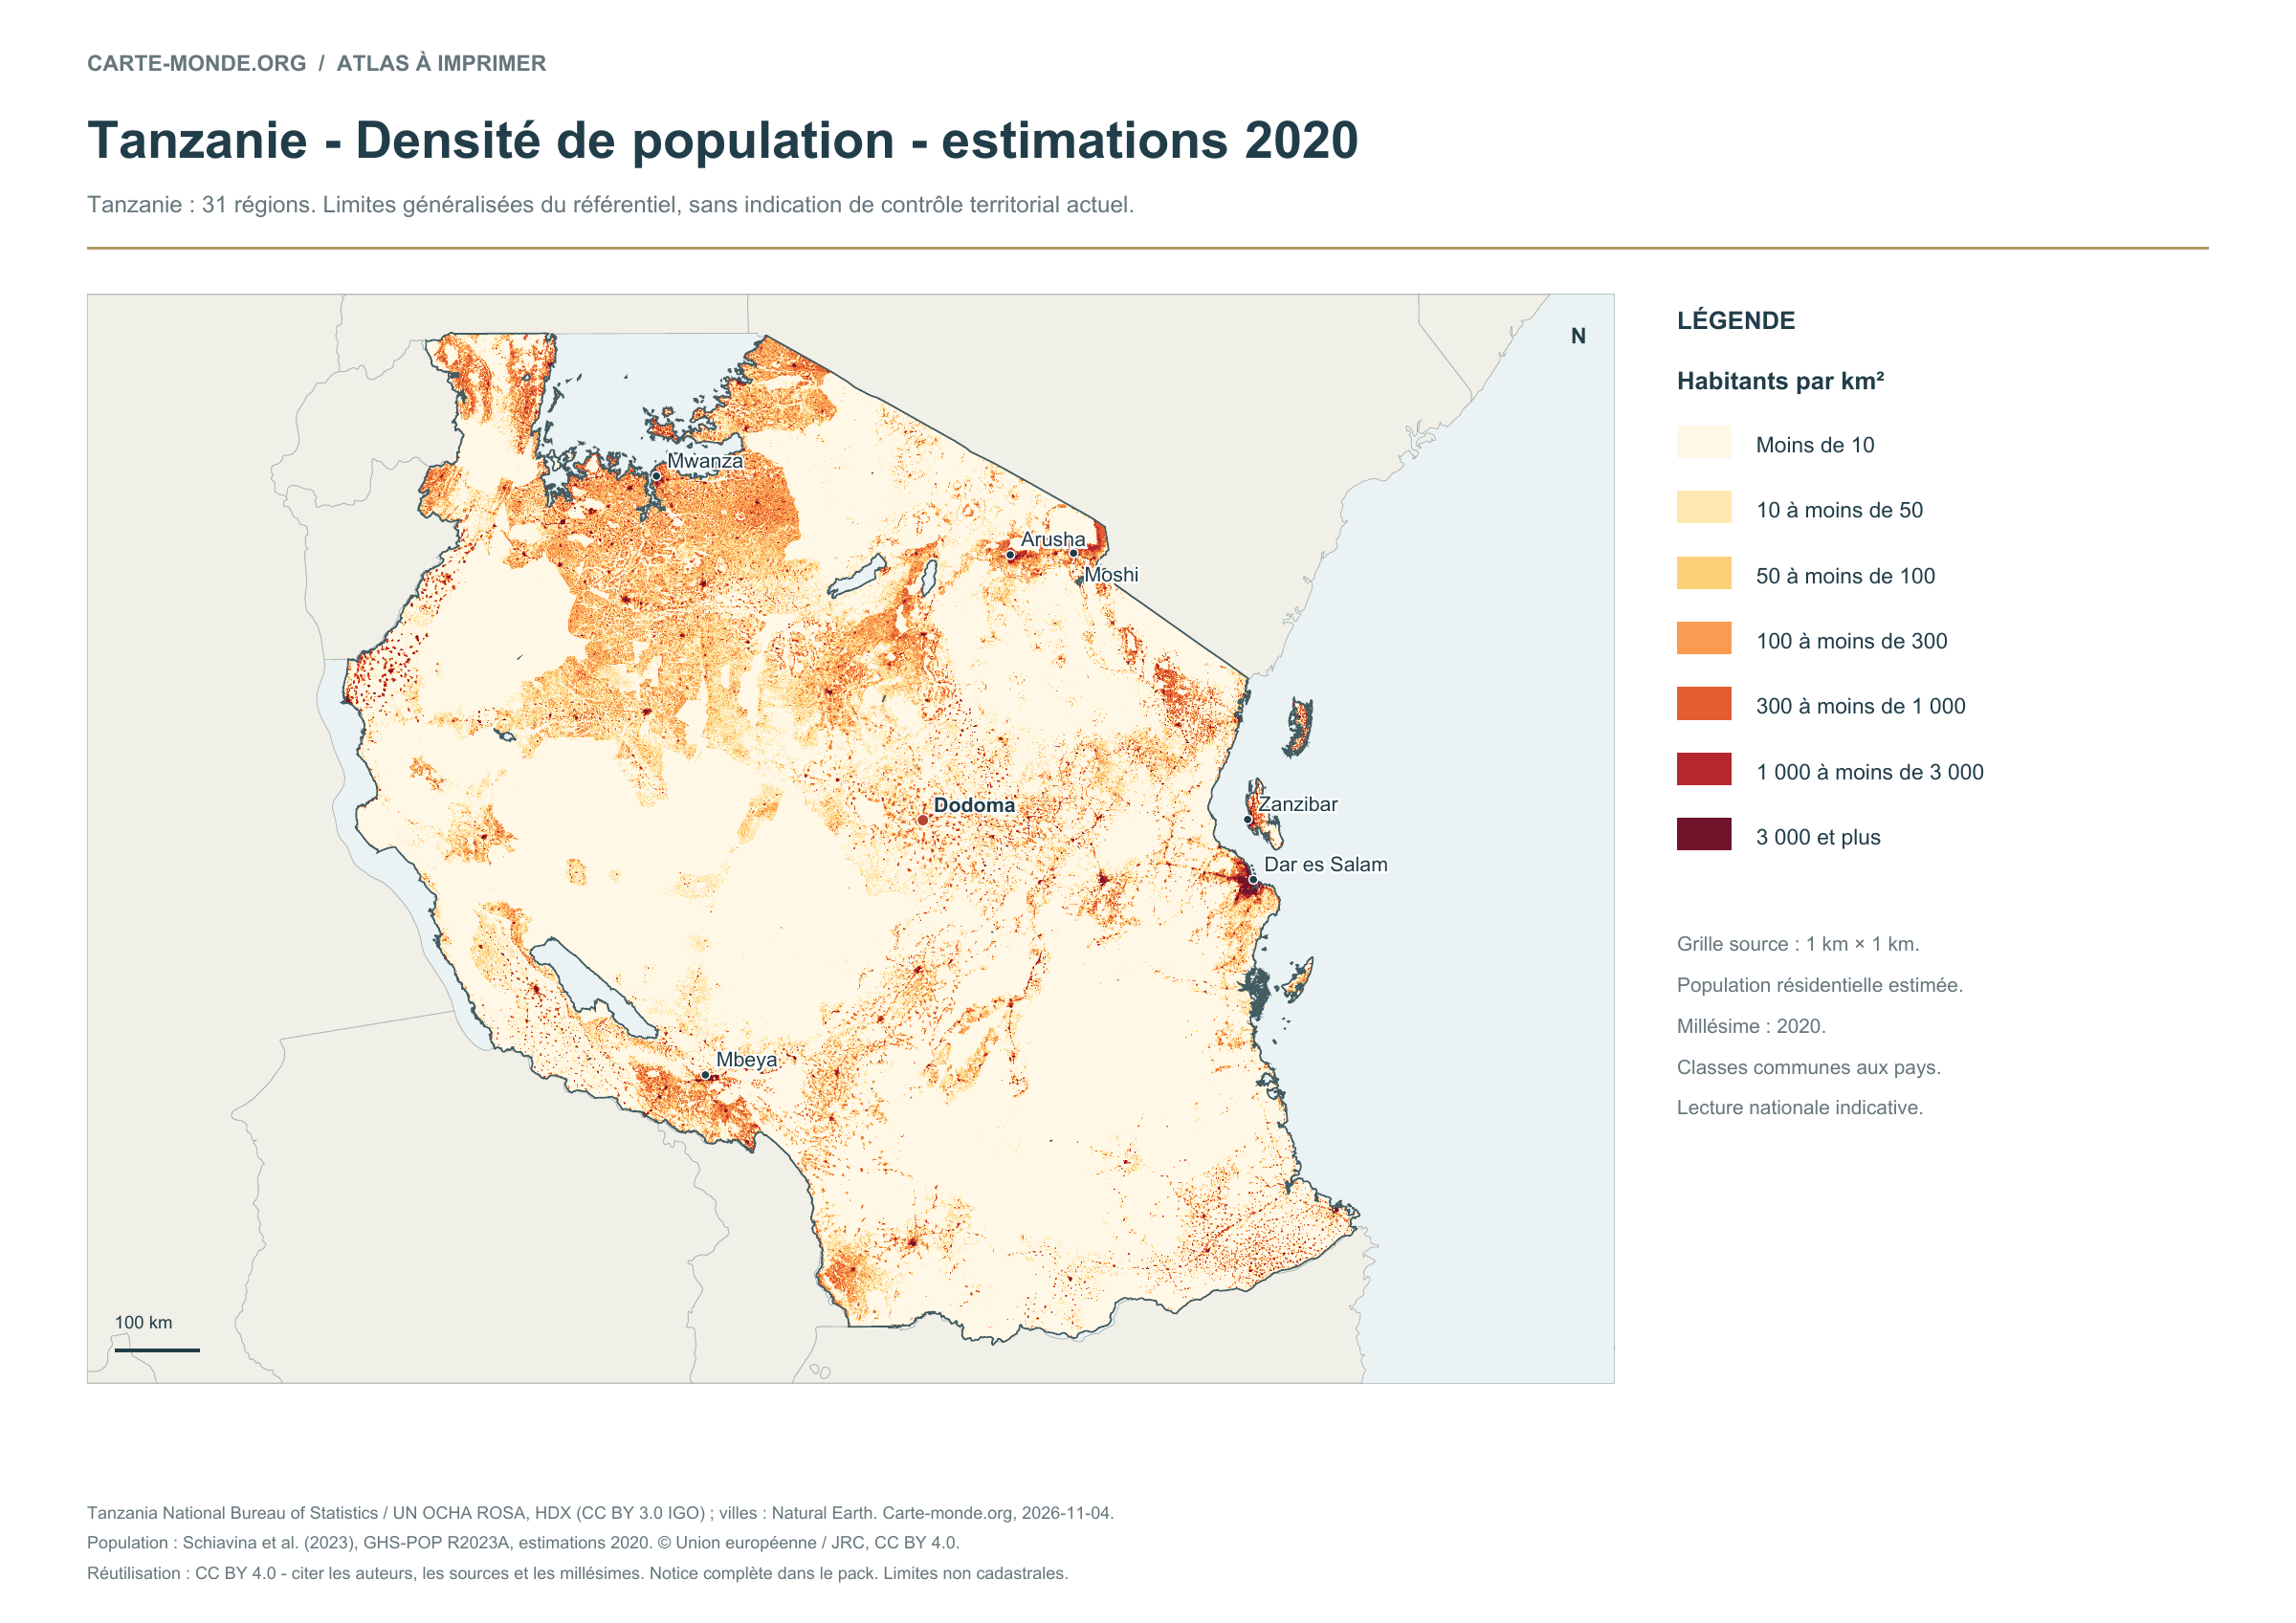
Population density — 2020 estimates
Residential estimates for 2020 on a 1 km² grid, with comparable classes in people per km². Missing cells are transparent. Some small insets may show only outlines.
PDF A4 · PNG · CC BY 4.0
The four maps in one pack
A4 PDF, PNG, SVG, geometries, sources and licences.
Six blank maps for exercises
Sources, reference years and reuse
Boundaries and divisions: Tanzania National Bureau of Statistics / UN OCHA ROSA, HDX. Licence: CC BY 3.0 IGO. Source and terms. Reference date: 2018. Boundaries are generalised and do not represent cadastral boundaries or current territorial control.
Coverage: Tanzania: 31 regions. Generalised reference boundaries do not show current territorial control.
Cities and context: Natural Earth 5.1.1, public domain. Selection for educational use, without a current population ranking. Capitals with different functions are marked in countries with more than one.
Relief: SRTM15+ / Tozer et al. (2019), via GMT earth_relief_02m, CC BY 4.0. Grid generalised to two arcminutes. Colours show elevation bands in metres.
Population: Schiavina et al. (2023), GHS-POP R2023A, residential population estimates 2020, © European Union / JRC, CC BY 4.0. Source grid: 1 km², expressed as people per km². Areas without data are transparent and do not imply zero population. Coverage and resolution may be limited on small islands.
Our new maps: CC BY 4.0. The packs include derived geometries and full credits. Original data licences and rights on earlier maps still apply.
Earlier maps of Tanzania from the original collection
The files below retain their original URLs, credits and rights. Some divisions may be historical.
| Maps of Tanzania | |
 |
 |
 |


