
NETHERLANDS · PRINTABLE MAPS
Five printable maps of the Netherlands: regions and cities, location in Europe, two views of the relief and population. PDFs, images and sources are available below.
Map labels and downloadable files remain in their original language, often French.
Regions, cities and location in Europe
Netherlands: 12 reference territorial units.
Carte-monde.org · November 2026
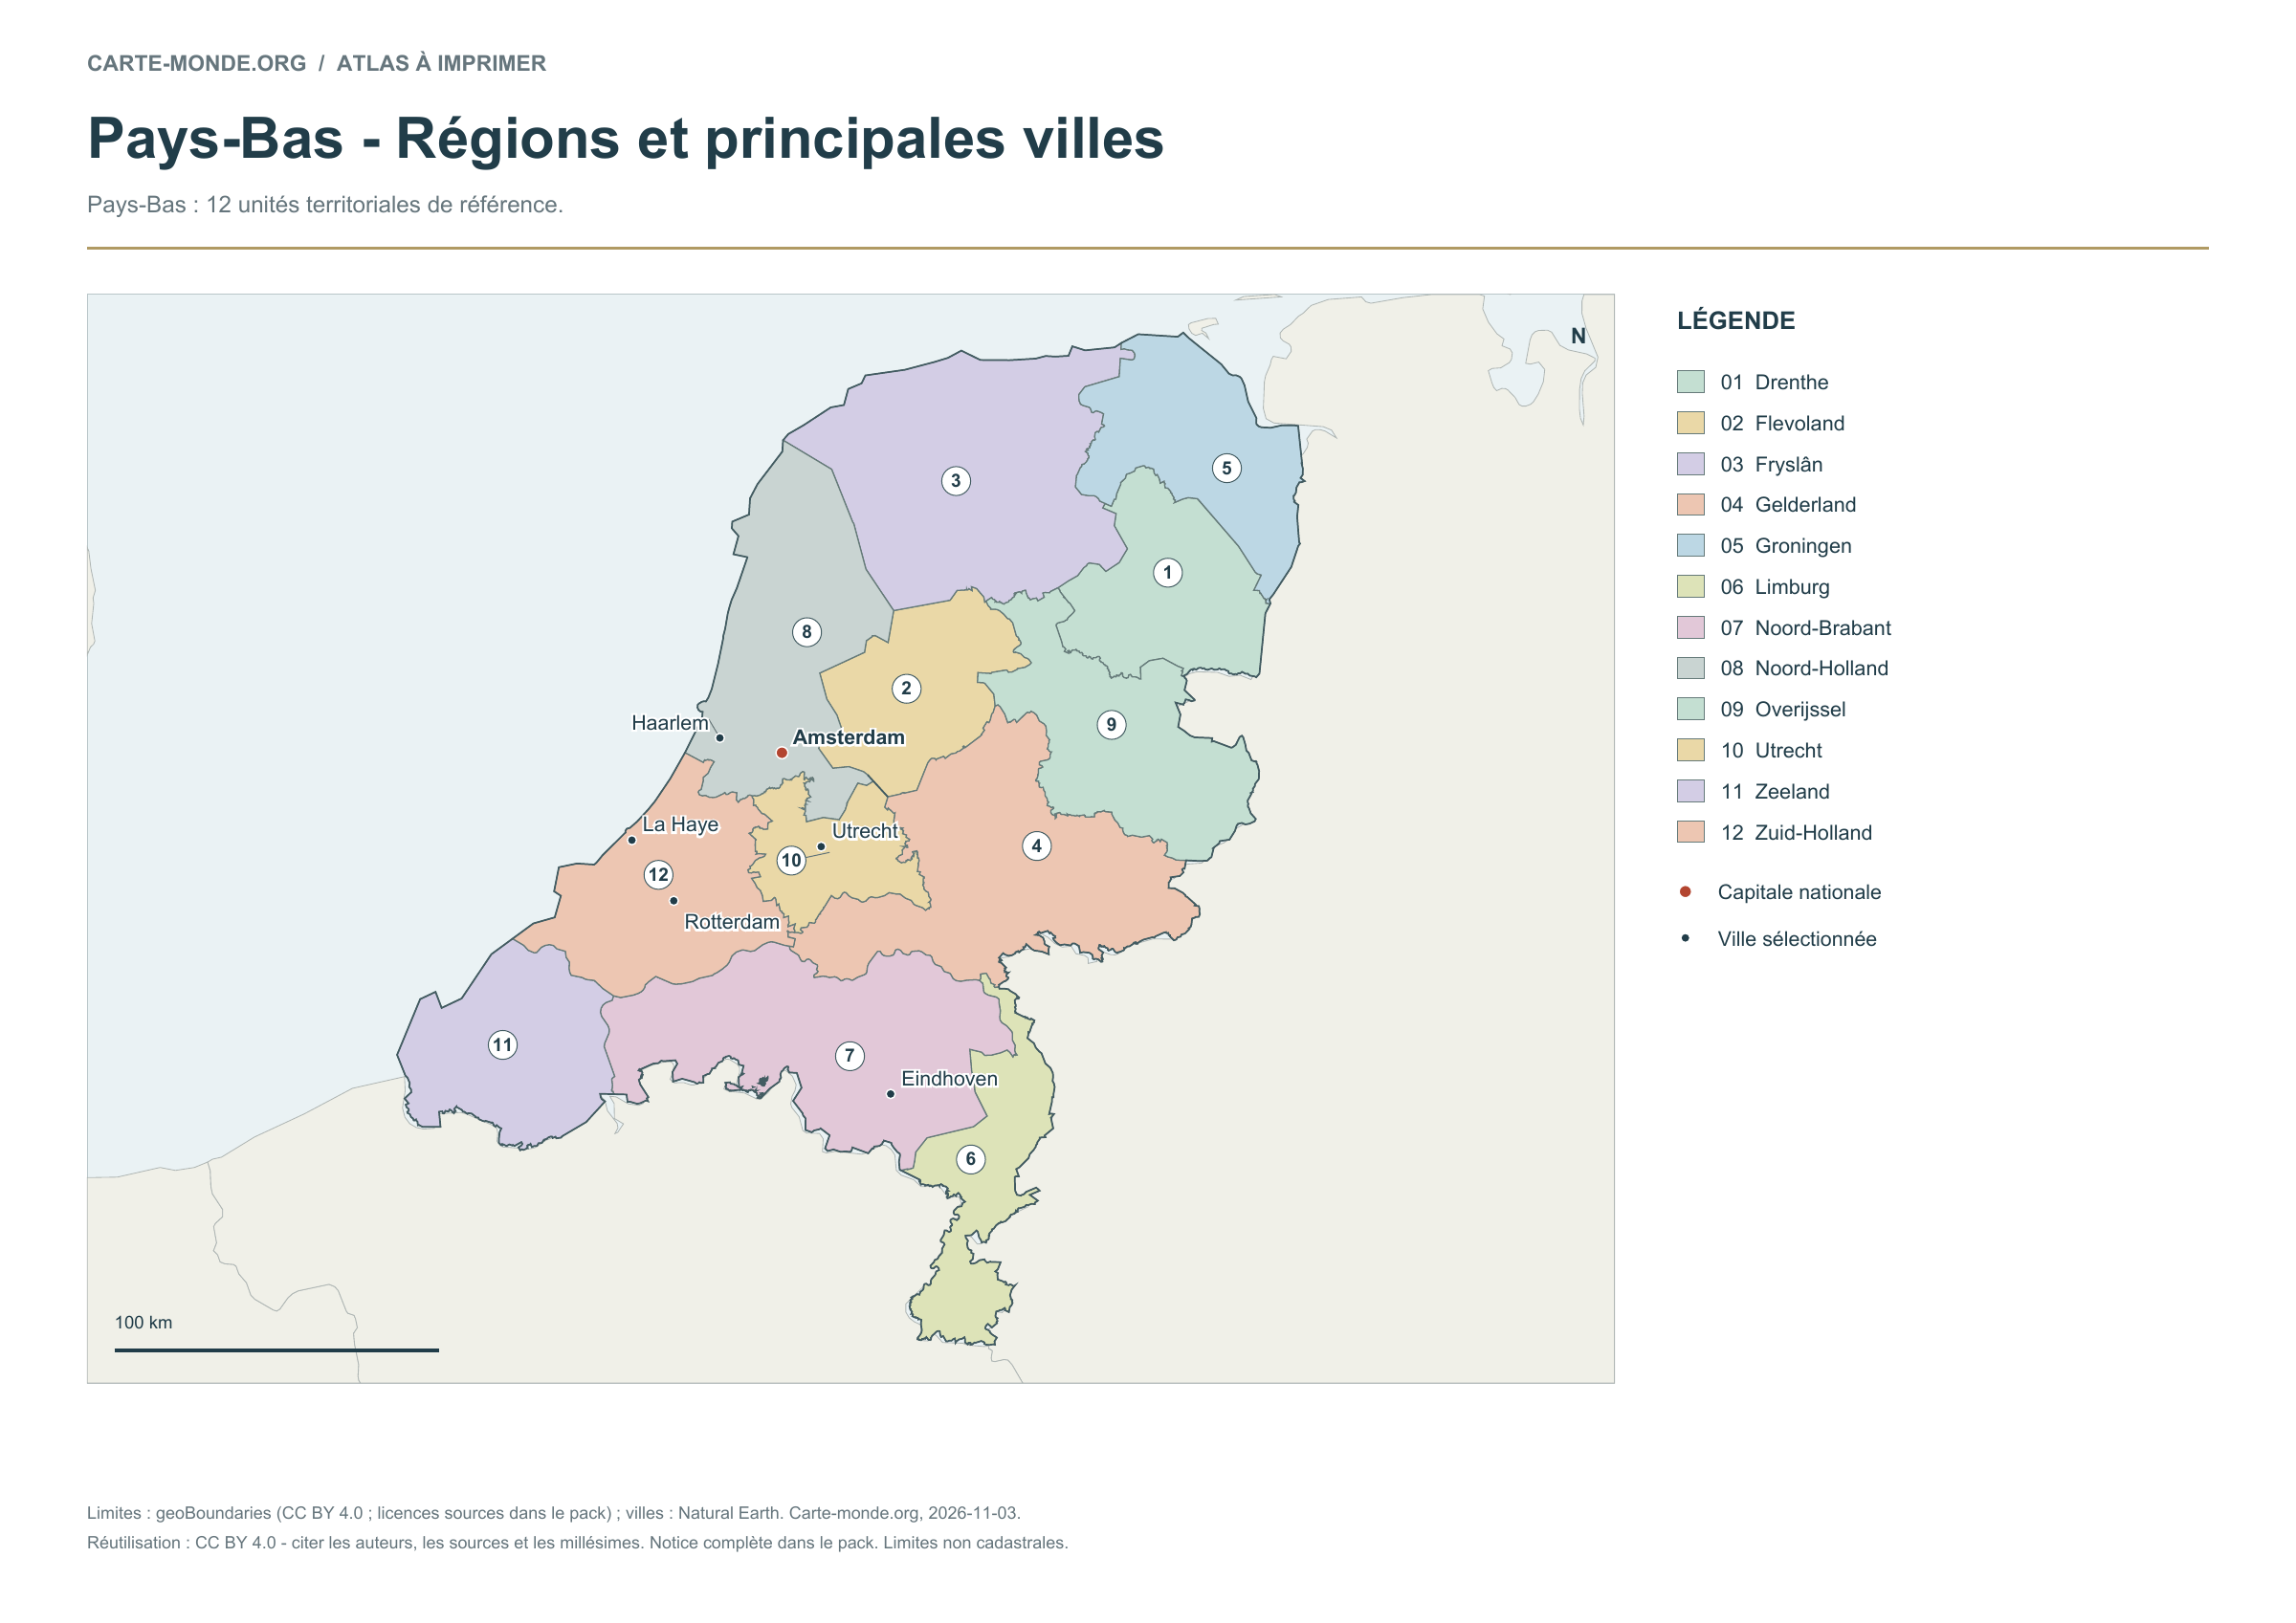
Regions and main cities
The 12 reference territorial units are numbered and named in the key, with selected cities and the capital.
A4 landscape PDF · PNG 2 400 px · CC BY 4.0
Carte-monde.org · November 2026
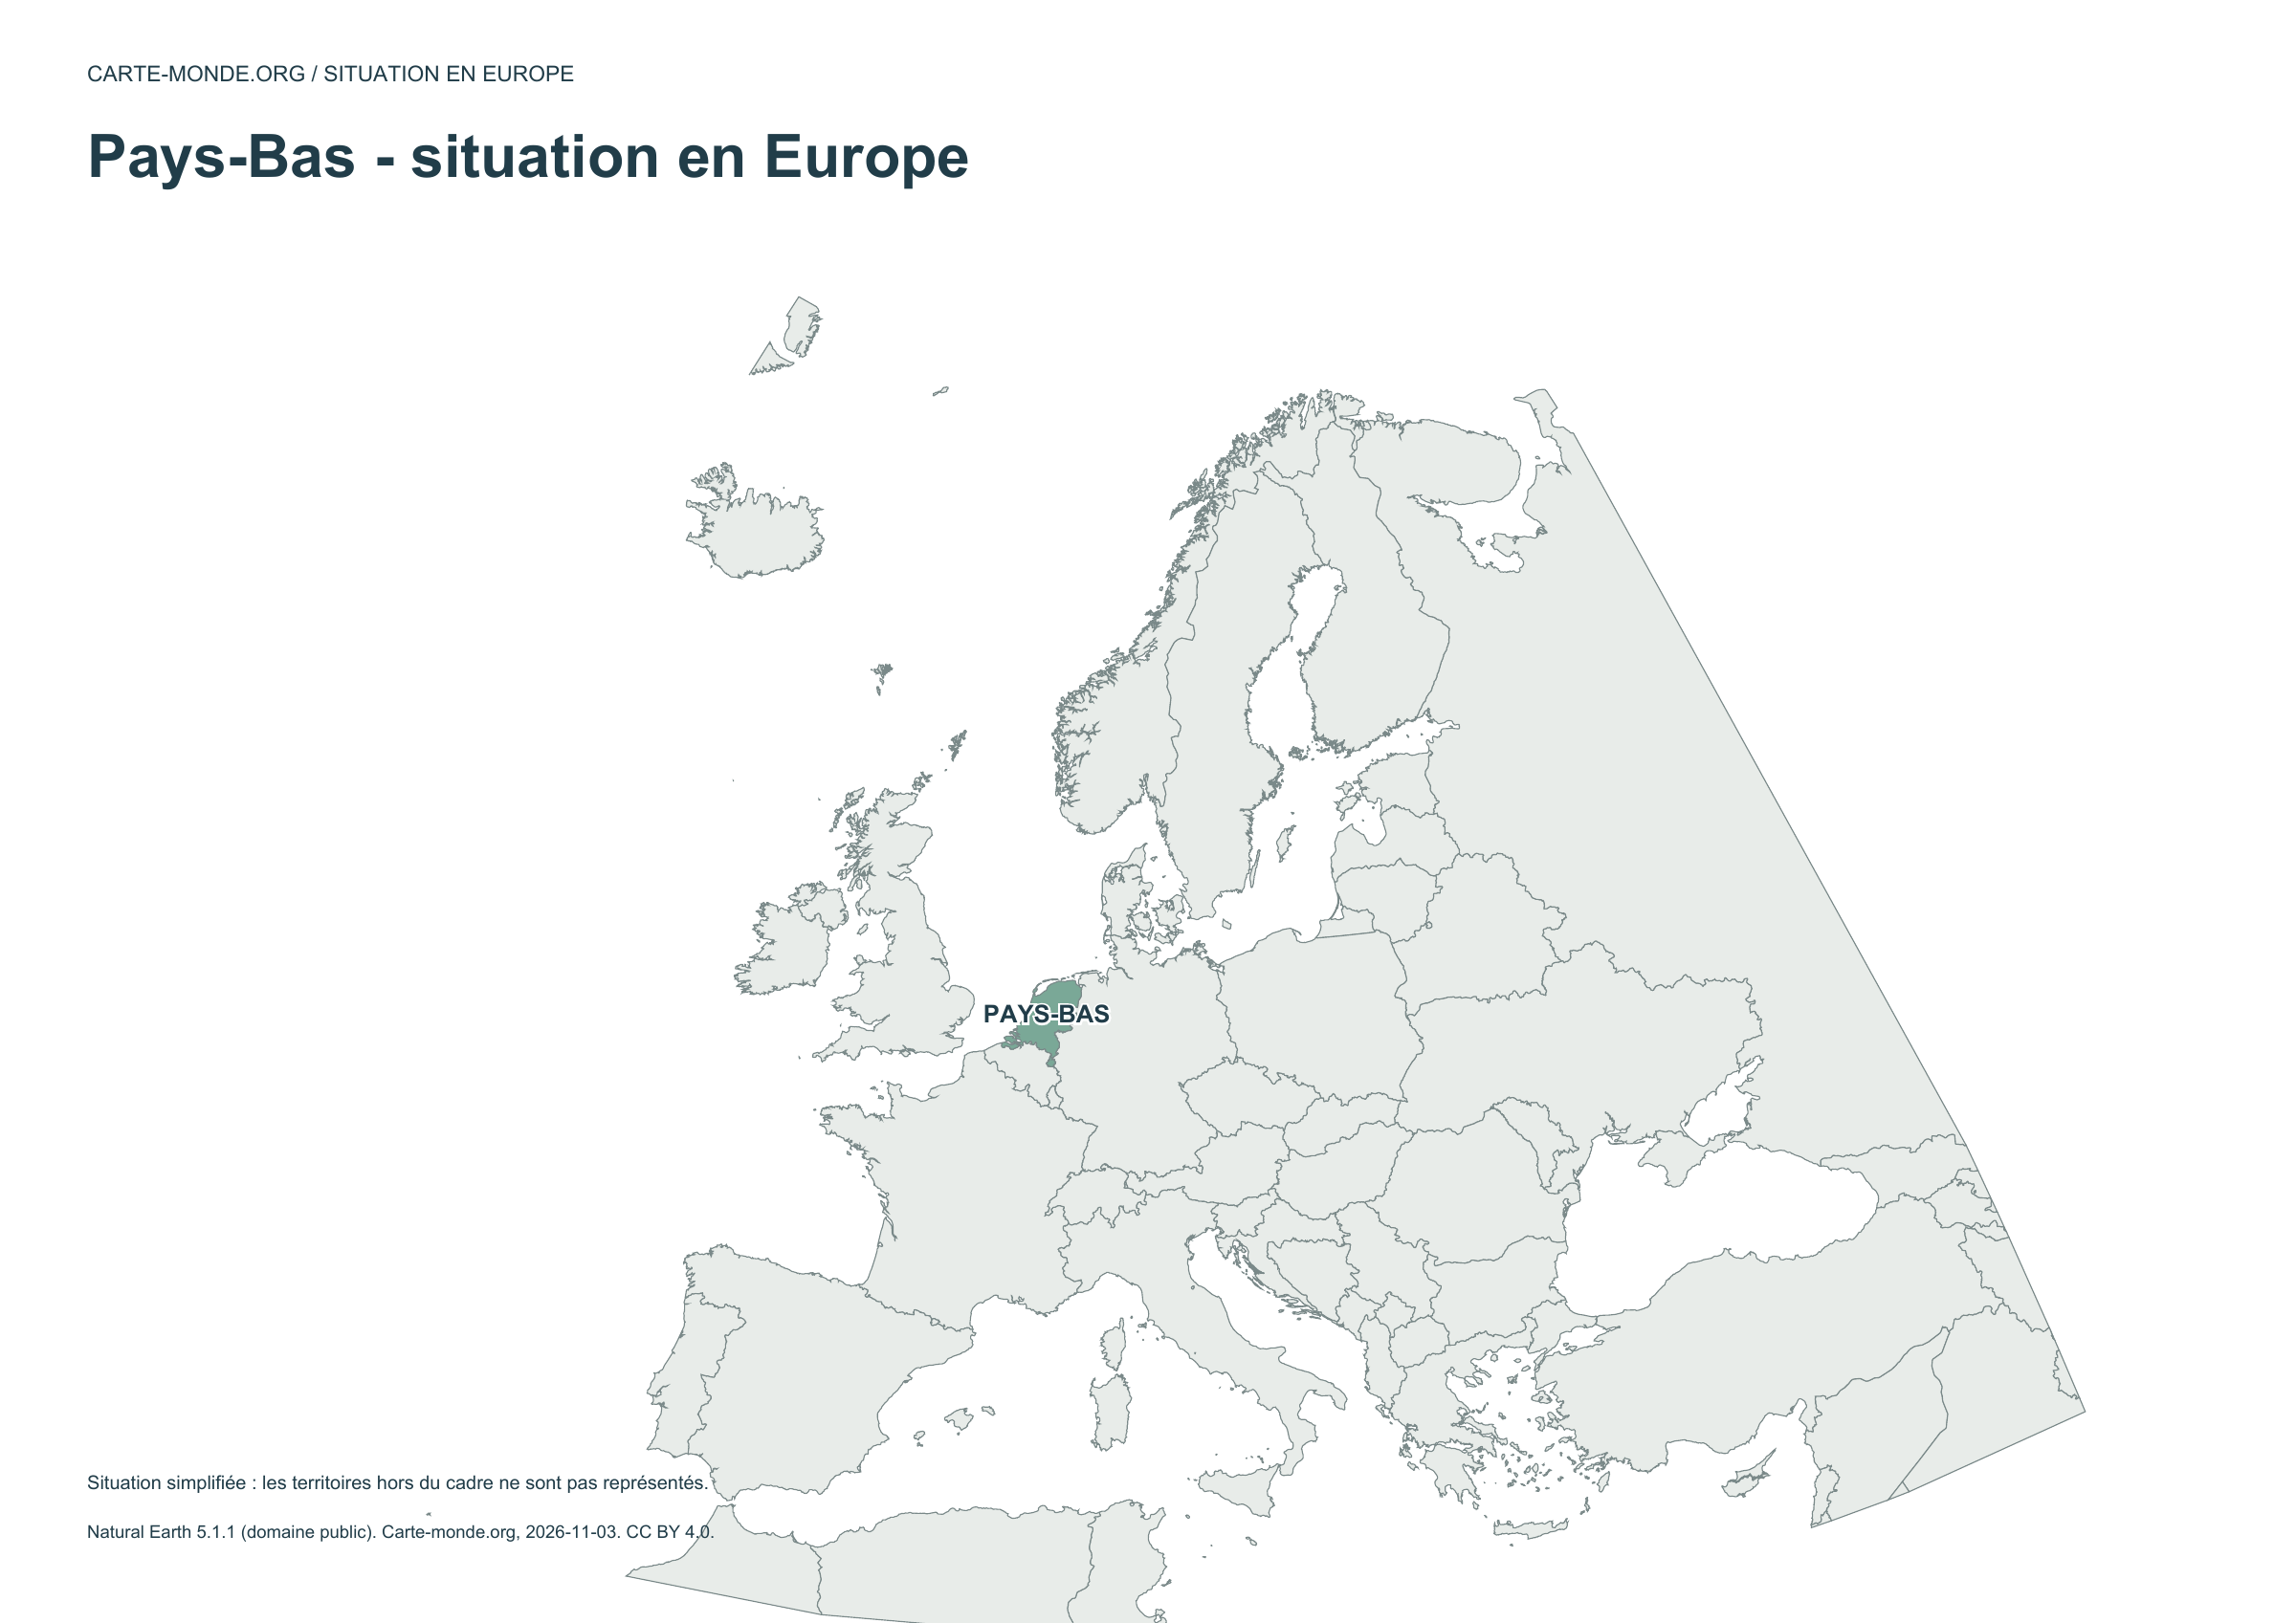
Location in Europe
The country is highlighted within a simplified European frame; territories outside this frame are not shown.
A4 landscape PDF · PNG 2 400 px · CC BY 4.0
Two maps to understand the relief
Choose shaded relief for an overview, or elevation classes for school use.
Carte-monde.org · November 2026
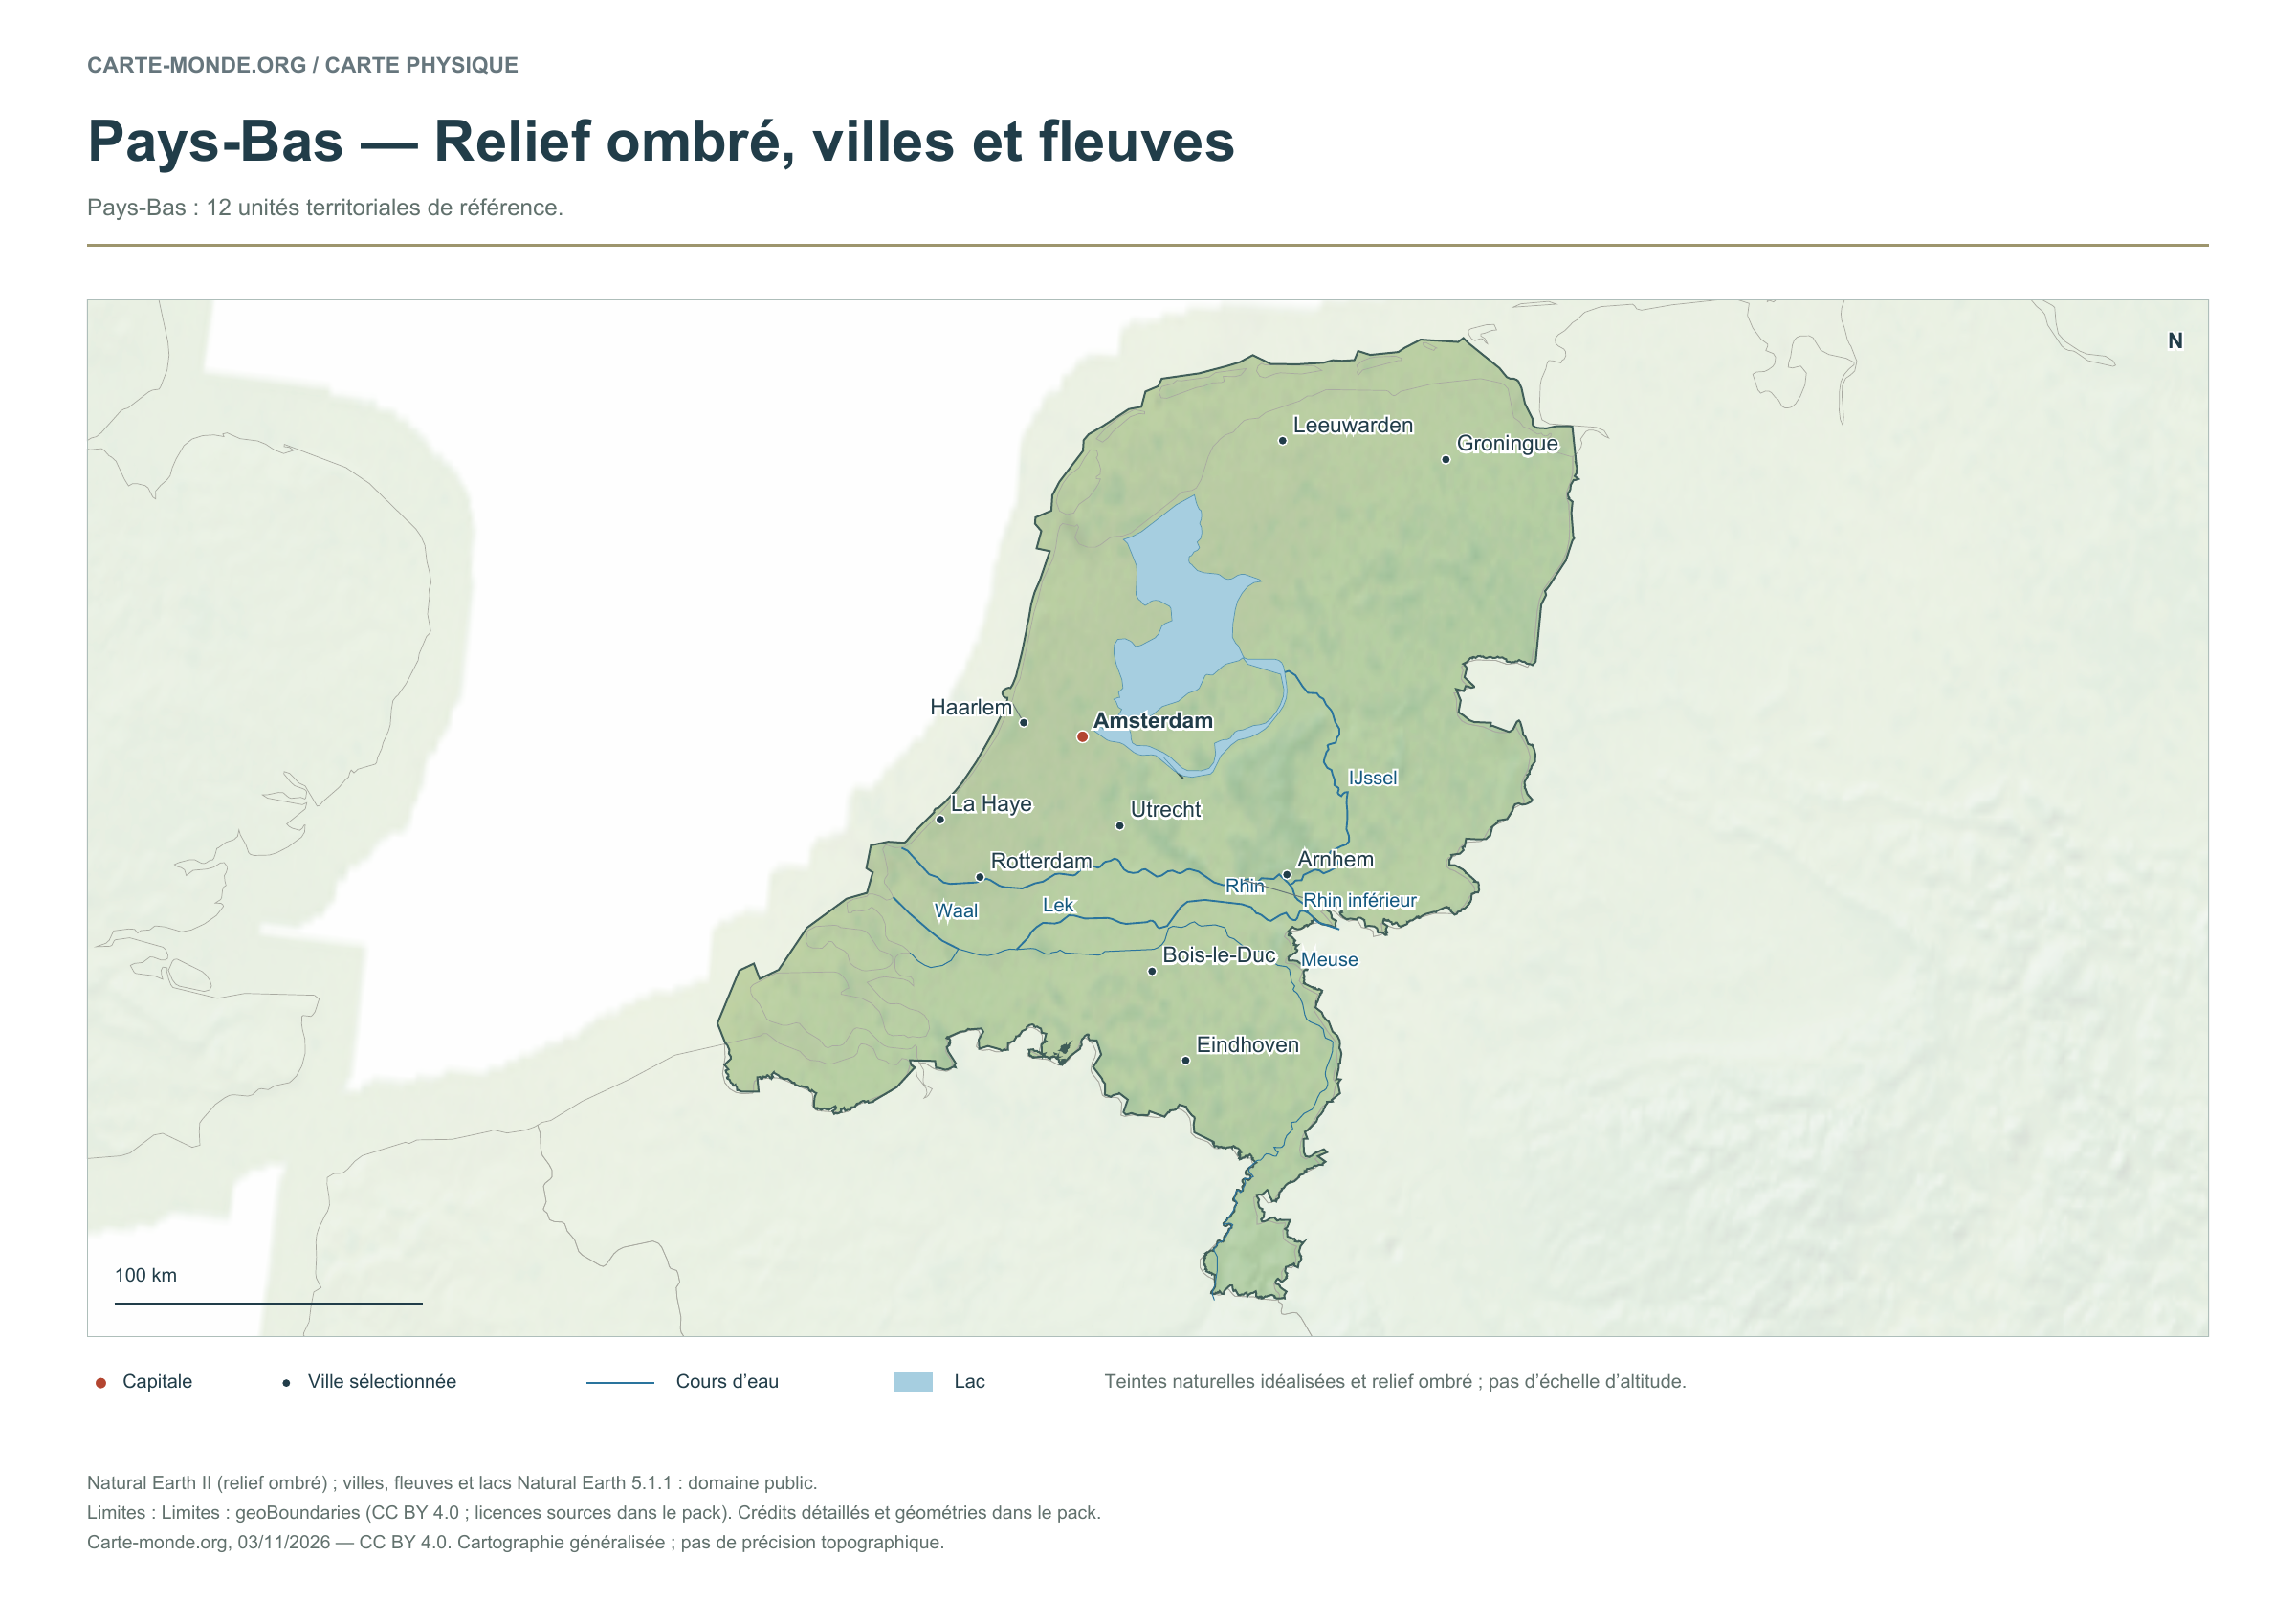
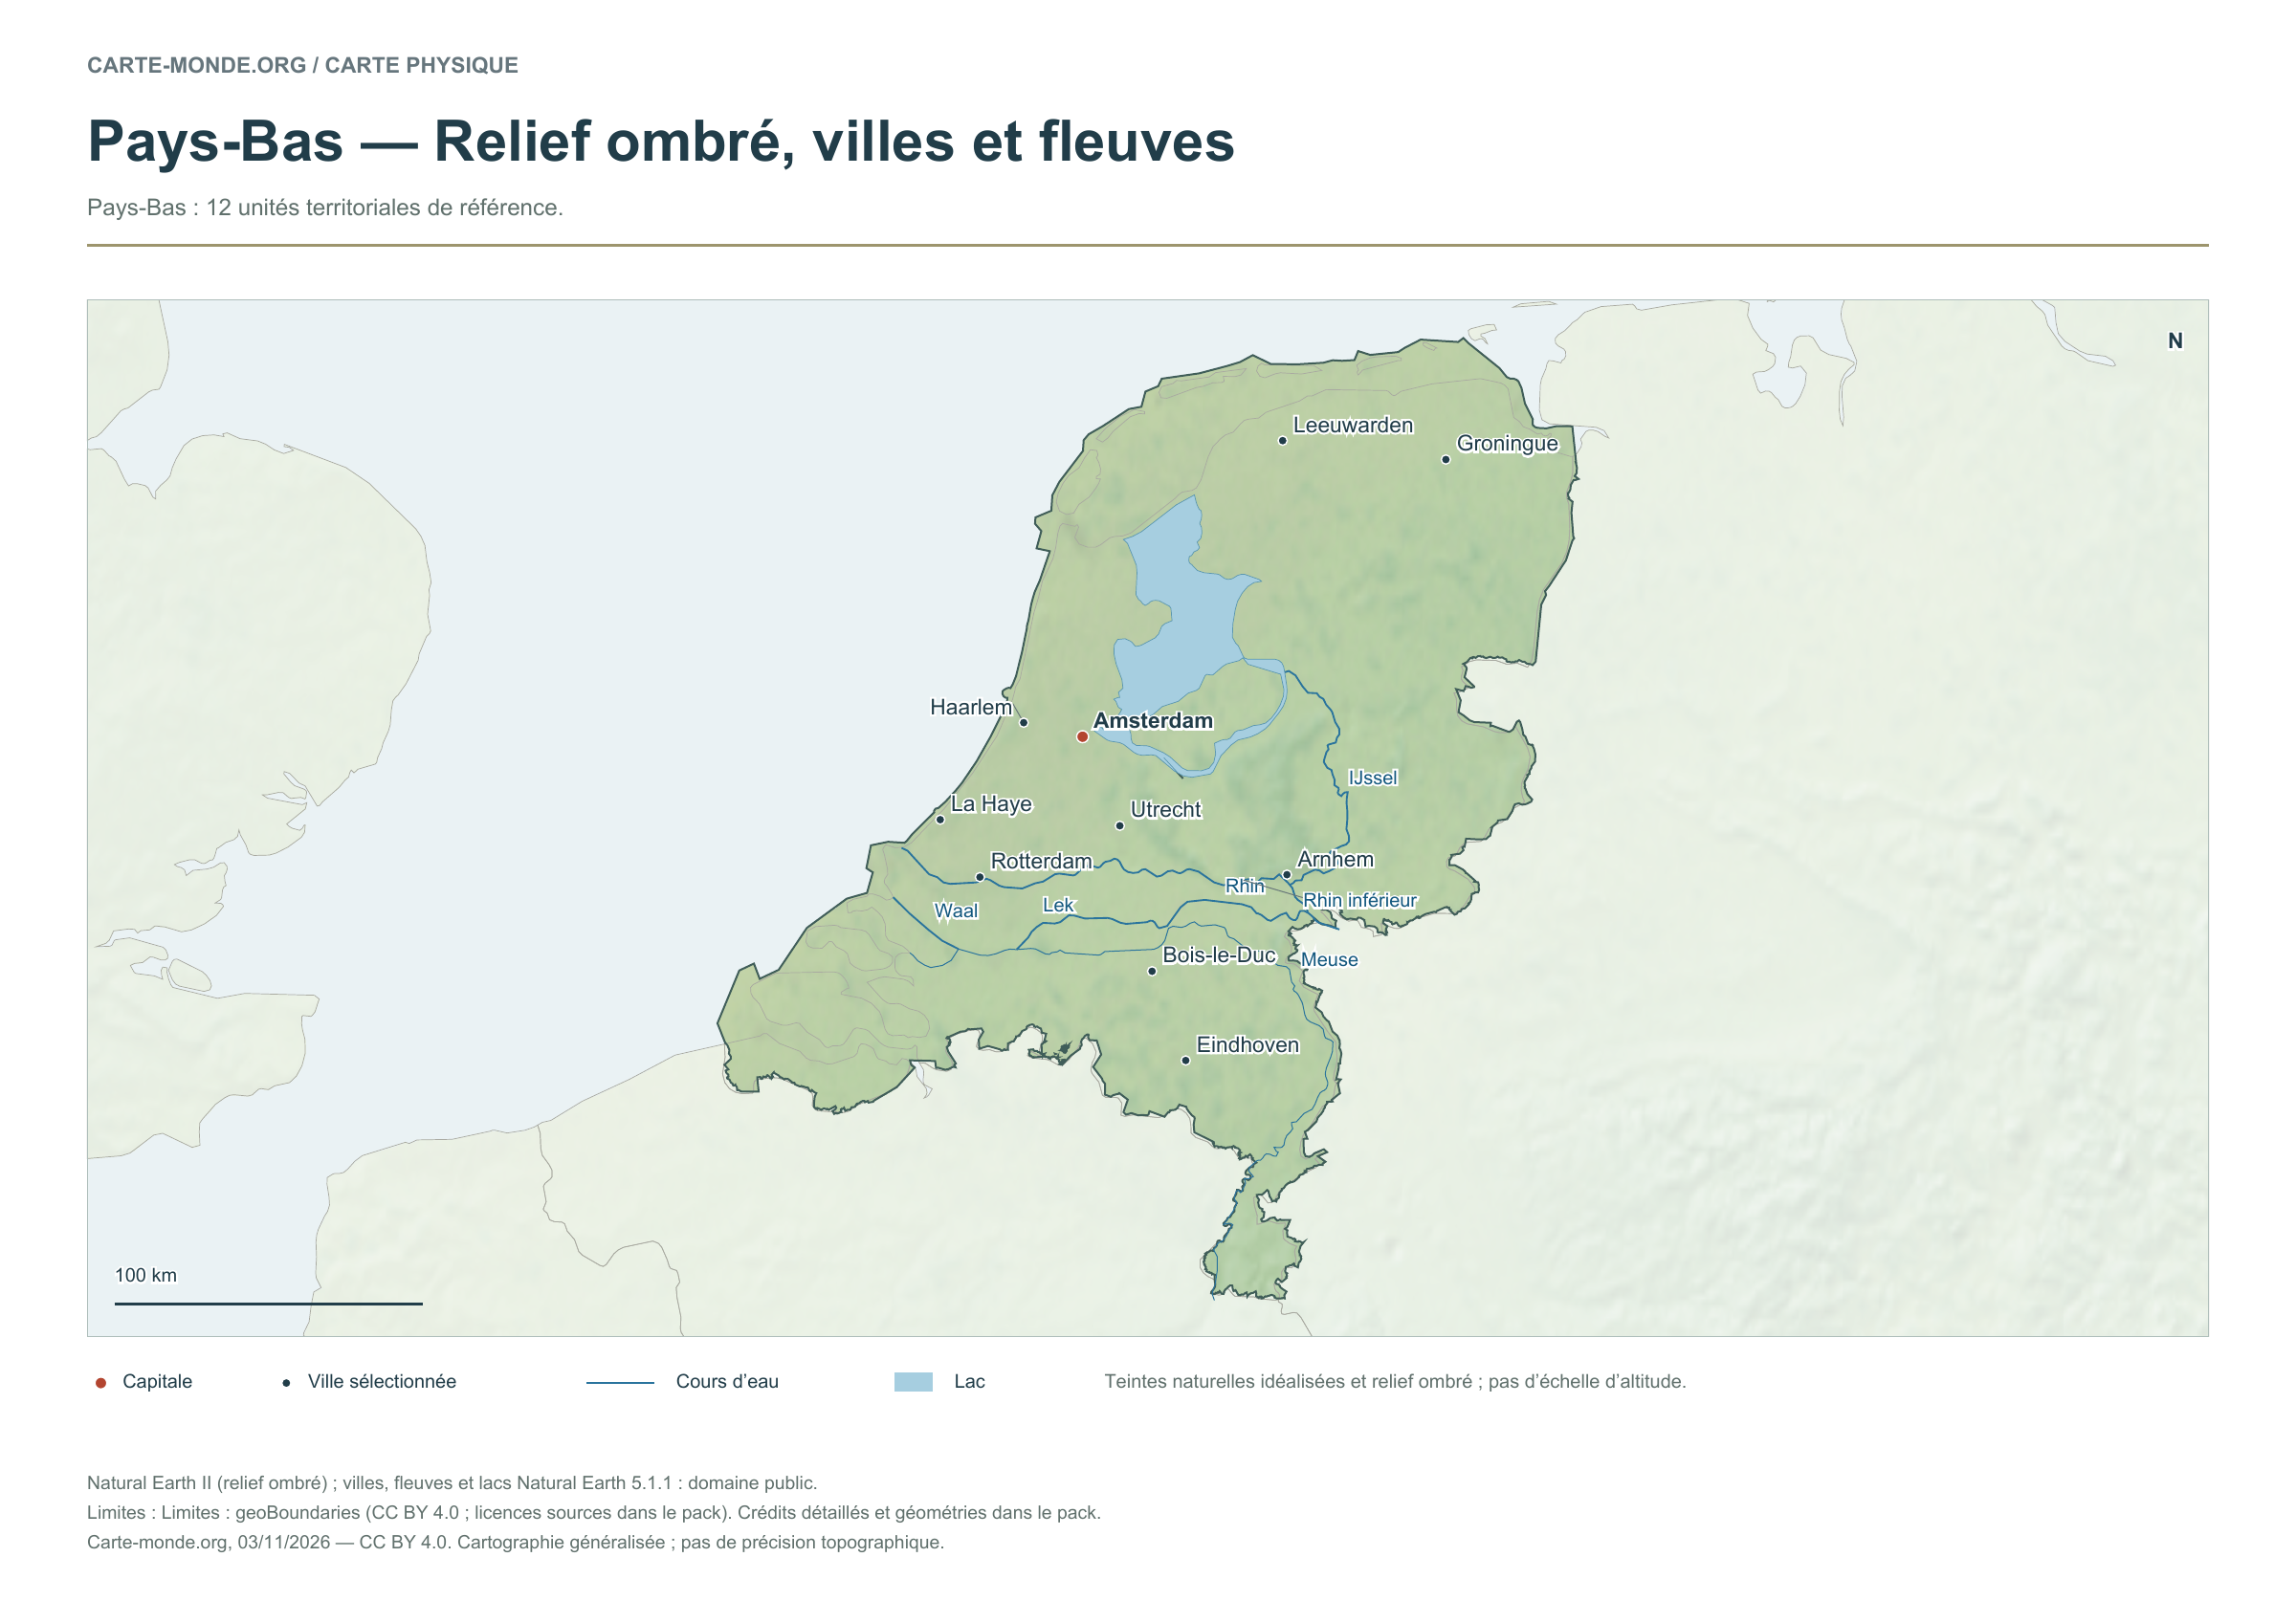
Shaded relief, cities and rivers
To identify major landforms, cities and the river network. The natural colours are not an elevation scale.
Raster base map, cities, rivers and lakes: Natural Earth, public domain. Other boundary credits and licences are retained in the pack. Cartographic work CC BY 4.0; ODbL-derived data retains its licence. No topographic accuracy is claimed.
Territory, data and selection of names
Netherlands: 12 reference territorial units.
Natural Earth II shaded relief base map, 10 selected cities. Named rivers: IJssel, Lek, Meuse, Rhin, Rhin inférieur, Waal.
The colours represent idealised natural cover; they do not correspond to elevation classes. This global background remains generalised, particularly for small states.
Carte-monde.org · November 2026
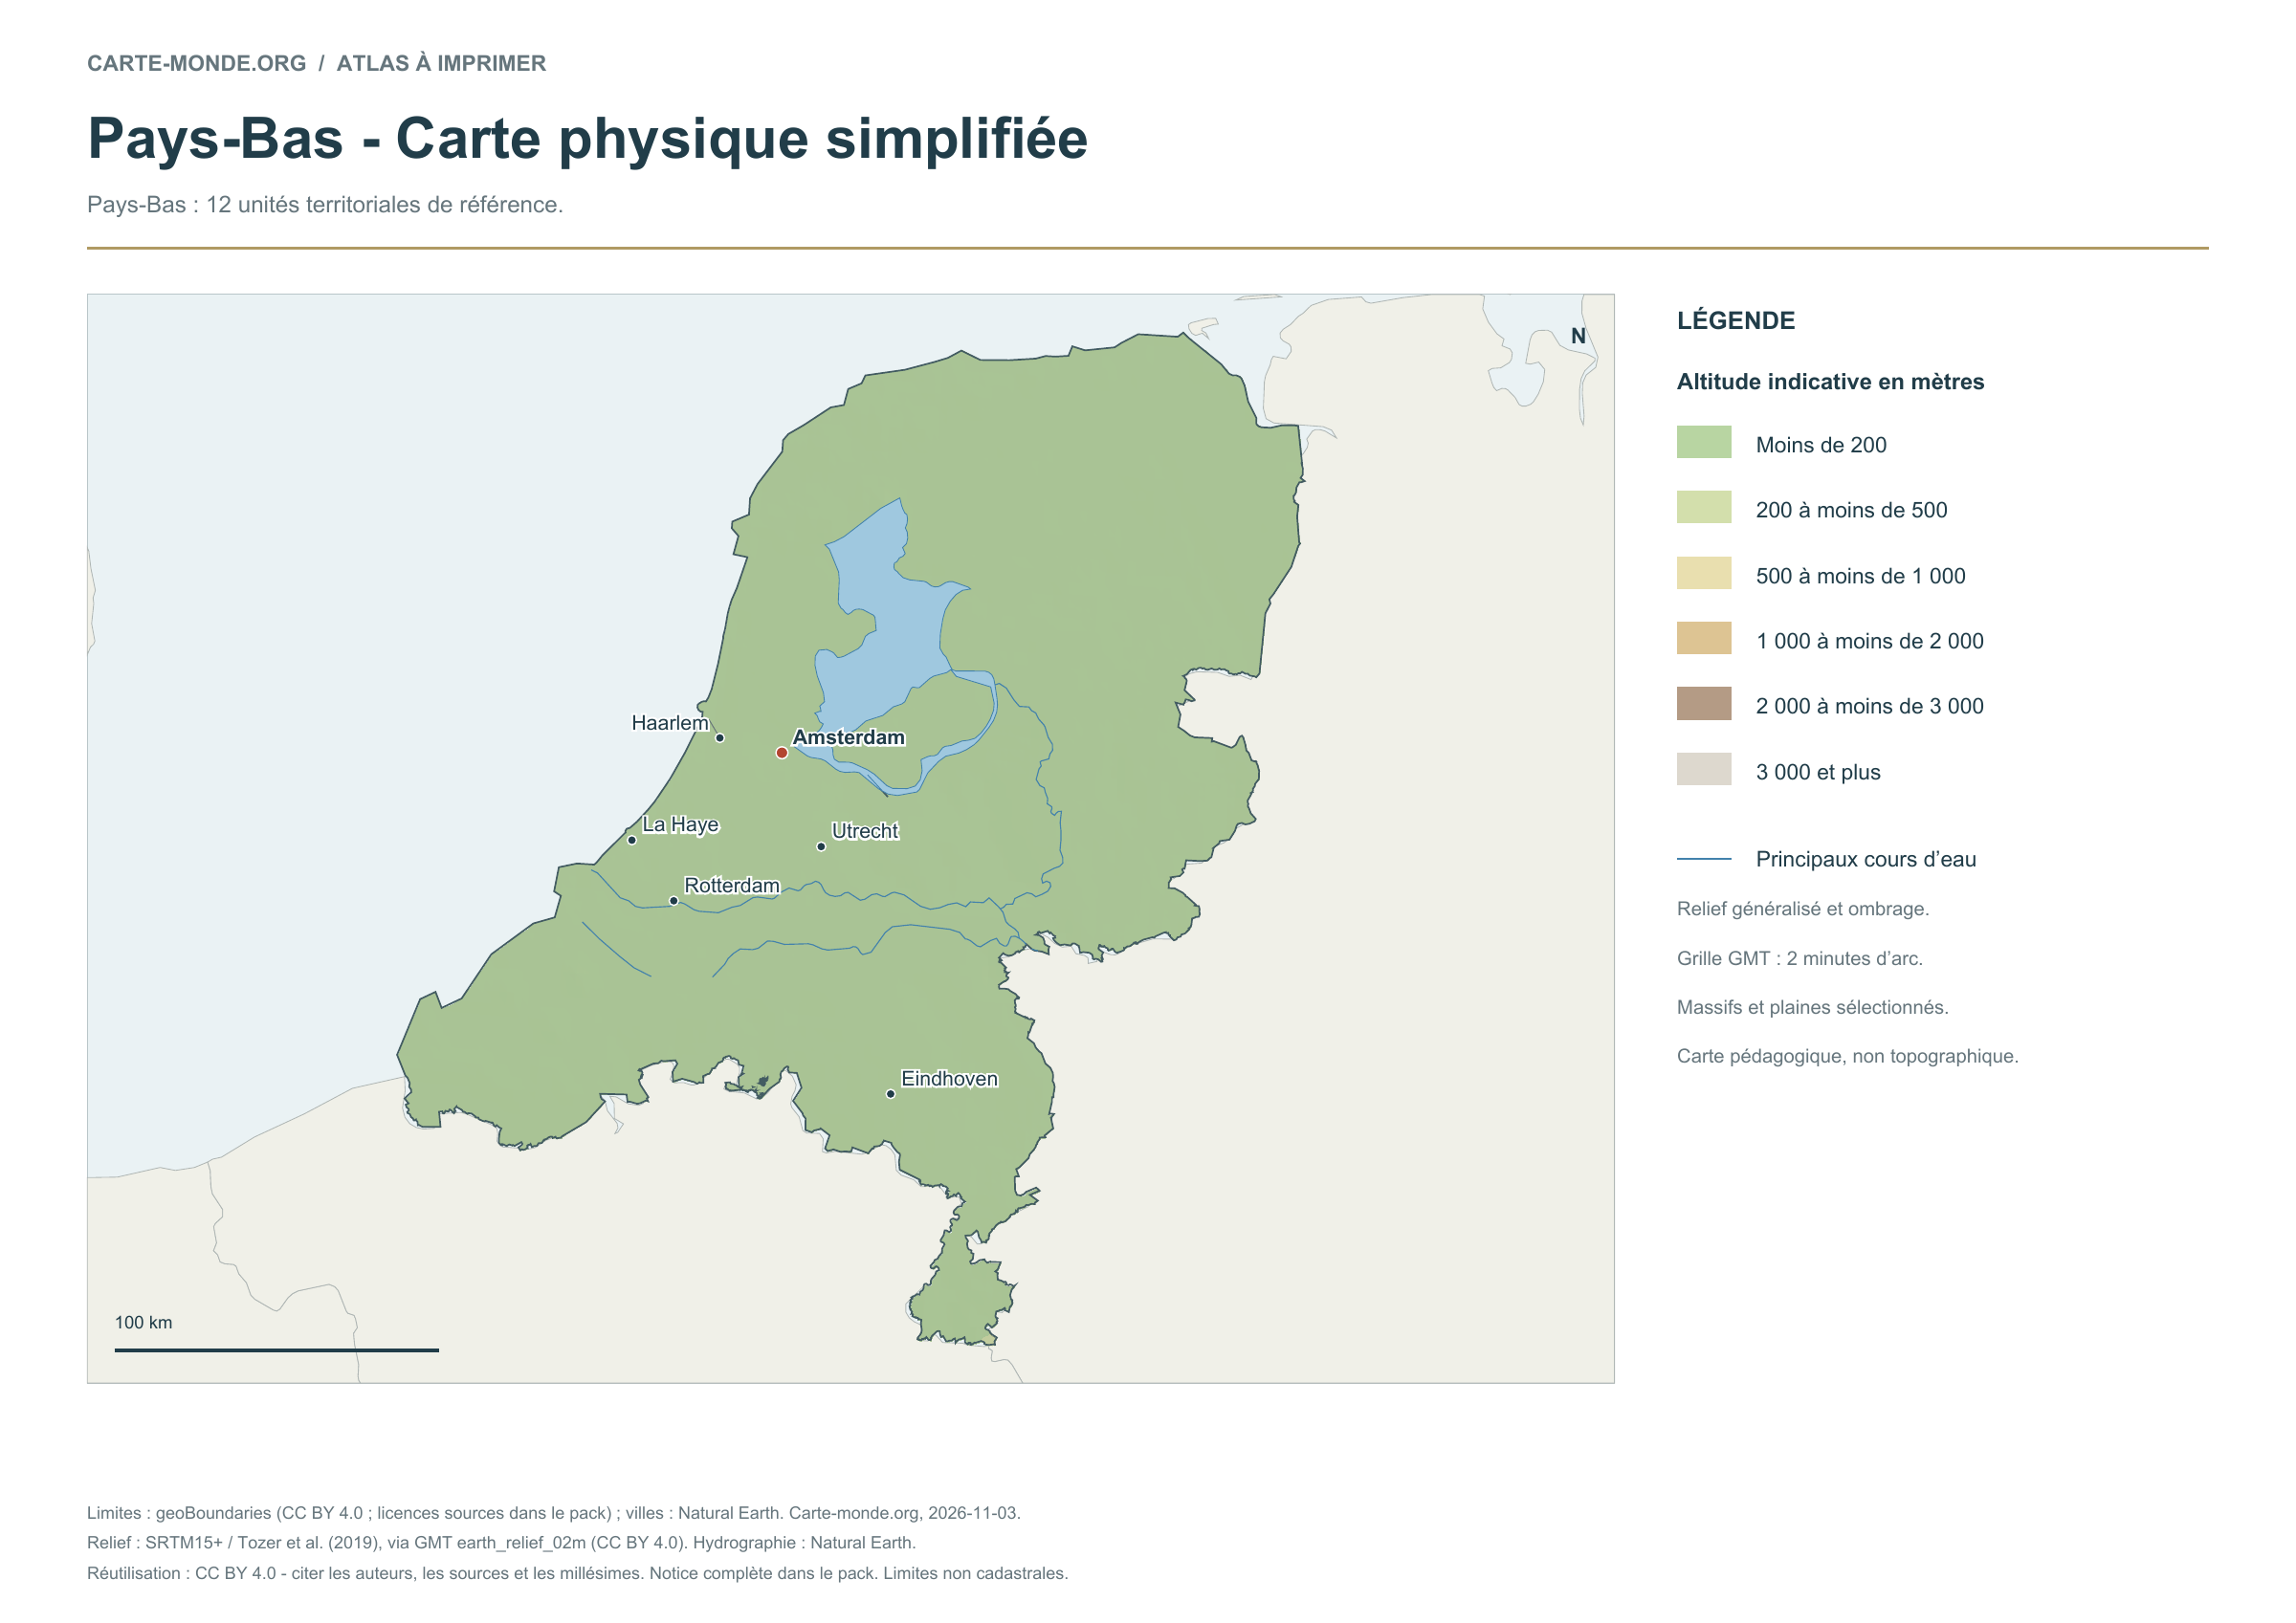
Simplified elevations
Smoothed relief, elevation colours, main mountain ranges, plains and watercourses. Educational map at national scale.
A4 landscape PDF · PNG 2 400 px · CC BY 4.0
Population density: 2020 estimates
Carte-monde.org · November 2026
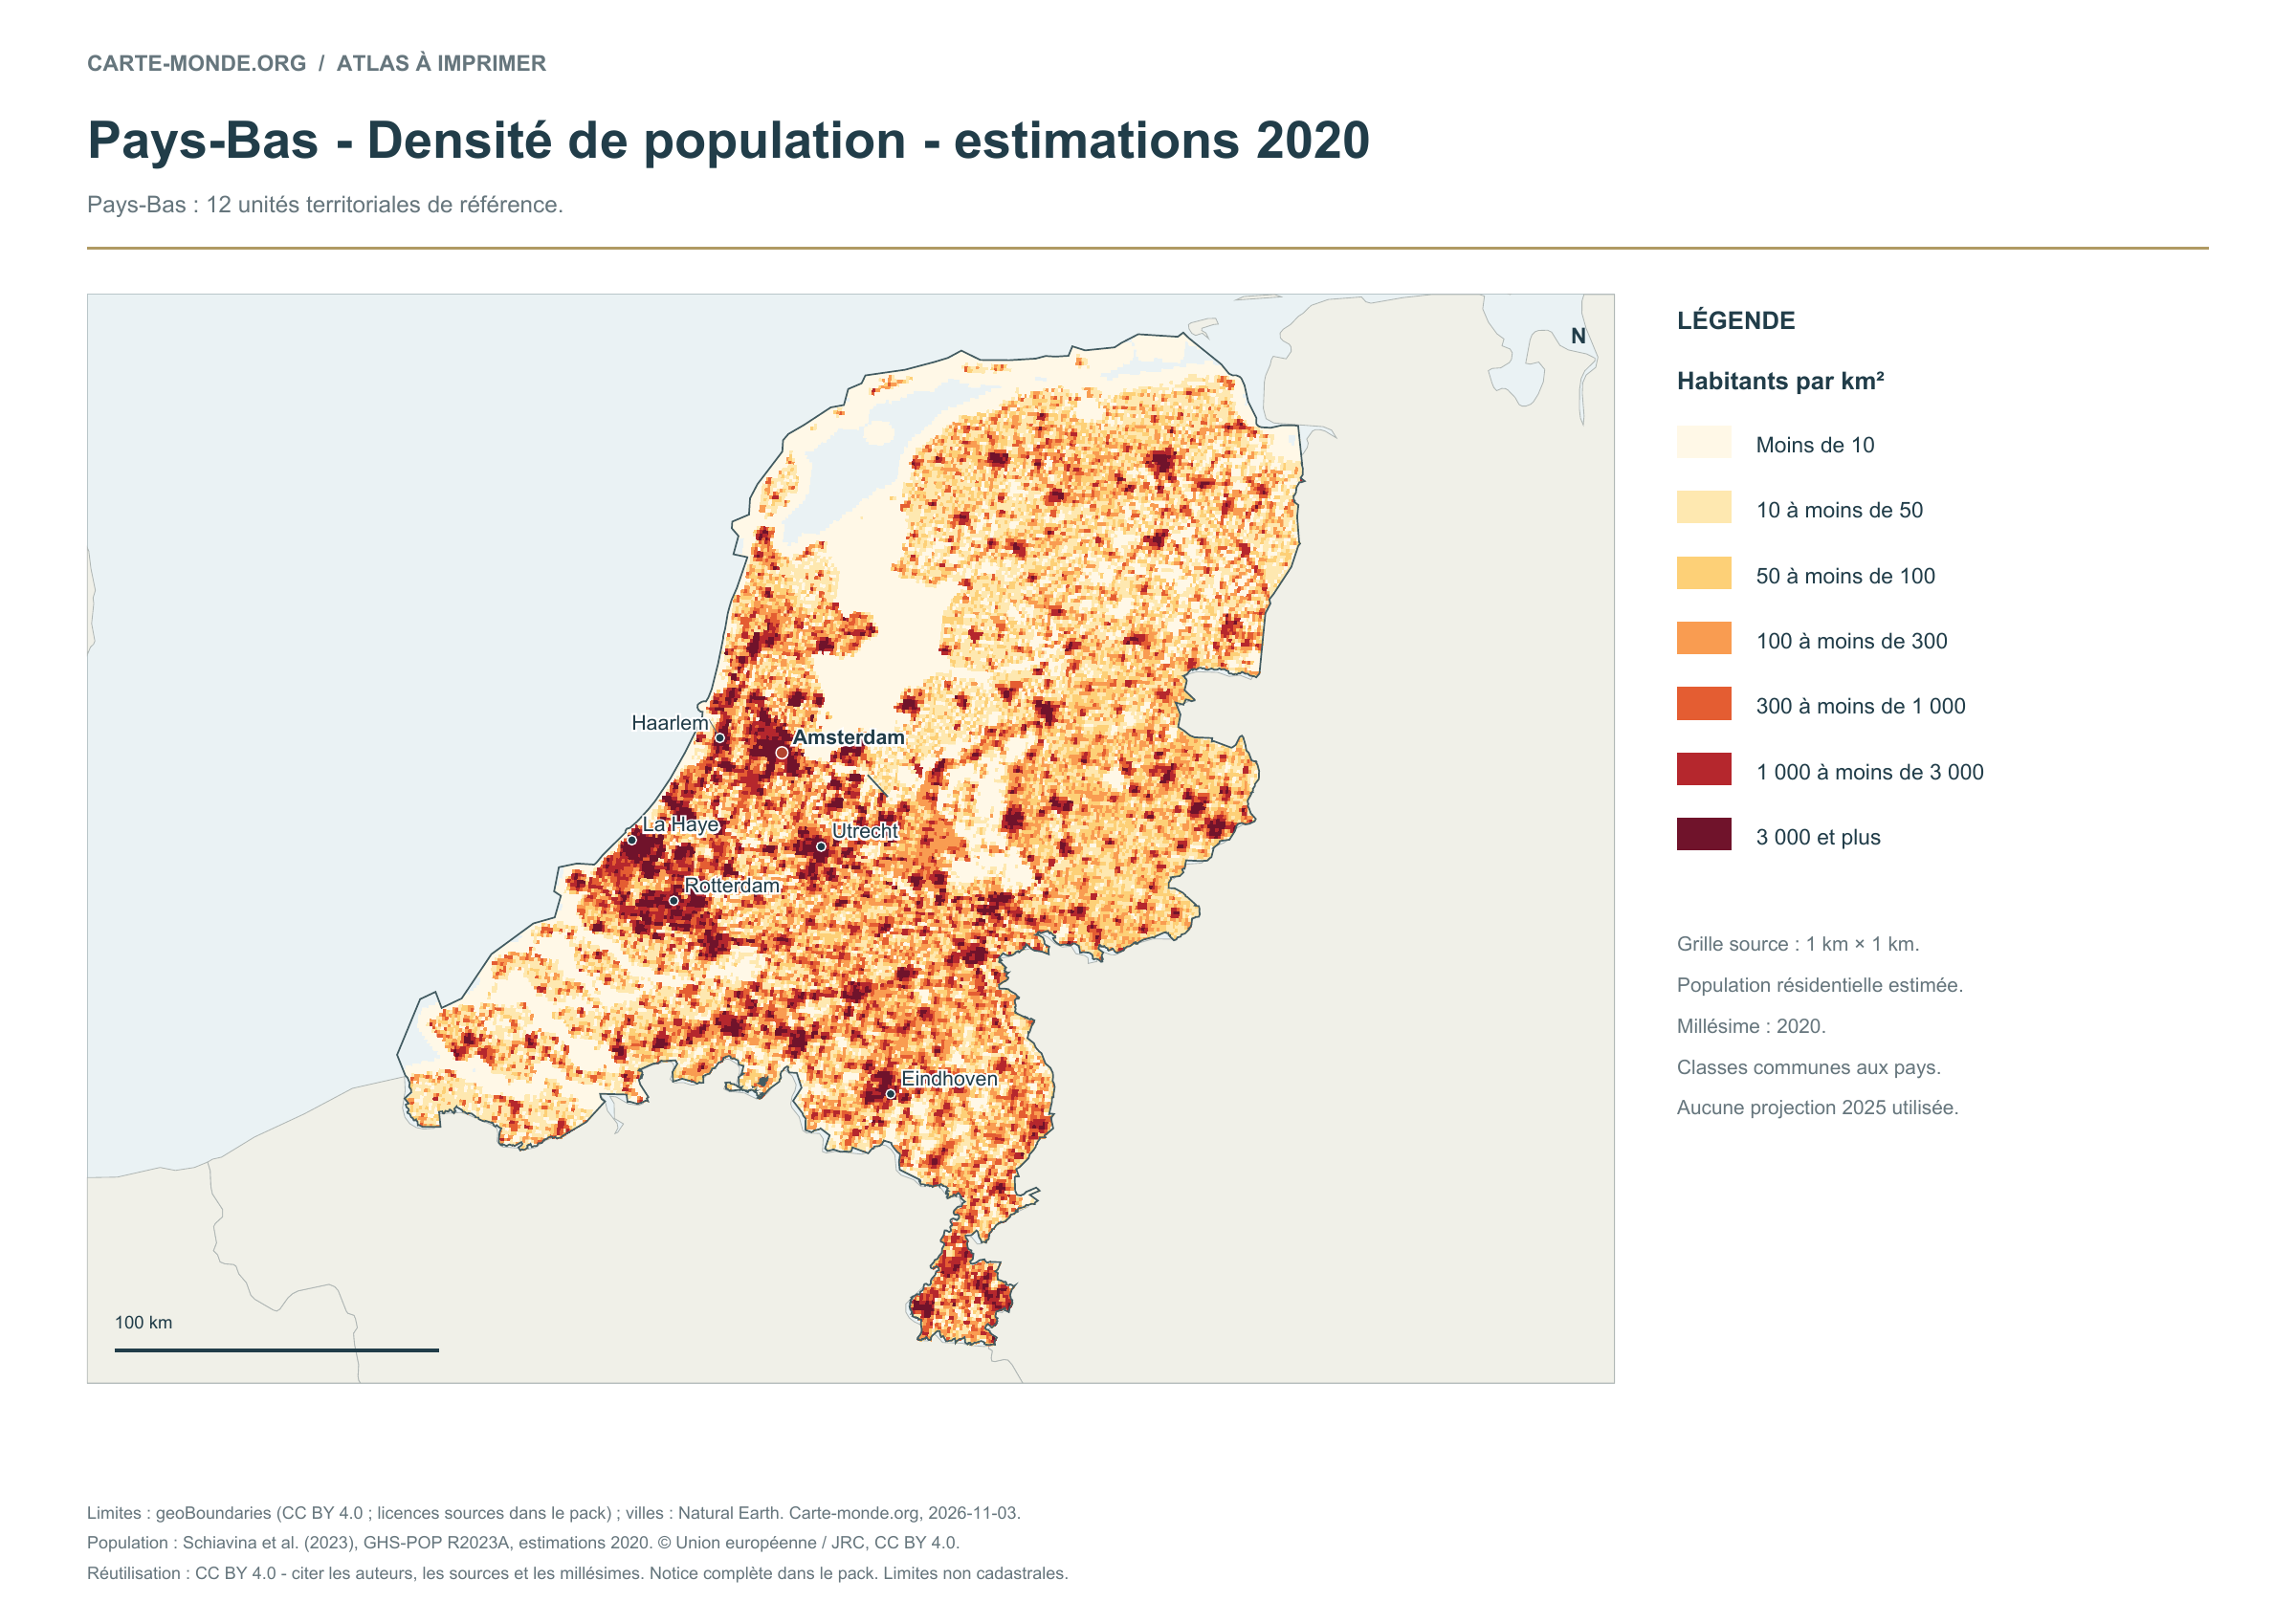
Population density — 2020 estimates
Estimated residential population in 2020, on a source grid of 1 km². Inhabitants/km² classes are shared across countries; no 2025 projection. Cells without data remain transparent and do not represent zero population.
A4 landscape PDF · PNG 2 400 px · CC BY 4.0
The data represents estimated residential population in 2020, on a 1 km² source grid. The document’s creation date does not change this reference year.
The five in-house maps in one pack
Regions and cities, location in Europe, simplified elevations, 2020 population density and shaded relief: five A4 PDFs, their PNGs and SVGs, with sources and licences.
Download the five maps — ZIPPrevious edition packs
The four maps in one pack
Four A4 PDFs, their PNGs and SVGs, with full notes. Terrain and density use an embedded image background; text and linework remain vector-based.
Find the old maps of the Netherlands
Previously published maps remain accessible at their original URLs, with the collection’s text and credits.
Choose and print a map
Regions and cities show how the territory is organized; the location map places the country; terrain shows the main natural regions; density shows population distribution. Print the in-house PDFs in A4 landscape with “Fit to page”. Insets have their own scales.
Sources, reference years and reuse
Administrative boundaries: geoBoundaries / National Georegister. European Netherlands, excluding the Caribbean — Geographic data date: 2022. The file edition date does not mean that all boundaries have been updated. Boundary source and terms. Primary licence: CC0 1.0 Universal (CC0 1.0) Public Domain Dedication. The geometries used and credits are included in the pack; derived databases under ODbL remain under ODbL.
Neighbouring area, cities and hydrography: Natural Earth 5.1.1, public domain, generalised boundaries not for cadastral use.
Relief: SRTM15+ / Tozer et al. (2019), reference publication, via GMT earth_relief_02m derived from SRTM15+V2.7. Grid smoothed to two arc minutes, suitable for a national overview, without topographic precision.
Population: Schiavina et al. (2023), GHS-POP R2023A, 2020 residential estimates, © European Union / JRC, CC BY 4.0. The 1 km² Mollweide cells are expressed in inhabitants/km². Methodology: Pesaresi et al. (2024).
The four new maps: created by Carte-monde.org, November 2026, under CC BY 4.0. Cite authors, sources and reference years, and indicate adaptations. Additional and older maps retain their own rights.
Country maps · Other maps and archives
Previous versions: maps and files preserved
These files remain available at their original URLs. For corrected maps, use the main links above. Each edition retains its credits and date.
- pays-bas-physique-relief-villes-fleuves-2026-11-03.pdf
- pays-bas-physique-relief-villes-fleuves-2026-11-03.png
- pays-bas-physique-relief-villes-fleuves-2026-11-03.zip
Raster base map, cities, rivers and lakes: Natural Earth, public domain. Other boundary credits and licences are retained in the pack. Cartographic work CC BY 4.0; ODbL-derived data retains its licence. No topographic accuracy is claimed.
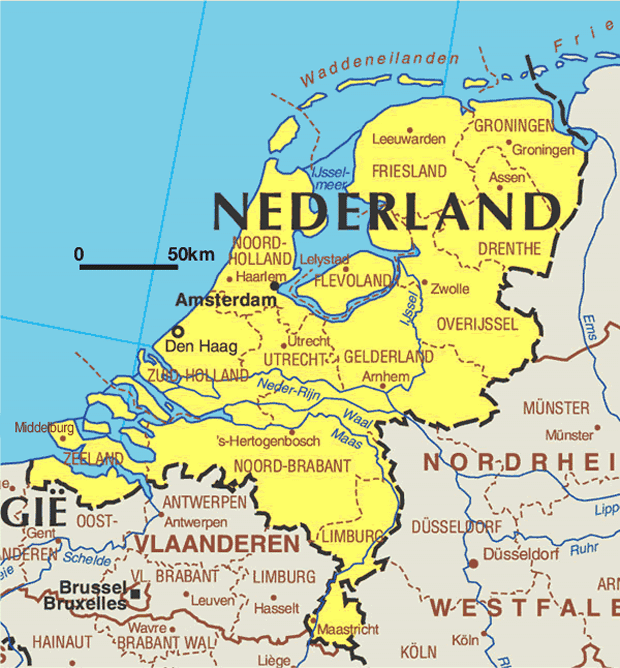
Previous collection — original files preserved
 |
 |